A derived metric is composed of an atomic metric, a period, and one or more modifiers. It reflects the status of a business activity within a specified period and scope. For example, a derived metric can represent the sales amount in Shanghai over the past week. This topic describes how to create derived metrics and perform related operations, such as managing versions, viewing associated tables, and exporting or deleting them.
Before you begin
Before you create a derived metric, complete the following prerequisites.
|
Item |
Description |
|
Defines the business criteria and calculation logic for a business activity. |
|
|
Defines the business scope for a business activity. |
|
|
Defines the time range for a business activity. |
|
|
Defines the analytical dimensions for a business activity. |
|
|
Select the appropriate layer based on your requirements.
|
|
|
Create the following as needed: |
|
How it works
A derived metric is a numerical indicator of the status of a business activity that typically combines an atomic metric, a period, and one or more modifiers. Each derived metric belongs to exactly one atomic metric and reflects its value under specific time and business conditions.

-
An atomic metric defines the statistical criteria and calculation logic of a business. For example, total number of orders.
-
A period defines the time range for the statistics. For example, a single calendar day.
-
A modifier limits the scope of a business activity. For example, online fresh food store and offline fresh food store. A derived metric can contain one or more modifiers.
-
A derived metric combines an atomic metric, modifiers, and a period. It measures the value of a target metric under specific time, dimensional, and business conditions, reflecting the status of a specific business activity. For example, you can calculate the
total number of orders from online fresh food stores in a single dayor thetotal number of orders from both online and offline fresh food stores in a single day.
Go to the derived metrics page
-
Log on to the DataWorks console. In the target region, click in the left-side navigation pane. Select a workspace from the drop-down list and click Go to Data Modeling.
-
In the top navigation bar of the Data Modeling page, click Data Metrics to go to the Derived Metric page.
On this page, you can create derived metrics in the Common Layer or Application Layer to reflect the status of business activities based on your requirements. You can create a single derived metric or multiple derived metrics in bulk.
Business activities in an enterprise are often complex and diverse. For a given data domain and business process, you may need to analyze multiple business activities over different periods and within various scopes. We recommend using the bulk creation feature to quickly generate multiple derived metrics for a specific type of business activity. For more information, see Create derived metrics in bulk. To create a single derived metric, see Create a single derived metric.
Create derived metrics in bulk
-
Select the metric type.
On the Derived Metric page, move the pointer over the
 icon and click Multiple Derived Metrics.
 -
Create a model to generate derived metrics in bulk.
-
Select the atomic metrics, modifiers, and periods that compose the derived metrics.
No.
Description
1
On the left side of the canvas, select the Atomic Metric, Period, and Modifier needed to create the derived metrics.
Note-
If no suitable Atomic Metric, Period, or Modifier are available, click Create to create new ones.
-
Each derived metric is composed of one Atomic Metric, one Period, and one or more Modifier.
2
On the right side of the canvas, a render tree displays the derived metrics for bulk creation. The metric statuses are as follows:
-
 : Indicates that the derived metric to be created does not currently exist.
 -
 : Indicates that the derived metric already exists. The system automatically filters out existing metrics when you generate new ones.
 -
 : Copies the current metric.
3
In the upper-right corner of the canvas, you can change how the render tree is displayed. For example, you can zoom in, zoom out, center the view, or switch to full screen.
-
-
Click Generate Derived Metrics.
-
-
Generate the derived metrics in bulk.
-
Select a data warehouse layer and a checker.
In the Generate Derived Metrics dialog box, select whether the derived metrics belong to the common layer or the application layer based on your requirements. You can also select a checker to validate the metric naming conventions.
NoteIf no checker is available, you can create one in data warehouse planning. For more information, see Configure data warehouse layer checkers.
-
Click Next Step.
-
Select the target derived metrics to generate.
-
Based on your business requirements, select the derived metrics to generate from the created metric model. By default, all derived metrics in the model are selected. In the list, select the checkboxes of the target metrics. The list displays information such as Display Name, Abbreviation, Canvas Preview Name, and Business Process. The total number of metrics and the number of selected metrics are shown at the top.
-
Click Create or Create and Submit to create the derived metrics in bulk.
-
Create: Creates the selected metrics. After creation, you must go to the metric editing page to submit them individually.
-
Create and Submit: Creates and submits the selected metrics. Only submitted metrics can be referenced by model tables.
After the derived metrics are successfully created, the status of the target metrics in the render tree changes from
to .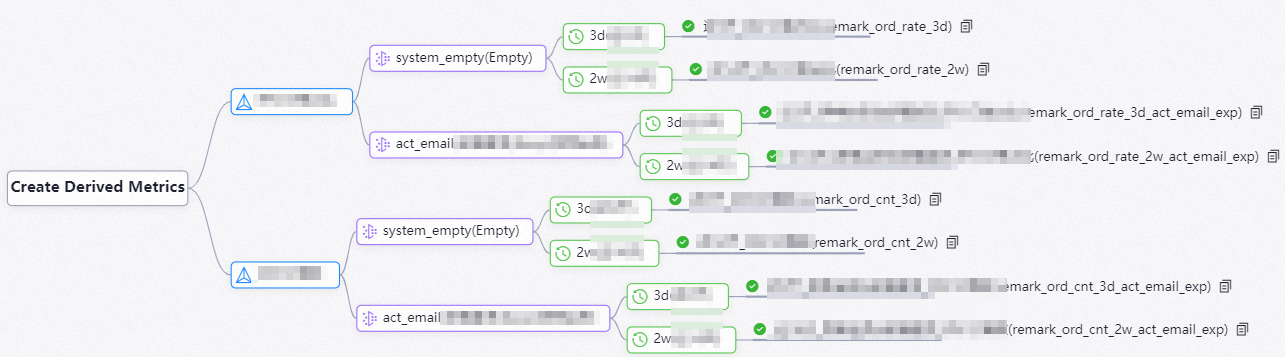
-
-
-
View the created derived metrics.
You can view information about the derived metrics in the derived metric list.
-
Create a single derived metric
-
Select the metric type.
On the Derived Metric page, move the pointer over the
icon and click Derived Metric. -
Create a new derived metric.
-
Configure Business Logic.
Select the period, modifiers, and atomic metric for the derived metric based on your business needs. The following table describes the parameters.
Parameter
Description
Period
The time range for the statistical analysis of a business activity. Examples: last day, last week.
Modifier
The scope limitation for the statistical analysis of a business activity. Examples: online, offline.
Atomic Metric
Defines the calculation logic for the target business activity and its statistical values. Example: order amount.
-
Configure Basic Information.
You can create metrics for the DWS layer or ADS layer as needed. The following table describes the basic information parameters for a derived metric.
Parameter
Description
Data Layer
Select the layer to which the derived metric belongs.
Business Category
The business category to which the derived metric belongs. Business categories can be associated with data domains and data marts.
This parameter is required when you select the DWS layer for Data Layer.
Business Process
The category of the business activity.
This parameter is required when you select the DWS layer for Data Layer.
Mart/Subject
The category of the business activity for a specific scenario or product.
This parameter is required when you select the ADS layer for Data Layer.
Display Name
The display name of the derived metric. Click Intelligent Recommendation on the right to generate a name in the
period + modifier + atomic metricformat. This format helps you quickly understand the metric's meaning.Note-
The Intelligent Recommendation option is displayed only after you configure the Atomic Metric and Period in the Business Logic section.
-
You can also use the drop-down icon next to Intelligent Recommendation to select a checker to validate the metric naming. If no suitable checker is available, you can create one. For more information, see Configure data warehouse layer checkers.
Abbreviation
The abbreviation of the derived metric. Click Intelligent Recommendation on the right to generate a name in the
atomic metric + period + modifierformat. This format helps you quickly understand the metric's meaning.Note-
The Intelligent Recommendation option is displayed only after you configure the Atomic Metric and Period in the Business Logic section.
-
You can also use the drop-down icon next to Intelligent Recommendation to select a checker to validate the metric naming. If no suitable checker is available, you can create one. For more information, see Configure data warehouse layer checkers.
Name
The English name of the derived metric.
Owner
The owner of the derived metric. By default, this is the user who created the metric.
Description
The description of the derived metric.
-
-
-
Click Save.
-
Click Submit to publish the current version of the derived metric. Only submitted derived metrics can be referenced by model tables.
Note-
Only saved derived metrics can be submitted.
-
Each submission of a derived metric generates a new version. A version that has been successfully submitted cannot be submitted again.
-
Version management and associated tables
In the right-side navigation pane of the metric editing page, you can manage metric versions or view associated tables.
|
Actions |
Description |
|
Manage versions |
View all version information for the metric. You can also perform the following operations:
|
|
View associated tables |
View the model table fields associated with the metric. Click View Details next to a field to go to the model table's details page for more information. |
Export derived metrics
The Derived Metrics page supports three bulk export methods. To export all metrics, click Export All. To export only your search results, narrow the scope and then click Export Searched from the Bulk Export drop-down menu. To export only specific metrics, select them and then click Export Selected from the Bulk Export drop-down menu.
-
Go to the derived metric list page.
Click the
 icon to go to the derived metric list, where you can view all created derived metrics.
 -
Select the metrics to export.
NoteThis step is not required when you use the Export All method.
You can select metrics in one of the following two ways:
-
Search by keyword: Enter a keyword in the search box to find the desired metrics.
NoteFuzzy matching is supported. Entering a keyword returns all derived metrics whose names contain that keyword.
-
Direct selection: Select the checkboxes of the desired metrics.
-
-
Export the derived metrics in bulk.
You can export metrics in one of the following three ways based on your needs:
-
Export All: Exports all derived metrics created in the current workspace.
-
Export Searched Objects: You must first enter a keyword in the search box to find the desired metrics. This method exports all matching search results.
-
Export Selected Objects: You must first select the desired metrics. This method exports all selected metrics.
-
-
View and download the export results.
After the derived metric export task is initiated, the page automatically redirects to the Derived Metric Export Status Details page, where you can view the export status. After a successful export, click Download File to download the derived metrics to your local machine.
Bulk delete and submit
If you have multiple obsolete derived metrics or multiple created metrics that have not been submitted, you can go to the derived metric list to delete or submit them in bulk.
-
Go to the derived metric list page.
Click the
icon to go to the derived metric list. On this page, you can view information about all created derived metrics. -
Select the metrics for the bulk operation.
NoteYou can only bulk-submit derived metrics that have been saved but not yet submitted.
-
Delete or submit the metrics in bulk, depending on your business needs.
-
Batch Delete: Deleted metrics can no longer be associated with or referenced by model tables.
NoteIf a derived metric is referenced by a model table, you must first remove the reference before you can delete the metric.
-
Batch Submit: Submitted metrics can be associated with and referenced by model tables. A new version record is generated for each submission. For more information about metric versions, see Version management and associated tables.
-
Next steps
After you create a derived metric, you can reference it in a DWS or ADS table. This provides a foundation for subsequent business queries, OLAP analysis, and data distribution. For more information about how to reference derived metrics, see Materialize a logical model.