Diagnose and govern node issues
The DataWorks Data Asset Governance plugin is an AI-driven tool built into Data Studio. It helps you identify and fix code issues in real time, improving both code quality and data security.
Overview
The data development issue diagnosis feature integrates two core capabilities: real-time syntax diagnosis (LSP) and development health check. These capabilities work together to ensure your code quality.
Capability | Real-time syntax diagnosis (LSP) | Development health check |
Core responsibility | Real-time syntax checks and static code analysis. | Rule-based checks for data standards, security, and performance issues. |
Trigger | Triggered in real time as you edit code. |
|
Problems solved | SQL syntax errors, incorrect function usage, and more. | This feature offers a built-in rule library that covers issues such as improper partition use, cross-project writes, and inconsistent JOIN column types. It also supports a custom rule library powered by DataWorks Copilot. |
Fix method | Assisted fixes with DataWorks Copilot. | Provides AI-powered fix suggestions and quick fixes. |
If your code has syntax errors, only real-time syntax diagnosis (LSP) triggers. The development health check runs only after you resolve all syntax errors.
Failed checks do not affect code execution.
Region availability
Deep scan is supported only in the following regions: China (Hangzhou), China (Shanghai), China (Beijing), China (Zhangjiakou), China (Ulanqab), China (Shenzhen), China (Chengdu), and China (Hong Kong), and Singapore.
Features other than deep scan are supported only in the following regions: China (Hangzhou), China (Shanghai), China (Beijing), China (Zhangjiakou), China (Ulanqab), China (Shenzhen), China (Chengdu), China (Hong Kong), Singapore, Malaysia (Kuala Lumpur), Indonesia (Jakarta), Germany (Frankfurt), US (Silicon Valley), and US (Virginia).
Quick start
Follow these steps to experience the core workflow of code issue diagnosis and fixing within 5 minutes.
Enable quality check features
Go to DataWorks Data Studio, click
 > Setup at the bottom of the left-side navigation pane, and go to the User tab of the Setup page. Make sure that
 Data Governance>DataStudio Governance Check Module EnablementandLspSetting>SyntaxErrorEnableare both selected (enabled by default).NoteDataStudio Governance Check Module Enablement controls the Data Asset Governance plugin check feature, and SyntaxErrorEnable controls the real-time syntax diagnosis feature. They are responsible for different levels of code quality checks, and both must be enabled for full issue diagnosis capabilities.
Write sample code with issues
Create a MaxCompute ODPS SQL node and paste the following sample code that contains errors into the editor.
-- Example: Create a table in SQL
CREATE TABLE IF NOT EXISTS my_partitioned_table (
    id STRING,
    name STRING,
    value BIGINT
)
PARTITIONED BY (ds STRING)
LIFECYCLE 365;

-- Example: Syntax error
SELEC name FROM my_partitioned_table;
Identify LSP syntax issues
The LSP detects issues in real time. You will see a red wavy underline on
SELEC, indicating a syntax error. Click the icon in the lower-left corner of the page, and view the code issues in the Problems panel.
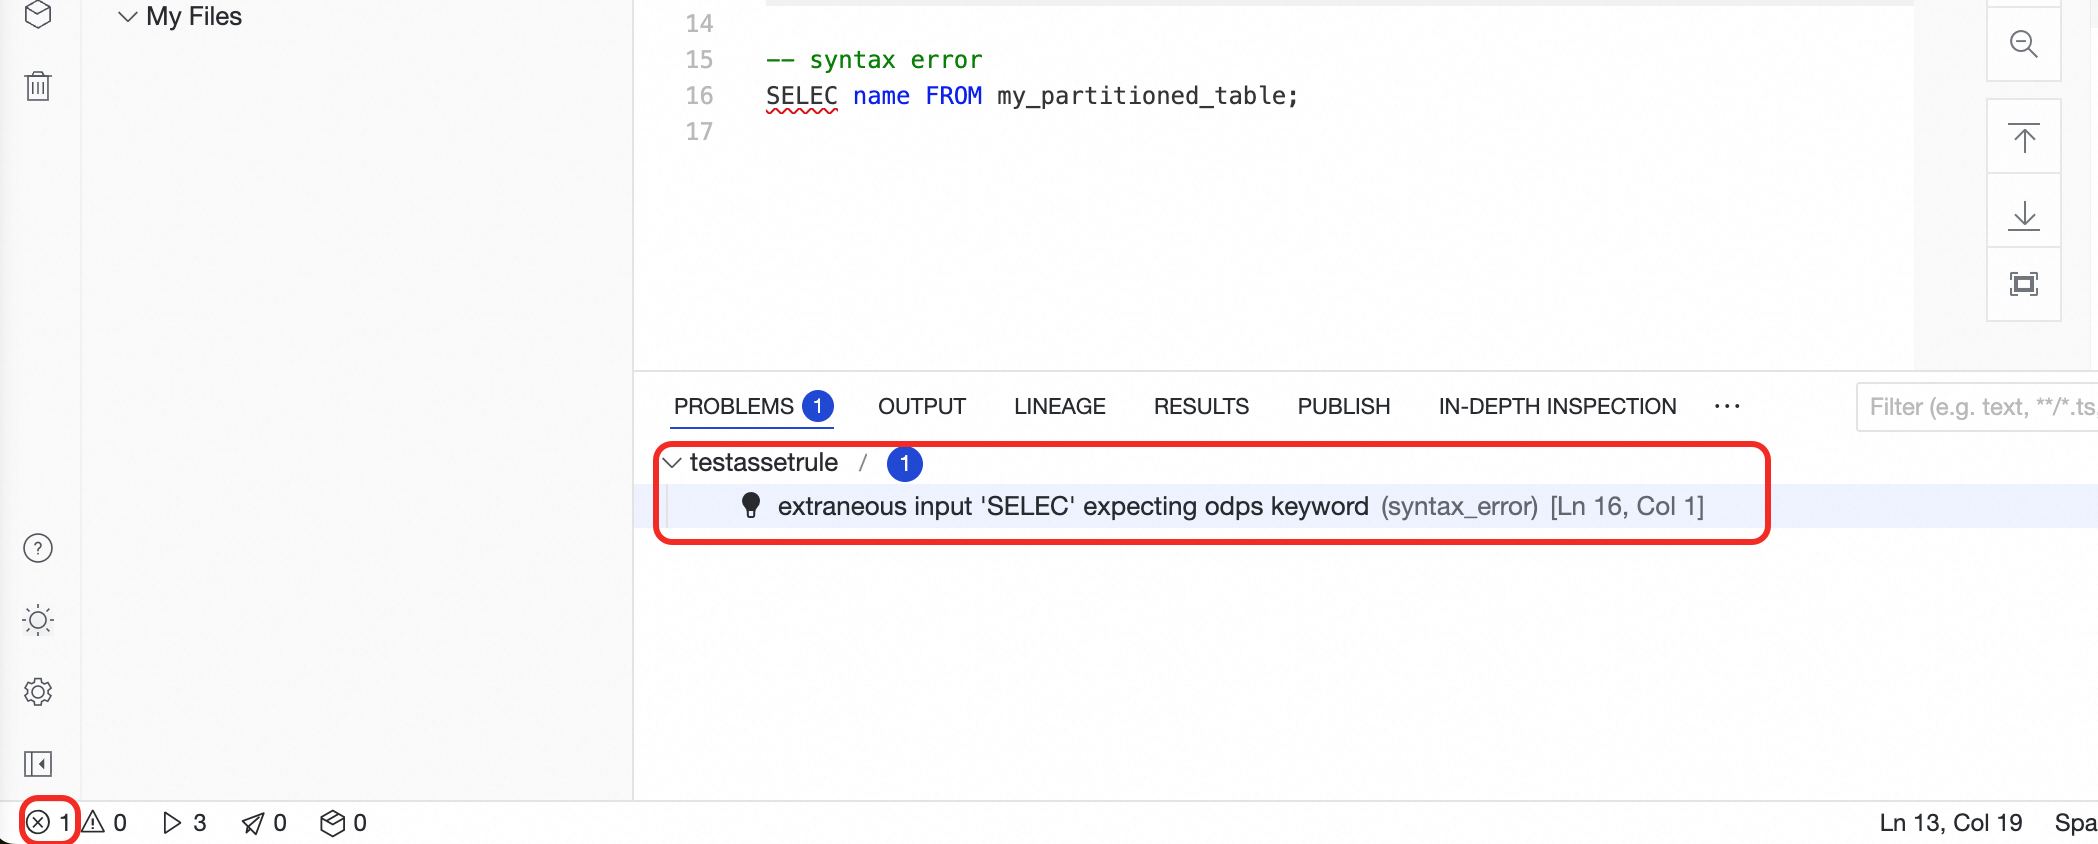
Fix LSP syntax issues
Hover over the red-underlined
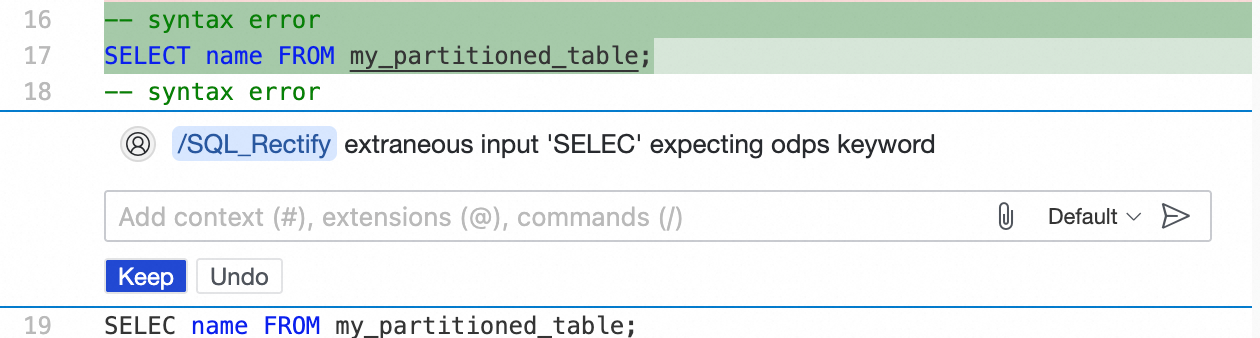
SELEC, click the light bulb icon that appears, and use DataWorks Copilot to quickly fix it toSELECT.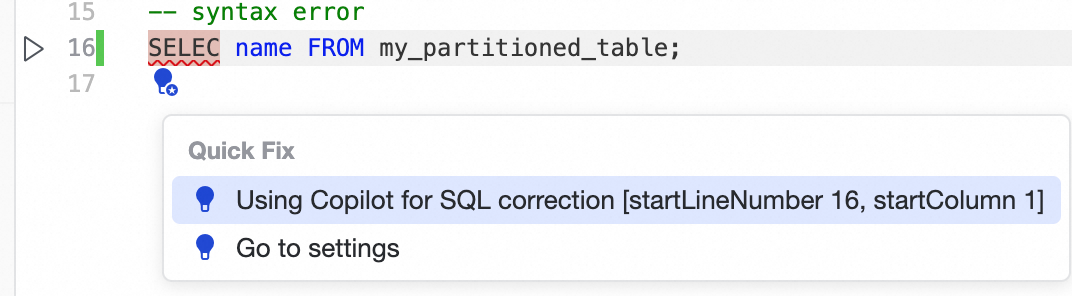
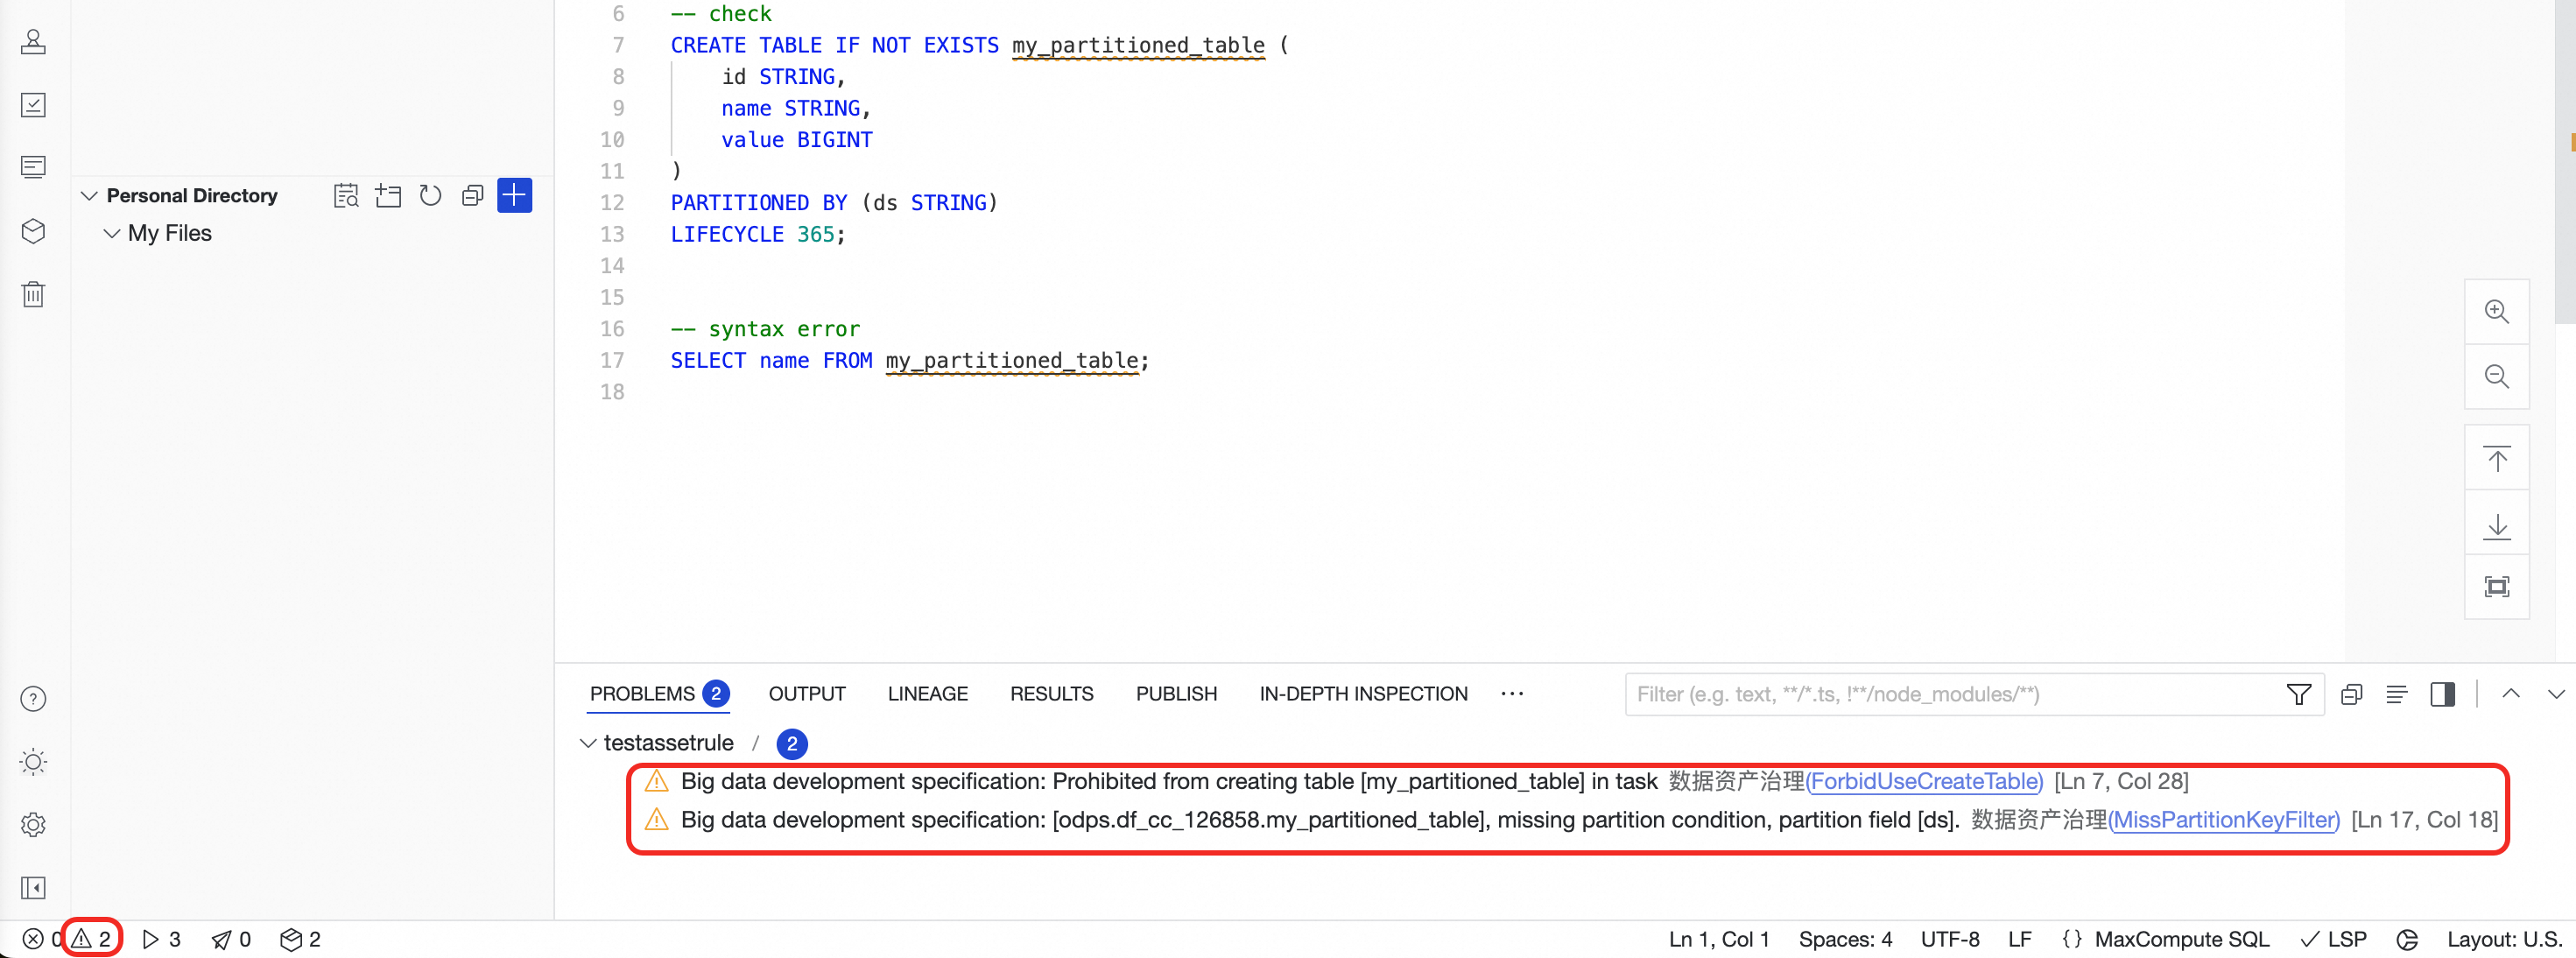
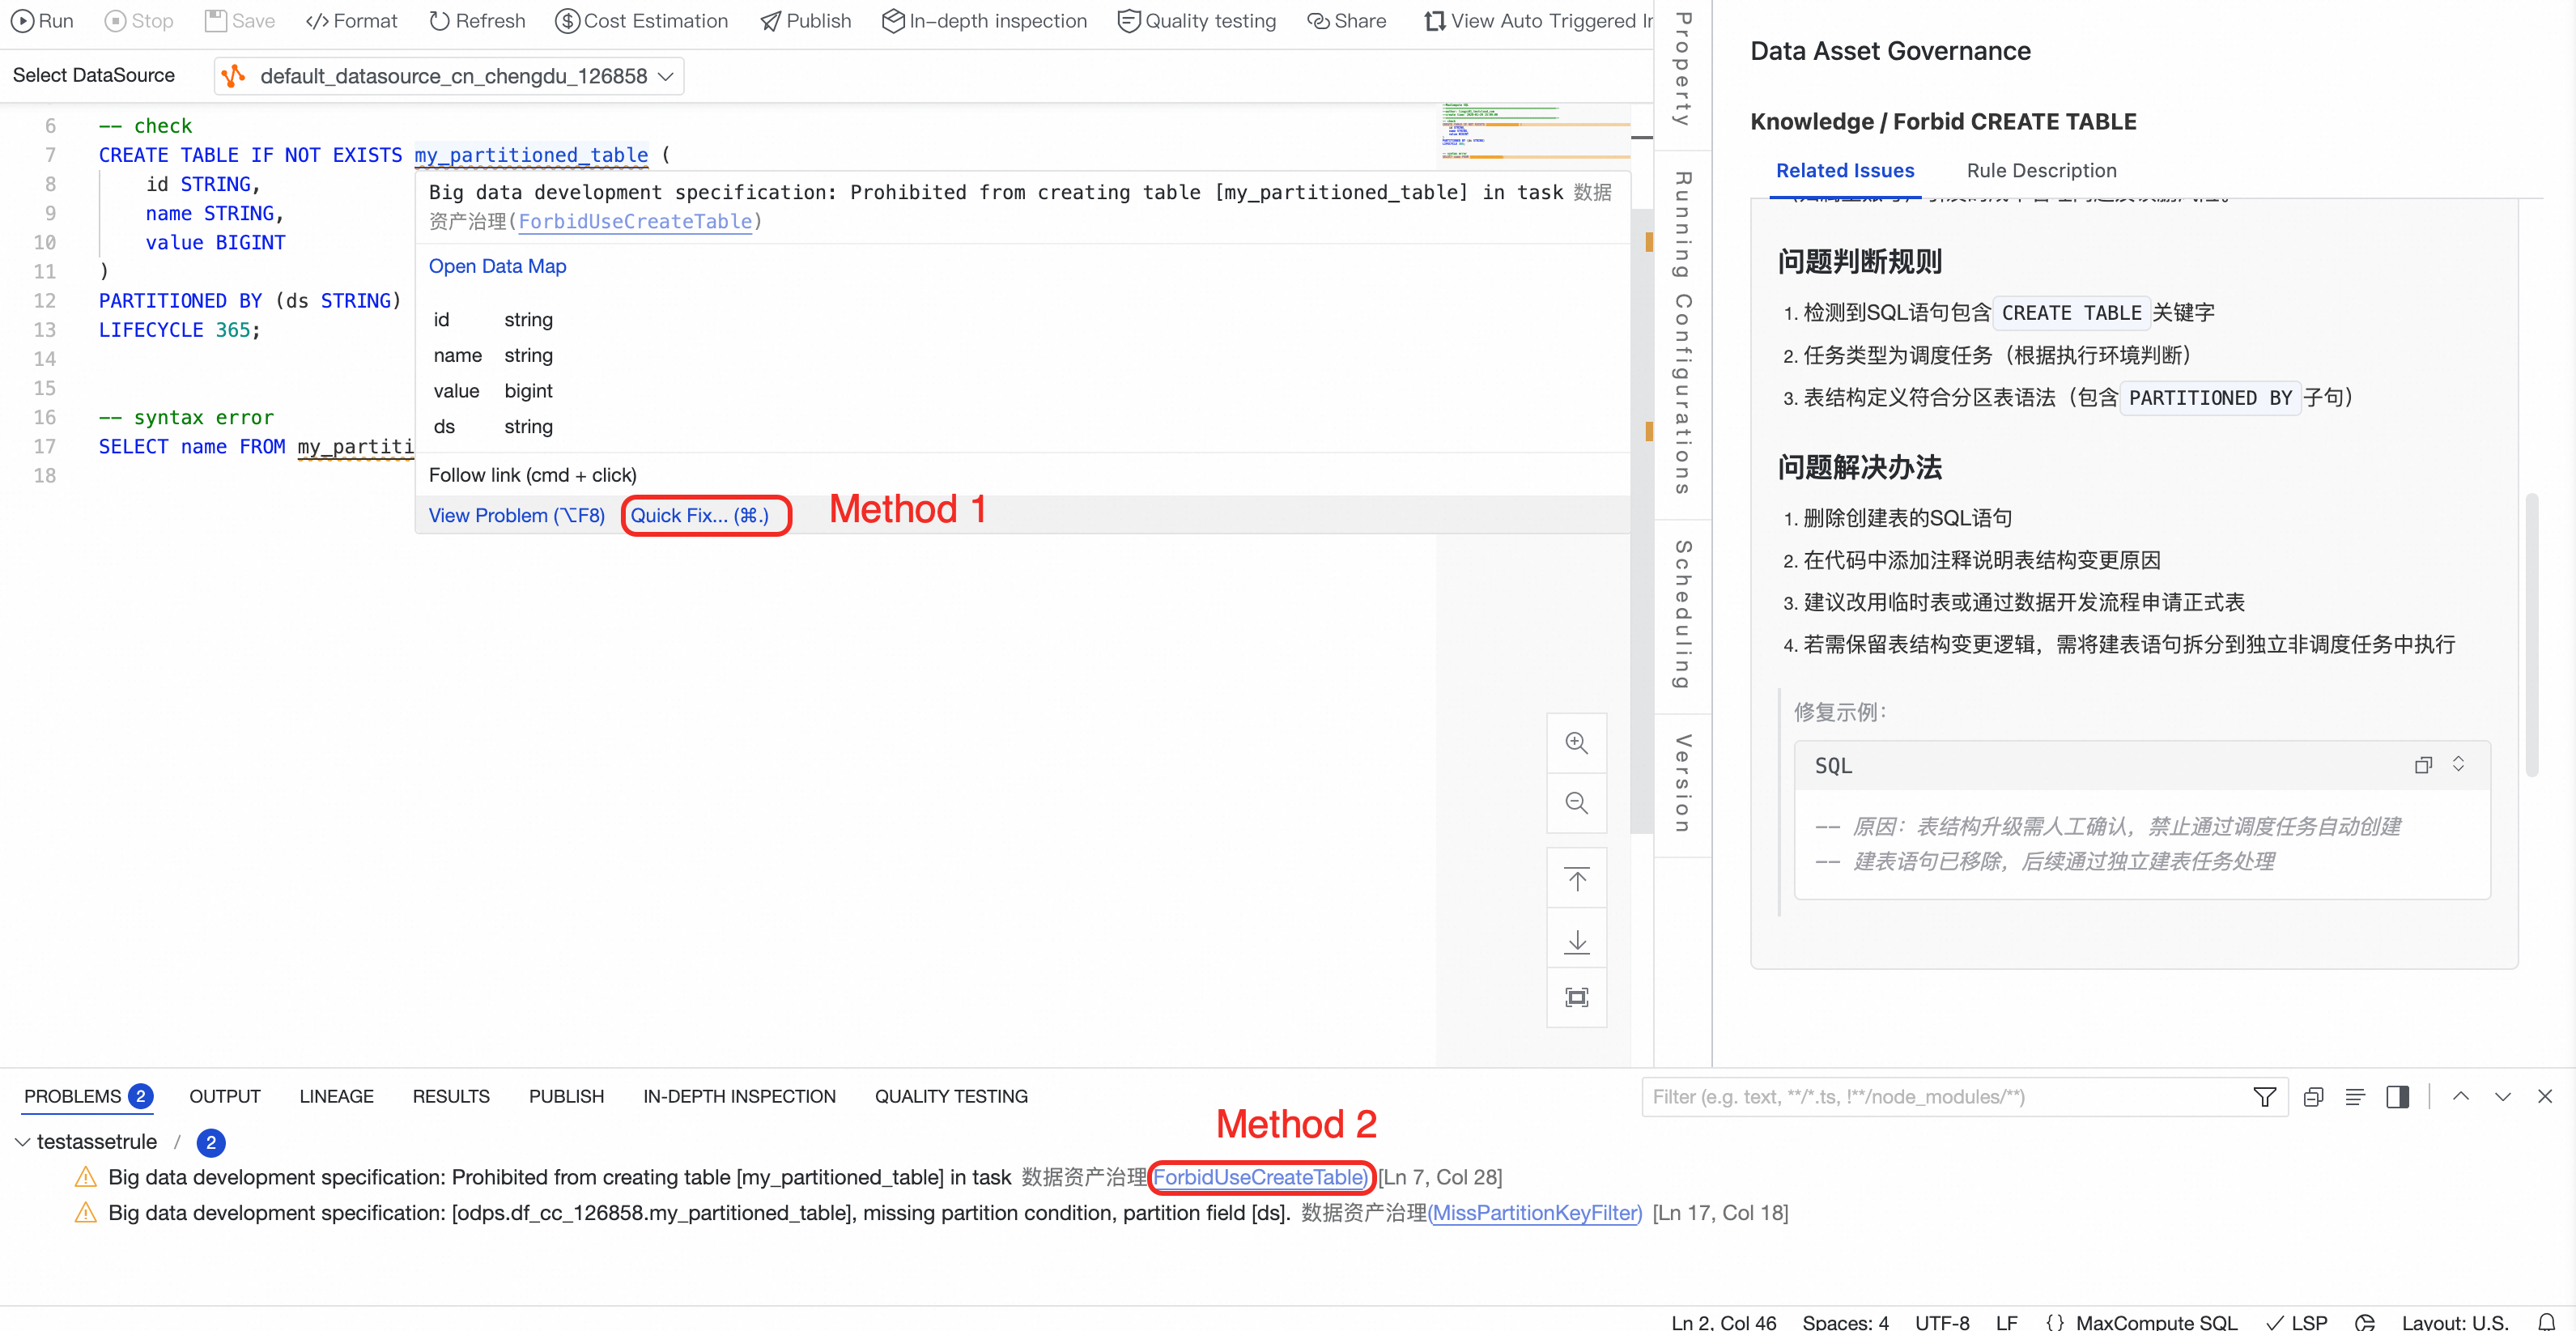
Identify governance rule issues
After you click Save, the editor checks code issues based on the enabled rules of the Data Asset Governance plugin. In this case, two built-in development health check rules are triggered:
CREATE TABLE is not allowedandPartitioned table queries must include partition filters.If the Problems panel does not appear automatically, click the
 icon in the lower-left corner of the page to open the Problems panel.
Fix governance rule issues
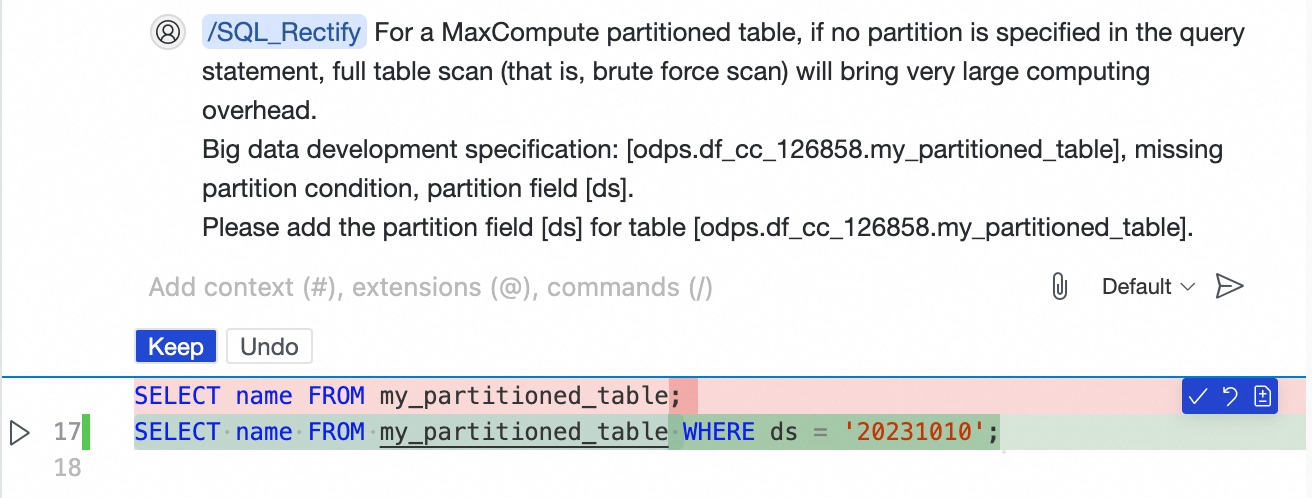
You can hover over my_partitioned_table and click Quick Fix, or click the hyperlink in the Problems panel. After the fix suggestion is generated, verify that it meets optimization requirements, and then apply the suggestion.
In this example, use the quick fix to fix the second SQL statement.
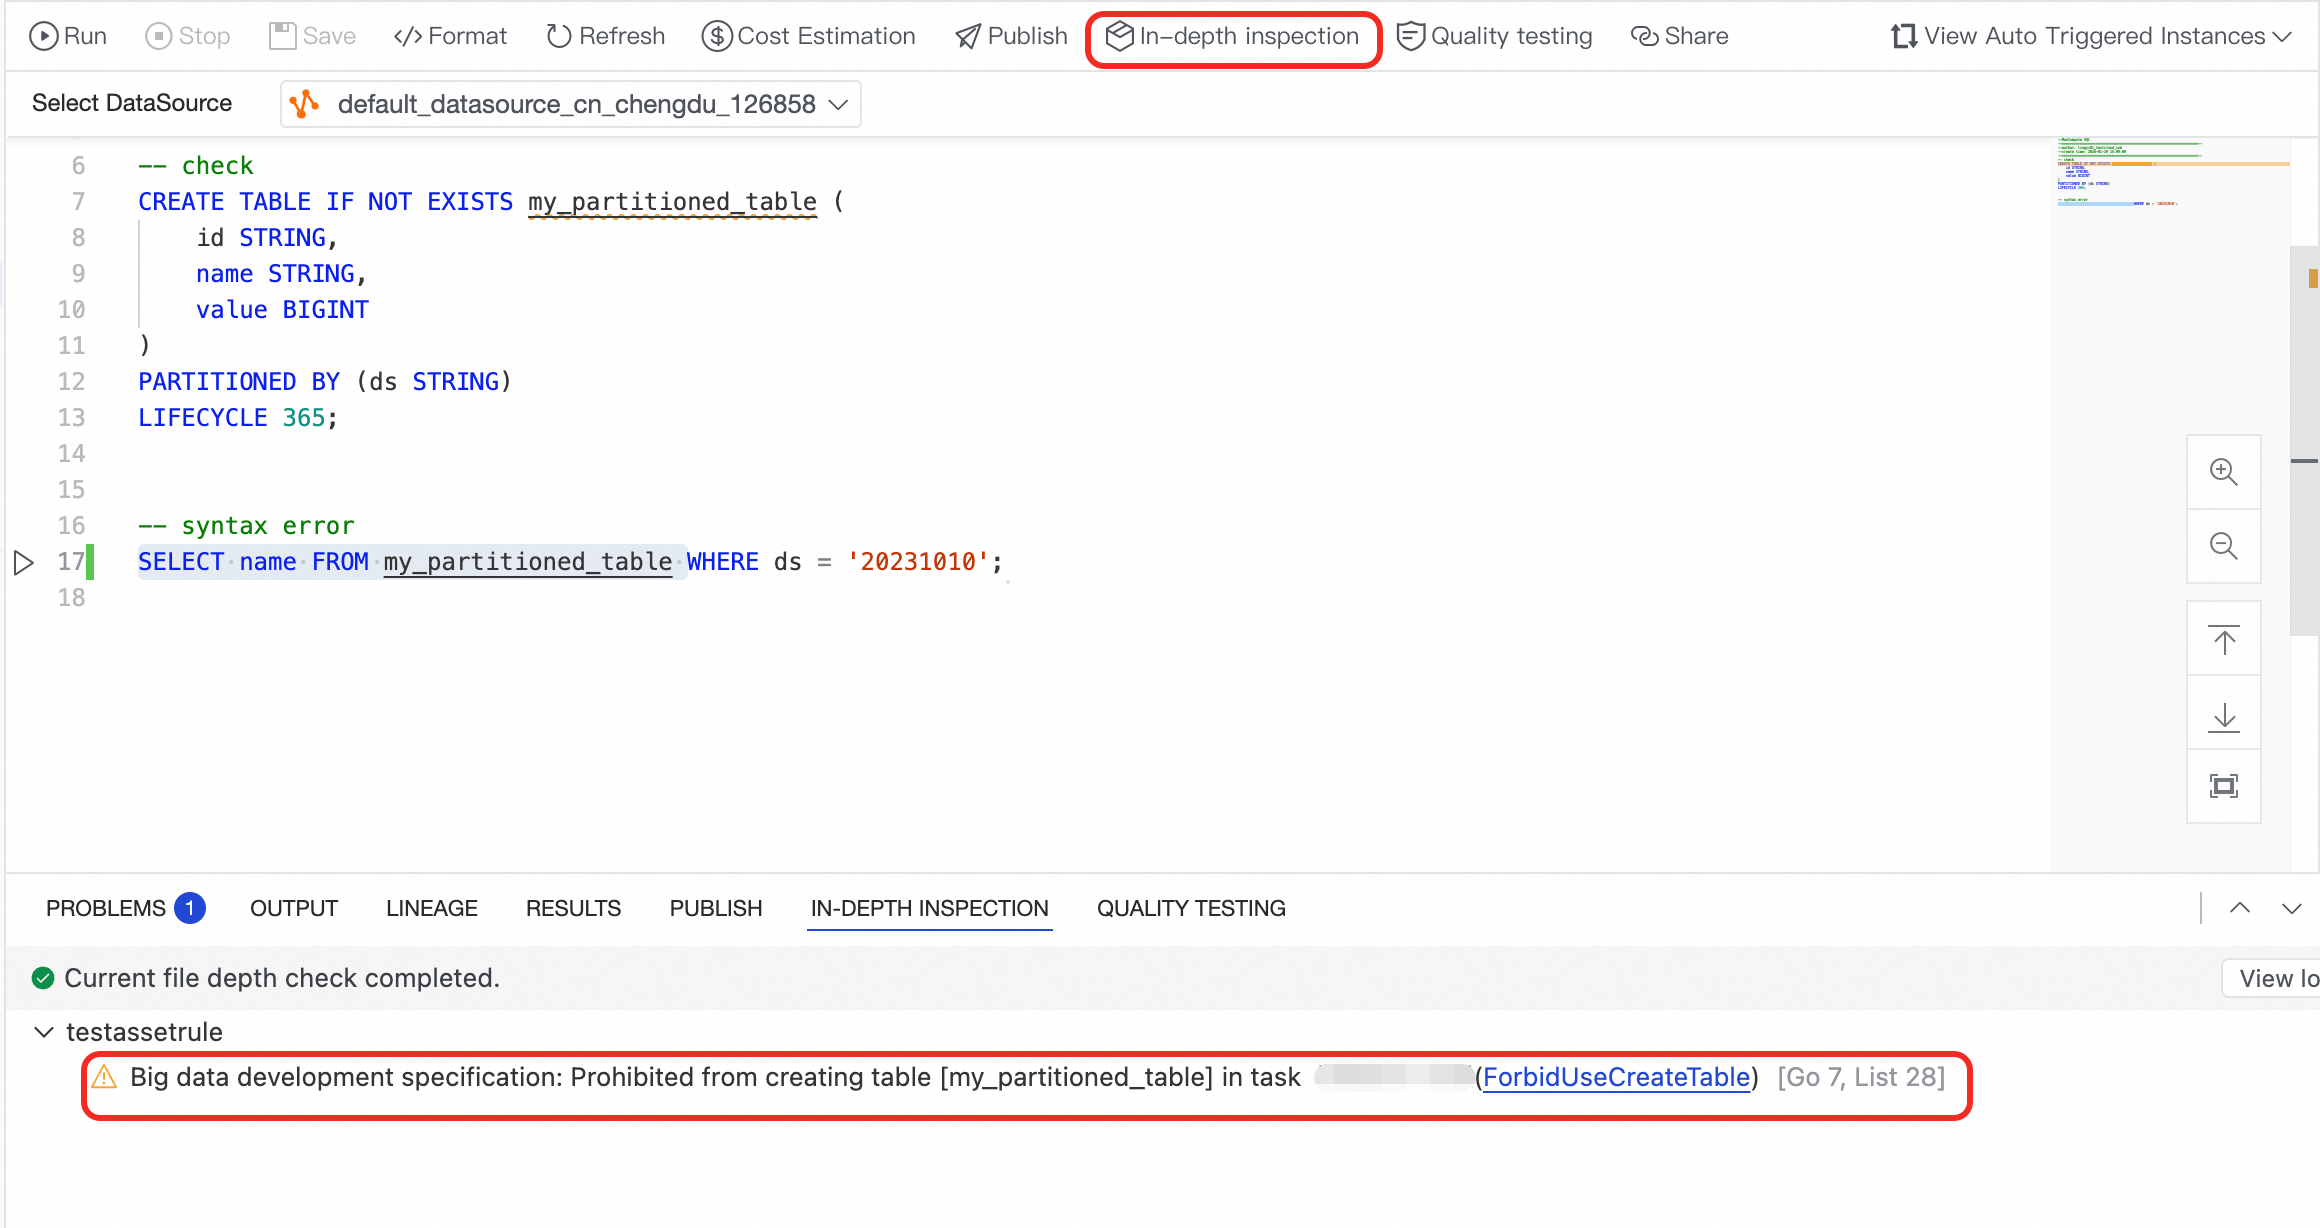
Initiate a single-file deep scan
After you fix the issues, you can perform a deep scan on the code of a single node. For example, after fixing only the
Partitioned table queries must include partition filtersrule, click In-depth Inspection. The editor performs a deep scan of the file and displays the unresolvedCREATE TABLE is not allowed in tasksissue.
Core features
Configuration settings
Configure the issue diagnosis feature based on your preferences. All configuration settings apply only to the current logged-in account.
Go to the DataWorks workspace list page, find the target workspace, and click Actions > Quick Access > Data Studio.
Click
> Setup at the bottom of the left-side navigation pane, and go to the User tab of the Setup page.
Configuration path | Configuration name | Description | Valid values | Default value | Impact |
Data Studio |
| Enable the Data Asset Governance plugin |
|
| Controls whether data standards, security, and performance issues are checked when you save a node. |
LspSetting |
| Enable real-time syntax diagnosis |
|
| Controls whether syntax errors are displayed in real time as you edit code. |
LspSetting |
| Syntax error severity level |
|
| Controls the severity level of syntax errors displayed in the editor, such as red wavy underlines (Error) or yellow wavy underlines (Warning). |
Built-in rule library management
The check behavior of the Data Asset Governance plugin is driven by rule libraries, which are divided into built-in rules and custom rules. You can enable or disable specific rules as needed.
Rule library management applies only to the current Alibaba Cloud account.
In the left-side navigation pane of the Data Studio page, click the governance icon
to open the Data Asset Governance plugin configuration.In the Built-in Rule Library section of the Data Asset Governance plugin panel, find the target governance rule and click the toggle icon next to it to enable or disable the rule.
Enabled (default): The rule is checked when you save a node.
Disabled: The rule is not checked when you save a node.
Custom rule library
When built-in rules cannot meet the specific business logic or coding standards of your team, the Data Asset Governance plugin provides a custom rule library. You can define new check rules by using natural language descriptions and positive/negative examples.
Supported custom rule scenarios
Check dimension | Core check content | Primary value | Supported scope |
Code text | The raw code in a node, such as SQL scripts. | Checks code style, prohibited keywords, and best practices. | All task types |
Schedule settings | Resource group, schedule, timeout settings, and more. | Ensures compliant resource usage and prevents schedule configuration errors. | All task types |
Node lineage | Upstream and downstream dependencies of a task. | Analyzes pipeline impact and prevents risks from changes to critical nodes. | All task types |
Code parsing | Tables, functions, views, and other objects referenced in SQL. | Identifies operations on sensitive tables, function misuse, and ensures permission compliance. | All SQL-based task types |
Metadata and lineage | Table structure, column details, and table-level lineage. | Checks the impact of column changes and ensures data model consistency. | MaxCompute SQL, EMR Spark SQL, EMR Hive, and Hologres SQL |
Data governance metrics | Cost, storage, output health score, and more (T+1 data). | Monitors data costs and quality, and drives continuous governance optimization. | All SQL-based task types |
Procedure
In the left-side navigation pane of the Data Studio page, click the governance icon
to open the Data Asset Governance plugin configuration.In the Custom Rule Library section of the Data Asset Governance plugin panel, click
+to create a rule. For example, create the following custom rule.ImportantYou can click AI Generation to generate specific governance rules by using the Copilot capability.
Rule Name:
Fact table UPDATE must include WHERE clause.Severity Level: The Warning level provides prompts only during the development phase, while the Error level triggers alerts and blocks deployment. For example, select
Warning.Scope: Select the node scope for the rule. For example, select
MaxCompute > MaxCompute SQL.Effective Scope: Supports Personal, Workspace, and Tenant levels.
ImportantThe Tenant level is visible only to tenant administrators. The Workspace level is visible only to workspace administrators. Regular members can only see the Personal level option.
Rule Description:
Check UPDATE statements in MaxCompute SQL. If the target is a fact table (table name ends with _f) and does not include a WHERE clause, flag it as a high-risk issue.Positive Example:
UPDATE my_project.order_detail_f SET status='shipped' WHERE order_id='123';UPDATE my_project.order_detail_dim SET status='shipped';
Error Example:
UPDATE my_project.order_detail_f SET status='expired';
After you click Save, the rule takes effect in In-depth Inspection.
If the rule is no longer needed, hover over the target custom governance rule and click the disable icon
next to it to disable the rule.
 next to it to disable the rule.
Deep scan
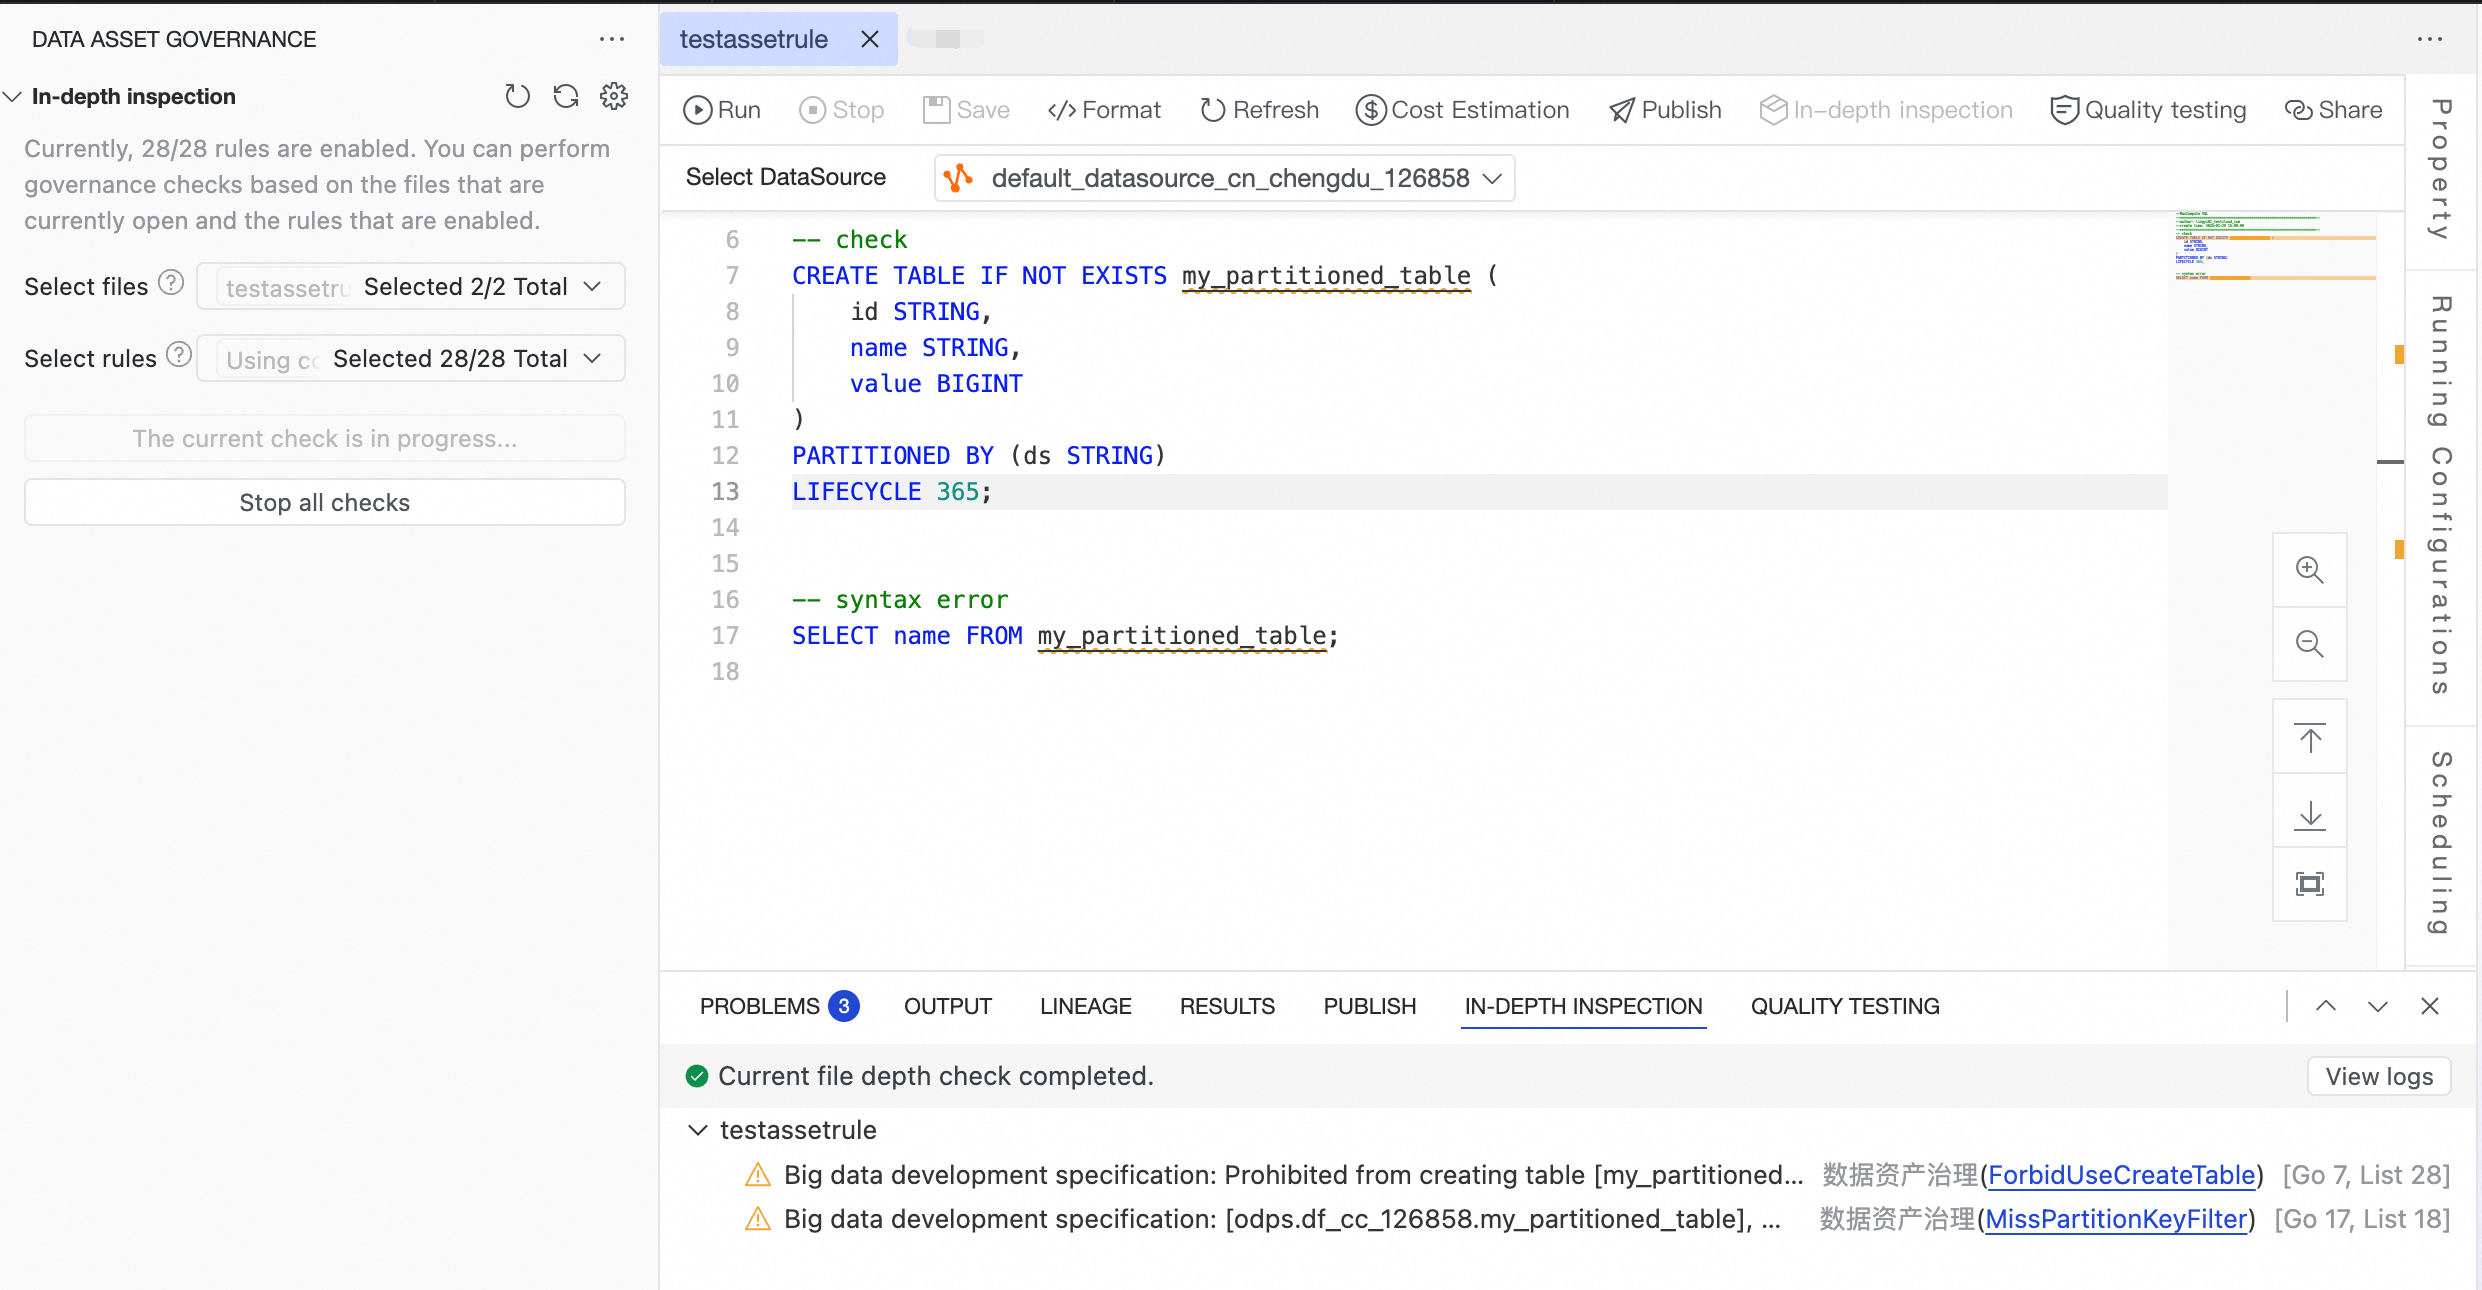
In addition to the single-file scan mentioned in the Quick start section, batch deep scans are also supported.
In the left-side navigation pane of the Data Studio page, click the governance icon
to open the Data Asset Governance plugin configuration.In the In-depth Inspection section of the Data Asset Governance plugin panel, select the files to scan in batch and the rules to apply, and then initiate a deep scan.
ImportantThe batch scan scope is limited to the file tabs currently open in the editor. You can select up to 5 files. Files that are not open cannot be selected.
Only one deep scan can be executed at a time during a batch scan.
In the In-depth Inspection results pane, click View Log in the upper-right corner to view the detailed judgment process of the large language model for the check rules.
Governance rule details
In the upper-right corner of the In-depth Inspection section of the Data Asset Governance plugin panel, click ![]() to view the details of all check rules. The following section describes some of the core built-in rules of the Data Asset Governance plugin.
to view the details of all check rules. The following section describes some of the core built-in rules of the Data Asset Governance plugin.
For the node types applicable to each governance rule, see Supported node types.
Partitioned table queries must include partition filters
Risk description: Querying a MaxCompute partitioned table without specifying a partition triggers a full table scan, which consumes significant compute resources and incurs high costs.
Incorrect code example:
SELECT user_id, order_amount
FROM user_orders
WHERE status = 'paid';
Correct code example:
SELECT user_id, order_amount
FROM user_orders
WHERE status = 'paid'
AND pt = '${bizdate}'; -- Add partition filter condition
Auto-fix logic: Quick fix is supported. The system automatically adds a partition condition to the
WHEREclause, such asAND pt = '${bizdate}'.
INSERT INTO with rerun enabled is not allowed
Risk description: If an SQL task contains only
INSERT INTOlogic and reruns are allowed in the schedule settings, each rerun appends data to the target table, which can easily cause data duplication and compromise data accuracy.Incorrect code example:
-- Set the task property to "Rerunnable"
INSERT INTO target_table SELECT * FROM source_table;
Correct code example:
-- Set the task property to "Rerunnable"
INSERT OVERWRITE TABLE target_table SELECT * FROM source_table;
Auto-fix logic: Quick fix is supported. The system changes
INSERT INTOtoINSERT OVERWRITEto ensure that data is overwritten rather than appended during reruns.
JOIN column types must be consistent
Risk description: In MaxCompute SQL, inconsistent column types in
JOINoperations cause implicit type conversions, which may lead to computation errors, performance degradation, and data quality issues.Incorrect code example:
-- a.user_id is BIGINT, b.uid is STRING
SELECT * FROM table_a a JOIN table_b b ON a.user_id = b.uid;
Correct code example:
-- a.user_id is BIGINT, b.uid is STRING
SELECT * FROM table_a a JOIN table_b b ON a.user_id = CAST(b.uid AS BIGINT);
Auto-fix logic: Quick fix is supported. The system automatically detects and applies an explicit type conversion using the
CASTfunction on one of the columns to match the type of the other column.
INSERT into tables outside the current project
Risk description: Writing data from a task in project A to a table in project B is a high-risk operation. This breaks project isolation and may lead to unauthorized data access and data leakage.
Incorrect code example:
-- Execute in a task within project_A
INSERT INTO project_B.some_table SELECT * FROM my_table;
Correct code example:
-- Recommended approach: Data should be written by a task belonging to the table's owning project (project_B).
-- Avoid this operation in project_A.
Auto-fix logic: Auto-fix is not supported. You must adjust the data synchronization pipeline based on your business requirements to ensure that data is written by the target project's own tasks.
Scheduled tasks must not write to development environment tables
Risk description: When scheduled tasks in the production environment write data to tables in the development environment, the data protection level is reduced, creating data security risks.
Incorrect code example:
-- Execute in a task in the production environment (PROD)
INSERT OVERWRITE TABLE user_dev.temp_data SELECT * FROM user_prod.source_data;
Correct code example:
-- Production tasks should write to tables in the production environment
INSERT OVERWRITE TABLE user_prod.result_data SELECT * FROM user_prod.source_data;
Auto-fix logic: Auto-fix is not supported. You must manually modify the target table to ensure that data flows comply with environment isolation standards.
CREATE TABLE is not allowed in SQL
Risk description: Using
CREATE TABLEdirectly in a scheduled SQL task can cause unclear table ownership (tables are typically owned by the primary account or scheduling account), increase management costs, and create risks of accidental data deletion.Incorrect code example:
CREATE TABLE my_temp_table (id INT);
INSERT INTO my_temp_table VALUES (1);
Correct code example:
-- Tables should be pre-created in the DataWorks table management module, then used directly in SQL tasks.
INSERT INTO my_temp_table VALUES (1);
Auto-fix logic: Auto-fix is not supported. We recommend that you create tables in DataWorks metadata management, or use
CREATE TABLE IF NOT EXISTSto avoid errors in certain scenarios.
Missing scheduling parameter checker
Risk description: The core purpose of periodic scheduling tasks is to process data incrementally by time dimension. If a scheduling parameter (such as
${bizdate}) is missing from theWHEREcondition, the task may process full data every day or process the wrong date range, resulting in data omission, inconsistency, and significant resource waste.Incorrect code example:
-- Error: Missing scheduling parameter, unable to perform daily incremental processing
INSERT OVERWRITE TABLE users_active_today PARTITION (pt = '${bizdate}')
SELECT    user_id  FROM    login_log; -- Missing WHERE pt = '...'
Correct code example:
-- Correct: Use scheduling parameter as a filter condition to achieve daily incremental processing
INSERT OVERWRITE TABLE users_active_today PARTITION (pt = '${bizdate}')
SELECT    user_id FROM    login_log
WHERE    pt = '${bizdate}';
Auto-fix logic: Auto-fix is not fully supported. The plugin highlights the potential missing scheduling parameter filter, but due to the complexity of business logic, we recommend that you manually add the correct filter condition based on your actual requirements.
FAQ
Q: Do these checks affect editor performance or node save speed?
A: Real-time syntax diagnosis (LSP) has a slight impact on editor performance, but it is within an acceptable range. The Data Asset Governance plugin triggers on save and adds a small amount of save time, depending on the code complexity and the number of rules. If you experience noticeable lag, check your network or contact technical support.
Q: Is this feature free? Is DataWorks Copilot required?
A: The issue diagnosis feature is a built-in capability of DataWorks and is free of charge. However, if you use the fix suggestions from DataWorks Copilot, the billing rules specified in the DataWorks Copilot billing apply. You can also choose not to use Copilot and fix the issues manually.
Q: Why are code issues not detected even though I have enabled the feature?
A: Troubleshoot by following these steps.
Check the main switches: Make sure that
DataStudio Governance Check Module EnablementandSyntaxErrorEnableare both enabled under Settings > User > Extensions.Check rule switches: Go to the Rule Library and make sure that the rules you want to apply are enabled.
Verify the node type: Check whether the current node type is within the applicable scope of the target rule.
Network issues: Check whether there are failed network requests in the browser developer tools. The LSP service or governance service may have failed to load due to network issues.
Q: What happens if the LSP or governance plugin service is unavailable?
A: If the backend services are temporarily unavailable, the issue diagnosis feature fails silently. You will not see real-time syntax prompts or governance issues on save, but your normal code editing and saving operations are not affected. We recommend that you refresh the page and trigger the check again.
Appendix: Glossary
Term | English | Description |
Live scan | Live Scan | A quick, lightweight check performed on the currently active node when you save. Currently, due to performance considerations, only built-in high-efficiency rules are applied. |
Deep scan | Deep Scan | A comprehensive, time-consuming check that is manually triggered on all nodes within a specified scope (single node, personal nodes, workspace, or folder). All rules are applied, including custom AI rules. |
Custom AI checker | Custom AI Checker | A check rule defined by users in a specific format (such as natural language plus examples) and powered by a large language model. |
Problems panel | Problems Panel | A native or plugin-provided UI area in VS Code for displaying code issues in a centralized manner. |
Quick fix | Quick Fix | A clickable action provided by the plugin for a detected issue that automatically corrects the code or configuration. |