DataWorks is a unified, end-to-end big data development and governance platform powered by big data engines like MaxCompute, Hologres, E-MapReduce (EMR), AnalyticDB, and CDP. It supports data warehouses, data lakes, and lakehouse architectures. This tutorial shows you how to ingest data, orchestrate business workflows, schedule periodic tasks, and create data visualizations with DataWorks.
Getting started
This tutorial uses an e-commerce scenario to demonstrate how to build an end-to-end Data Pipeline—from raw data ingestion to data analysis and Data Visualization. Following this standardized process lets you quickly build reusable data Workflows that ensure reliable Scheduling and operational Observability. This approach lets business users turn data into insights without deep technical expertise and makes it easier for your organization to adopt big data applications.
In this tutorial, you will:
Data Synchronization: Use the Data Integration module in DataWorks to create a single-table Batch Task that synchronizes business data to a big data computing platform, such as MaxCompute.
Data Cleaning: Use the Data Studio module in DataWorks to process, analyze, and mine business data.
Data Visualization: Use the Data Analysis module in DataWorks to convert analysis results into easy-to-understand charts for business users.
Periodic Scheduling: Configure Periodic Scheduling for the Data Synchronization and Data Cleaning processes.
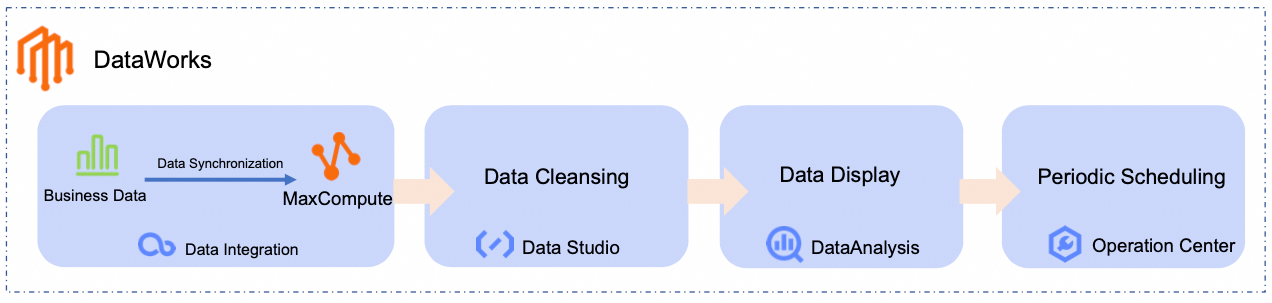
In this tutorial, you will use the following Workflow to generate a daily ranking of the best-selling product categories by syncing and analyzing raw product and order data from a public data source to MaxCompute:

Prerequisites
To complete this tutorial, you need an Alibaba Cloud account or a RAM user with the AliyunDataWorksFullAccess permission. For more information, see Prepare an Alibaba Cloud account or Prepare a RAM user.
DataWorks provides a comprehensive permission system that supports access control at the product and module levels. If you need more fine-grained access control, see Overview of the DataWorks permission management system.
Prerequisites
Activate DataWorks
This tutorial uses the China (Shanghai) region to demonstrate how to get started with DataWorks. You must sign in to the DataWorks console, switch to the China (Shanghai) region, and check whether DataWorks is activated.
Select a region based on the location of your business data:
If your business data is on other Alibaba Cloud services, select the same region as those services.
If your business is on-premises and requires access over the public network, select the region closest to you to reduce latency.
New users
If you are new to DataWorks, the following page appears, indicating that DataWorks is not yet activated in the current region. Click Purchase Product Portfolio for Free.

Configure the parameters on the purchase page.
Parameter
Description
Example
Region
Select the region where you want to activate DataWorks.
China (Shanghai)
DataWorks edition
Select the DataWorks edition you want to purchase.
NoteThis tutorial uses the Basic Edition as an example. All editions support the features covered in this tutorial. For more information, see DataWorks editions and features to choose the edition that best suits your business needs.
Basic Edition
Click Confirm Order and Pay to complete the payment.
Activated but expired
If you previously activated DataWorks in the China (Shanghai) region but the service has expired, the following prompt appears. Click Purchase Edition.

Configure the parameters on the purchase page.
Parameter
Description
Example
Edition
Select the DataWorks edition you want to purchase.
NoteThis tutorial uses the Basic Edition as an example. All editions support the features covered in this tutorial. For more information, see DataWorks editions and features to choose the edition that best suits your business needs.
Basic Edition
Region
Select the region where you want to activate DataWorks.
China (Shanghai)
Click Buy Now to complete the payment.
If you cannot find the DataWorks edition you purchased, try the following:
Wait a few minutes and refresh the page, as there may be a system delay.
Ensure the current region matches the one where you purchased the DataWorks edition. If the regions do not match, the edition will not be displayed.
Already activated
If you have already activated DataWorks in the China (Shanghai) region, the DataWorks overview page appears. You can proceed to the next step.
Create workspace
Set up resource group
Enable public network access
This tutorial uses public e-commerce test data that is accessed over the public network. By default, the resource group created in the previous step does not have public network access. You must configure an Internet NAT Gateway and add an Elastic IP Address (EIP) for the Virtual Private Cloud (VPC) associated with the resource group to enable public network access and retrieve the data.
Sign in to the VPC - Internet NAT Gateway console. In the top navigation bar, switch to the China (Shanghai) region, and click Create Internet NAT Gateway. Configure the following parameters.
NoteYou can keep the default values for parameters not listed in the table.
Parameter
Value
Region
China (Shanghai).
Network and zone
Select the VPC and vSwitch associated with the resource group.
You can find the VPC and vSwitch on the DataWorks Resource Group List page. Switch to the China (Shanghai) region, find the resource group, and click Network Settings in the Actions column. You can find the VPC Binding and vSwitch in the Data Scheduling & Data Integration section. For more information about VPC, see What is a Virtual Private Cloud?.
Network type
Internet NAT Gateway.
Elastic IP address (EIP)
Select to purchase a new EIP.
Create service-linked role
If you are creating an Internet NAT Gateway for the first time, create a service-linked role by clicking Create service-linked role.
Click Buy Now to complete the payment and create the Internet NAT Gateway instance.
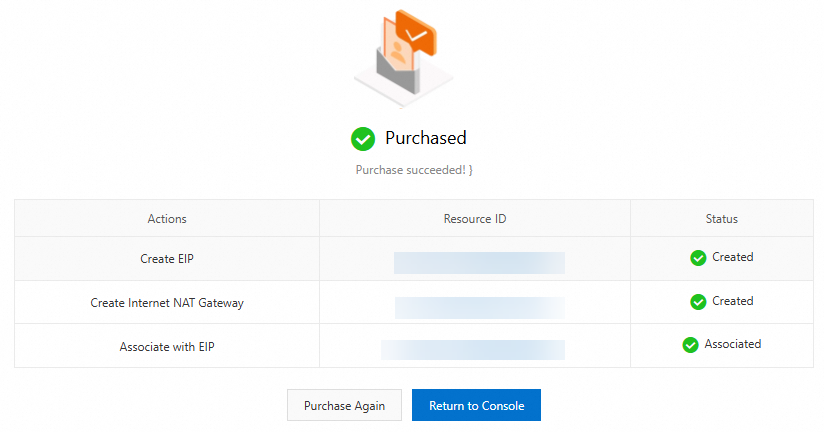
After creating the Internet NAT Gateway instance, return to the console and create an SNAT entry for it.
NoteThe resource group can access the public network through this VPC only after you configure an SNAT entry.
In the Actions column for the new instance, click Manage, and then click the Configure SNAT tab.
On the SNAT Entry List, click Create SNAT Entry and configure the following key parameters:
Parameter
Value
SNAT entry
Select Specify VPC to ensure that all resource groups within the VPC of the Internet NAT Gateway can access the public network using the configured EIP.
Select EIP
Select the EIP bound to the current Internet NAT Gateway instance.
After you configure the parameters for the SNAT entry, click OK to create it.
On the SNAT Entry List, when the Status of the new SNAT entry changes to Available, the VPC associated with the resource group has public network access.
Set up MaxCompute resource
Procedure
This tutorial demonstrates the core features of DataWorks through a practical example.
Imagine an e-commerce platform that stores its product and order information in a MySQL database. The goal is to periodically analyze this data and visualize a daily ranking of the best-selling product categories.
Step 1: Synchronize data
Create a data source
In this step, create a MySQL Data Source to connect to the tutorial's source database.
You do not need to prepare your own business data. DataWorks provides a sample dataset in a public MySQL database for this tutorial. Create a MySQL Data Source to connect to it.
Go to the DataWorks Management Center page. Switch the region to China East 2 (Shanghai), select your Workspace from the drop-down list, and click Go to Management Center.
In the left navigation pane, click Data Sources to go to the Data Source List page. Click Add Data Source, select the MySQL type, and configure the Data Source parameters.
NoteYou can keep the default values for parameters not mentioned in the table.
When you add a data source for the first time, you need to complete cross-service authorization. Follow the on-screen prompts to grant the AliyunDIDefaultRole service-linked role.
Parameter
Description
Data Source Name
For this tutorial, enter MySQL_Source.
Configuration Mode
Select Connection String Mode.
Endpoint
Host Address IP:
rm-bp1z69dodhh85z9qa.mysql.rds.aliyuncs.comPort:
3306
ImportantThe data in this tutorial is for hands-on practice with DataWorks. It is for testing purposes and is read-only within the Data Integration module.
Database Name
Enter
retail_e_commerce.Username
Enter
workshop.Password
Enter
workshop#2017.In the Connection Configuration section, switch to the Data Integration tab. Locate the resource group bound to your workspace and click Test Network Connectivity in the Connectivity Status column.
NoteIf the connectivity test for the MySQL data source fails, perform the following actions:
Complete the follow-up steps in the connectivity diagnostics tool.
Check if an Elastic IP address (EIP) is configured for the VPC bound to the resource group. The MySQL data source requires the resource group to have public network access. For more information, see Enable public network access for a resource group.
Click Complete Creation.
Build a synchronization pipeline
In this step, build a synchronization pipeline to sync e-commerce product and order data to MaxCompute tables for further processing.
Click the
 icon in the upper-left corner and select to go to the DataStudio page.
At the top of the page, switch to your Workspace. In the left navigation pane, click
 to go to the DataStudio page.
In the Workspace Directories section, click
 , select Create Workflow, and name it
 dw_quickstart.On the workflow canvas, drag a Zero Load node and two Batch Synchronization nodes from the left panel onto the canvas. Configure the Batch Synchronization nodes as follows:
Data Source Type:
MySQLData Destination Type:
MaxComputeSpecific Type: Batch Synchronization Node
The following table lists the node names and their functions for this tutorial:
Node type
Node name
Function
 Zero Load
workshopServes as the Workflow's entry point to define a clear data flow. This is a Dry-run task that requires no code.
 Batch Synchronization Node
ods_item_infoSynchronizes the product information source table
item_infofrom MySQL to theods_item_infotable in MaxCompute.Batch Synchronization Nodeods_trade_orderSynchronizes the order information source table
trade_orderfrom MySQL to theods_trade_ordertable in MaxCompute.Connect the nodes by dragging and dropping, making the
workshopnode the upstream node for both Batch Synchronization nodes. The final result should look like this:
Configure workflow scheduling.
On the right side of the workflow canvas, click Scheduling and configure the parameters. The following table describes the key parameters for this tutorial. Use the default values for all other parameters.
Scheduling parameter
Description
Scheduling Parameters
Set scheduling parameters for the entire workflow. These can be used directly by the nodes within the workflow.
For this tutorial, set it to
bizdate=$[yyyymmdd-1]to get the previous day's date.NoteDataWorks provides scheduling parameters that allow for dynamic values in your code. You can define variables in your SQL code by using the
${variable_name}format and assign values to them in Scheduling > Scheduling Parameters. For supported parameter formats, see Supported formats for scheduling parameters.Scheduling Cycle
For this tutorial, set it to
Daily.Scheduling Time
For this tutorial, set the Scheduling Time to
00:30. The workflow will start at00:30every day.Scheduling Dependencies
This workflow has no upstream dependencies, so you can leave this unconfigured. For unified management, you can click Use Workspace Root Node to attach the workflow to the workspace root node.
The workspace root node is named in the format
WorkspaceName_root.
Configure synchronization tasks
Initial node
Product information sync (ods_item_info)
Order data sync (ods_trade_order)
Step 2: Clean and process data
After synchronizing the data to MaxCompute, use the DataStudio module to clean, process, and analyze the ods_item_info and ods_trade_order tables to generate a daily ranking of best-selling product categories.
Build a data processing pipeline
In the left navigation pane of DataStudio, click
 to go to the DataStudio page. In the Workspace Directories section, find and click the workflow you created. On the workflow canvas, drag MaxCompute SQL nodes from the left panel and name them accordingly.
The following table shows the example node names and their functions for this tutorial:
Node type
Node name
Function
 MaxCompute SQL
dim_item_infoProcesses product data from the
ods_item_infotable to create thedim_item_infoDimension Table.MaxCompute SQLdwd_trade_orderCleans and transforms transaction data from the
ods_trade_ordertable to create thedwd_trade_orderFact Table.MaxCompute SQLdws_daily_category_salesAggregates the cleaned and standardized detail data from the
dwd_trade_orderanddim_item_infotables to produce the daily product category sales summary table,dws_daily_category_sales.MaxCompute SQLads_top_selling_categoriesGenerates the daily top-selling product categories ranking table,
ads_top_selling_categories, based on thedws_daily_category_salestable.Drag and drop to connect the nodes and configure their upstream dependencies. The final result should look like this:
 Note
NoteYou can set dependencies by either manually connecting nodes or enabling automatic parsing of the code within each node. This tutorial uses the manual connection method. For more information on automatic parsing, see Automatic dependency parsing.
Configure data processing nodes
dim_item_info node
dwd_trade_order node
dws_daily_category_sales node
ads_top_selling_categories node
Step 3: Run and debug workflow
After configuring the Workflow, run it to verify its configuration before deploying it to the Production Environment.
In the left navigation pane of DataStudio, click
to go to the DataStudio page, then find the workflow you created in the Workspace Directories section.Click Run in the node toolbar. In the Enter running parameters dialog box, enter the previous day's date (for example,
20250416).NoteThe workflow nodes use scheduling parameters for dynamic code. When debugging, you must assign a constant value to these parameters for testing.
Click OK to go to the debugging run page.
Wait for the run to complete. The expected result is as follows:

Step 4: Query and visualize data
Now that the raw data is processed and aggregated into the ads_top_selling_categories table, you can query it to view the results.
Click the
 icon in the upper-left corner and click .
Next to My Files, click
 > Create File. Enter a custom File Name and click OK.
In the SQL Query editor, enter the following SQL statement.
SELECT * FROM ads_top_selling_categories WHERE pt=${bizdate};In the upper-right corner, select the MaxCompute data source and click OK.
Click the Run button at the top. On the Cost Estimation page, click Run.
In the query results, click
 to view the chart. You can click the
  icon in the upper-right corner of the chart to customize its style.
 You can also click Save in the upper-right corner of the chart to save it as a card. You can then view it by clicking Card (
 ) in the left navigation pane.
Step 5: Configure periodic scheduling
To get daily updates, deploy the Workflow to the Production Environment for periodic execution.
Scheduling parameters have already been configured for the workflow and its nodes during the data synchronization and processing steps. You only need to deploy the workflow to the production environment. For more information about scheduling configurations, see Configure node scheduling.
Click the
icon in the upper-left corner and click .In the left navigation pane of DataStudio, click
to go to the DataStudio page. Switch to the Workspace used for this tutorial, and then find the workflow you created in the Workspace Directories section.Click Deploy in the node toolbar. In the deployment panel, click Start Deployment to Production. Wait for the Build Package and Prod Online Check steps to complete, then click Deploy.
After the Prod Online status changes to Complete, click Perform O&M to go to the Operation Center.

In , you can see the periodic task for the Workflow (named
dw_quickstartin this tutorial).To view the periodic tasks for the child nodes within the Workflow, right-click the workflow's periodic task and select View Internal Tasks.

The expected result is as follows:

Next steps
For details about the operations and parameters of the modules covered in this tutorial, see Data Integration, Data Studio (New), Data Analysis, and Node scheduling configuration.
Besides the modules covered in this tutorial, DataWorks also supports other modules such as Data Modeling, Data Quality, Data Security Guard, and DataService Studio to provide end-to-end data monitoring and O&M.
For more hands-on tutorials and use cases, see More use cases and tutorials.
Resource cleanup
To clean up the resources you created in this tutorial, follow these steps:
Undeploy the Auto Triggered Nodes.
Log on to the DataWorks console. In the top navigation bar, select the desired region. In the left-side navigation pane, choose . On the page that appears, select the desired workspace from the drop-down list and click Go to Operation Center.
Go to . Select the checkboxes for all the Auto Triggered Nodes you created. Do not undeploy the root node of the Workspace. Then, at the bottom of the page, click .
Delete the data development nodes and disassociate the MaxCompute Computing Resource.
Go to the Workspaces page in the DataWorks console. In the top navigation bar, select a desired region. Find the desired workspace and choose in the Actions column.
In the left navigation pane of Data Studio, click the
icon to open the Data Development page. In the Workspace Directories section, find and right-click the Workflow you created, and then click Delete.In the left navigation pane, click
 > Computing Resources. Find the associated MaxCompute Computing Resource and click Disassociate. In the confirmation dialog box, select the checkbox and follow the on-screen instructions.
Delete the MySQL Data Source.
Log on to the DataWorks console. In the top navigation bar, select the desired region. In the left-side navigation pane, choose . On the page that appears, select the desired workspace from the drop-down list and click Go to Management Center.
In the left navigation pane, click Data Sources. On the Data Sources page, find the MySQL Data Source you created, click Delete in the Actions column, and follow the on-screen instructions.
Delete the MaxCompute project.
Go to the MaxCompute Project Management page. Find the MaxCompute project you created, click Delete in the Actions column, and follow the on-screen instructions.
Delete the Internet NAT Gateway and release the Elastic IP Address (EIP).
Go to the VPC - Internet NAT Gateway Console. In the top menu bar, switch the Region to China (Shanghai).
Find the Internet NAT Gateway you created and click
 > Delete in the Actions column. In the confirmation dialog box, select the Force Delete checkbox, and then click OK.
In the left navigation pane, click . Find the EIP you created and, in the Actions column, choose
> Instance Management > Release. In the confirmation dialog box, click OK.