The color mapper is used to configure the mapping between various colors and data values in a widget. It has more than ten built-in color templates and supports custom colors and color values to meet different customization requirements. This topic describes how to use a color mapper to map and match data to colors. In this example, the Vector Scatter Layer component of the Basic Flat Map 3.0 component is used.
Configure color mapping
When you configure the color of the scatter dots in the map subwidget, you can use the following two color configuration methods to adjust the color of the scatter dots.
Method 1: Click the
 icon to the left of the Scatter Color configuration items. When you click Enable Visual Mapping in the Hover state, use the color picker description. You do not need to be driven by data. You can simply customize the style and adjust the color of a single color. The color can be monochrome or gradient.
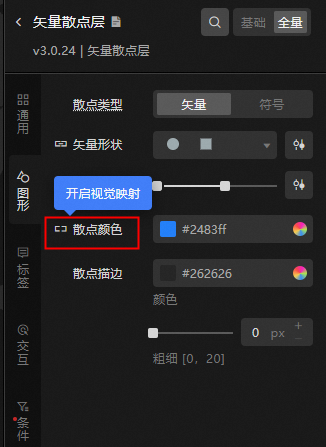
Method 2: Click the
 icon on the left of the Scatter Color configuration items. When you click Disable Visual Mapping in the Hover state, use the color mapper. The mapping is driven by the scatter data. You can select multiple scatter colors.
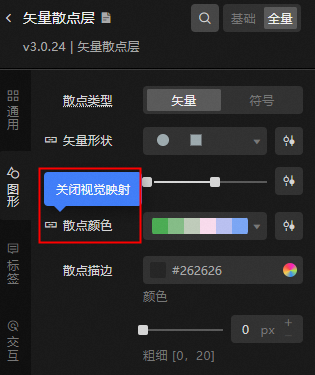
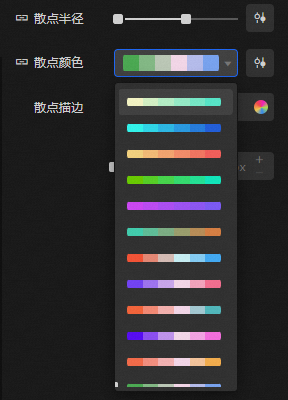
Color Mapper Function Description
Description | Remarks |
Toggle configuration color mapping when panel collapses | When the color mapper is collapsed, click the color display bar to open the multi-color color template. The top row displays the current mapped color results, with multiple color templates available for you to choose from below. Click the color bar in the template to quickly switch the configuration mapping color. |
Panel expansion configuration mapping details | When the color mapper is in the expanded state, the system automatically reads data and maps the colors to the data. You can configure the mapping details as follows:
|
 icon to the right of a color in the template to pin the color value of the selected color. A single color that is not pinned changes as the template is switched.
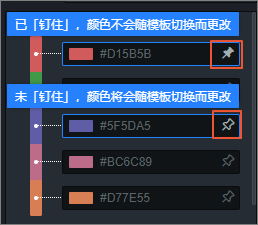
 icon to sort the color mapping list in descending order.
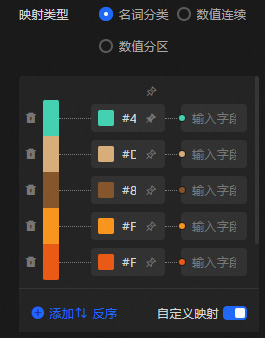
 icon to the left of a row map to delete the entire row map color entries.
  icon below the color mapping list to add a row of color mapping entries.
 The color mapper provides more than 10 built-in color templates. You can customize colors and color values to meet your custom requirements.
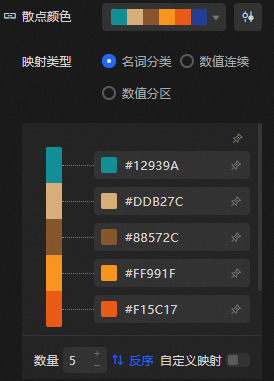
Color mapping classification
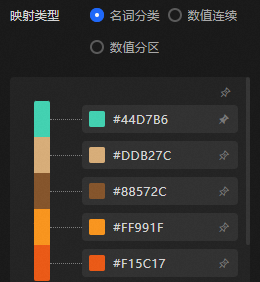
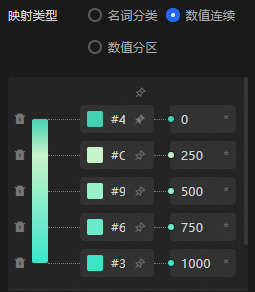
Color mapping types are classified into three types: Noun classification, numeric continuous, and numeric partition.
Type | Migration description |
Noun classification | It is suitable for data that needs to be equally classified into names and categories to provide color differentiation. The colors on the swatches are more distinguishable from each other. Noun Classification Color Template Style |
Continuous values | This method is applicable to the case where a continuous gradient of colors is assigned to numeric data, and the values and colors are in one-to-one correspondence in the mapping space. numeric continuous color template style |
Numeric partition | This method is applicable to the case where consecutive values are partitioned based on continuous value mapping, data within the same value range is classified into one category, and the data within this range is filled with the same color. Using numeric partition mapping, you can reduce the number of colors and avoid visual clutter. numeric partition color template style |
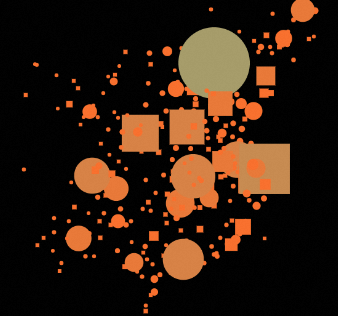
 Noun Classification Data Example Figure
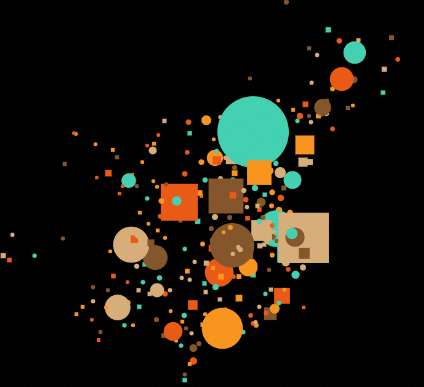
 numeric continuous data example
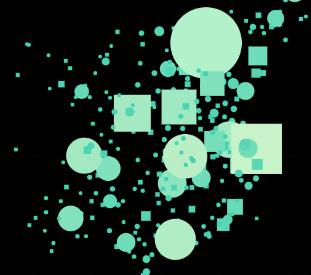
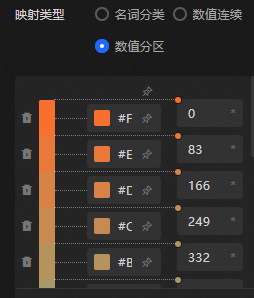 numeric partition data sample graph