Four examples show how to use global variables for date-based queries, data distribution, dynamic summation, and data screening.
Prerequisites
You have entered the canvas editor.
Example 1: Query by date
-
Add widgets.
-
At the top of the canvas editor, click Search, and then enter General Title and Time Picker.
-
Click the widgets to add them to the canvas.
-
-
Set a static global variable.
-
In the navigation pane on the left of the canvas editor, select the Global Variable tab.
-
Click New Variable. Rename the variable to
date, enterDate valuefor the description, and set the initial value to2023-07-19.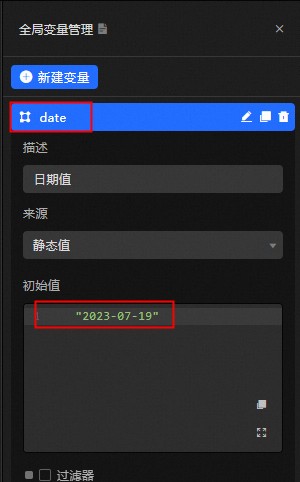
-
-
Set the data source for the General Title widget.
-
Select the General Title widget and then select the Data Source tab.
-
Set Data Source Type to Database, select an existing data source, and enter the following SQL statement.
 Note
NoteYou must use a colon (:) to reference the global variable. For more information, see Global variable autocomplete.
-
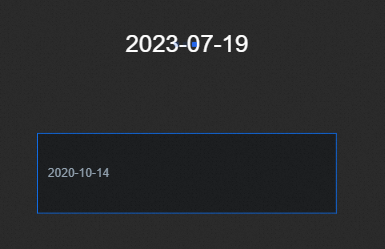
The General Title widget displays the initial value of the global variable.

-
-
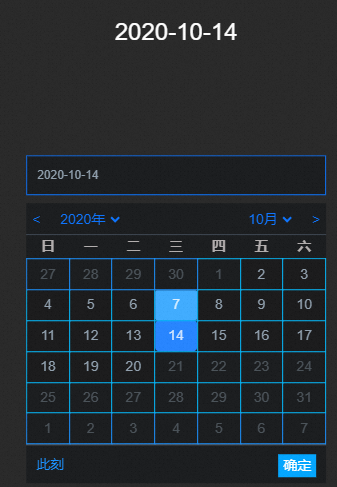
Configure the Time Picker interaction.
-
Select the Time Picker widget and then select the Advanced tab.
-
Turn on the Interaction Occurrence switch. For the time field, select the
datevariable. Note
NoteWhen you select a time, the value of the `date` variable is updated.
-
-
Preview the result.
In the upper-right corner of the canvas editor, click Preview to verify the settings.
 Note
NoteOn the preview page, the General Title widget first displays the default value of the global variable, then updates to show the default value of the Time Picker. When you change the time, the widget reflects the selected value.
-
Set a dynamic global variable.
-
Return to the canvas editor. Change the source of the date global variable to Data Source Request.
-
Select a data source. In the SQL window, enter the query to retrieve the current time.
select cast(curDate() as char) as date-
Add a filter to extract the date value and pass it to the General Title widget.
return data[0].date; -
View the input and output values of the filter.
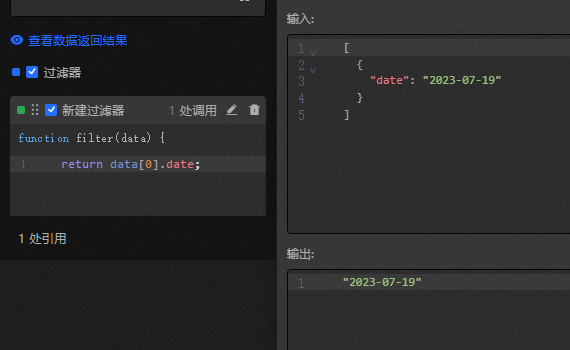
-
The General Title widget now displays the dynamically retrieved time value.

-
-
Preview the result.
In the upper-right corner of the canvas editor, click Preview to verify the settings.
 Note
NoteOn the preview page, the General Title widget first shows the dynamically retrieved time value. When you change the time, the widget updates to display the selected value.
Example 2: Implement data distribution
-
Add widgets.
-
At the top of the canvas editor, click Search, and then enter General Title and Ticker Board.
-
Click the widgets to add them to the canvas.
-
-
Set a static global variable.
-
In the navigation pane on the left of the canvas editor, select the Global Variable tab.
-
Click New Variable. Rename it to
xand set the initial value.[ { "text": "I am text", "number": 123 } ]
-
-
Set up the blueprint interaction.
-
In the upper-left corner, click the
 icon to open the blueprint editor.
 -
Drag the layer node and the global variable node to the main blueprint canvas.
-
Click Logic Node and add two serial data processing nodes.
-
Connect the nodes.

-
Set the processing method for the serial data processing nodes.
-
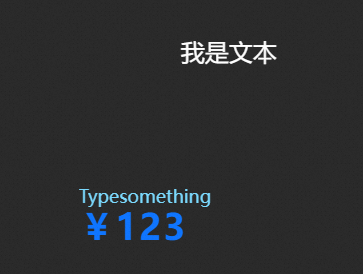
Ticker Board
return [{ value: data[0].number }] -
General Title
return [{
  value: data[0].text
}]
-
-
-
Preview the result.
In the upper-right corner of the canvas editor, click Preview to verify the settings.
Example 3: Implement dynamic data summation
-
Add widgets.
-
At the top of the canvas editor, click Search, and then enter Ticker Board.
-
Click the widget to add it to the canvas.
-
-
Set static global variables.
-
In the navigation pane on the left of the canvas editor, select the Global Variable tab.
-
Click New Variable. Create two global variables. Rename them to
yandz, and set their initial values to123and234respectively.
-
-
Set up the blueprint interaction.
-
In the upper-left corner, click the
icon to open the blueprint editor. -
Drag the layer node and the global variable node to the main blueprint canvas.
-
Click Logic Node and add two serial data processing nodes.
-
Connect the nodes.

-
Set the processing method for the serial data processing nodes.
-
Node 1
return [{ value: data + getCallbackValue( "z") }] -
Node 2
return [{
  value: data + getLocalValue(
    "y")
}]
-
-
-
Preview the result.
In the upper-right corner of the canvas editor, click Preview to verify the settings.

-
Set a dynamic global variable.
Change the source of the global variable y to Data Source Request and select a dynamic data source, such as an API or database.
-
Set up the blueprint interaction.
-
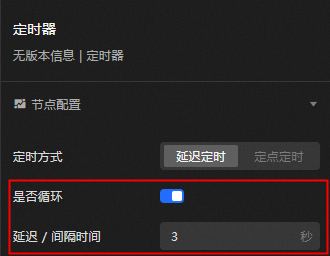
Click Logic Node and add a Timer.
-
Turn on the Loop switch and set the delay for the timer node to 3 seconds.
-
Connect the nodes.

-
-
Preview the result.
In the upper-right corner of the canvas editor, click Preview to verify the result. The ticker board updates every three seconds, reflecting the dynamic data summation.
Example 4: Implement data screening
-
Add widgets.
-
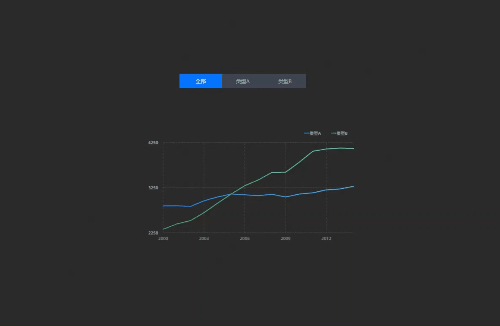
At the top of the canvas editor, click Search, and then enter Tab List and Line Chart.
-
Click the widgets to add them to the canvas.
-
Select the Tab List widget and then select the Data Source tab.
-
Modify the static data.
[
  {
    "id": 1,
    "content": "All"
  },
  {
    "id": 2,
    "content": "Type A"
  },
  {
    "id": 3,
    "content": "Type B"
  }
]
-
-
Set a static global variable.
-
Select the Line Chart widget, select the Data Source tab, and copy the full static data.
-
In the navigation pane on the left of the canvas editor, select the Global Variable tab.
-
Click New Variable. Create a global variable, rename it to
data, and set its initial value to the full line chart data that you copied.
-
-
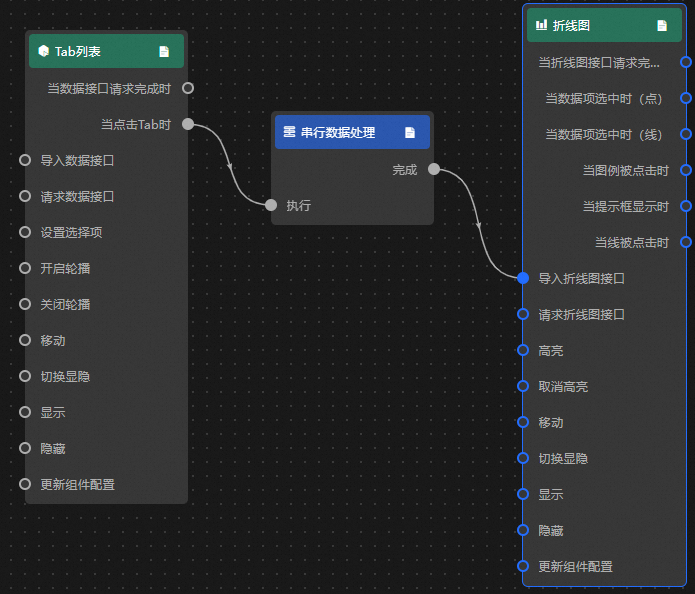
Set up the blueprint interaction.
-
In the upper-left corner, click the
icon to open the blueprint editor. -
Drag the layer node to the main blueprint canvas.
-
Click Logic Node and add one serial data processing node.
-
Connect the nodes.
-
Set the processing method for the serial data processing node.
let result = getCallbackValue("data") // Get the global variable data.
return result.filter(i => {
  if (data.content == "All") {
    return result; // If the content of the tab list is "All", return all data.
  } else {
    return i.colorField == data.content; // If the content of the tab list is "Type A" or "Type B", return only the corresponding data.
  }
});
-
-
Preview the result.
In the upper-right corner of the canvas editor, click Preview to verify the settings.