A periodic task is a task that the scheduling system runs automatically on a configured schedule. This topic describes the features, scheduling modes, and usage notes for periodic tasks, including Integration and Computing Tasks, and Modeling Tasks (dimension logic tables, fact logic tables, and aggregate logic tables).
Usage
The O&M center for the production environment automatically runs periodic instances. In contrast, the O&M center for the development environment generates periodic instances but does not run them automatically.
Access the Scheduled Tasks page
-
In the top menu bar of the Dataphin homepage, choose Develop > Task O&M.
-
In the left-side navigation pane, choose Task O&M > Scheduled Tasks.
-
In the top menu bar, select the production or development environment.
Scheduled Tasks page
The Scheduled Tasks page displays lists for Integration and Computing Tasks and Modeling Tasks on separate tabs, where you can perform O&M operations.
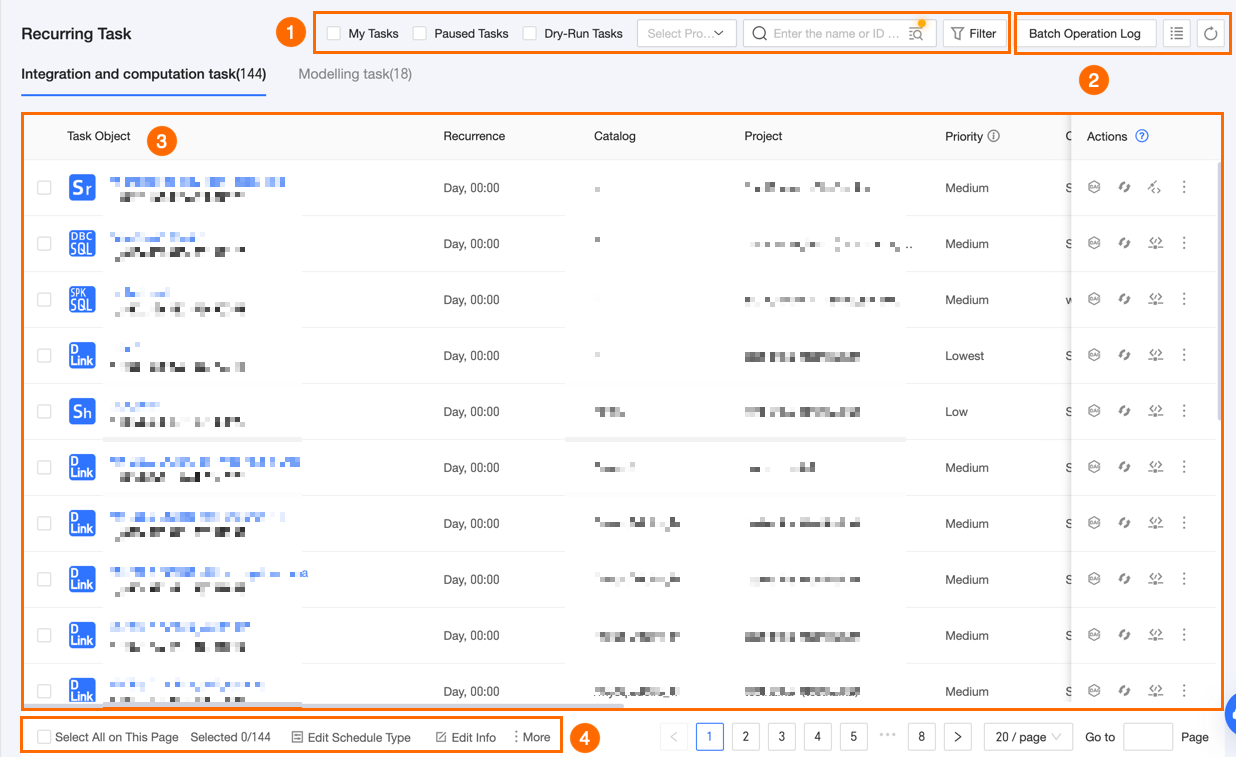
|
Section |
Description |
|
① Filter and search area |
|
|
② List operations |
|
|
③ Periodic task list area |
The periodic task page lists all tasks in projects where the current user has O&M-Access Directory permissions. The list is divided into Integration and Computing Tasks and Modeling Tasks. The Actions column shows the available O&M operations for each task. You can resize the columns as needed. The browser saves your column width settings. Clearing your browser's history and cookies will reset them. The supported O&M operations for each task type are as follows:
Note
The periodic task list shows only the tasks of the current tenant. |
|
④ Batch operation area |
Use the batch operation features in this section to manage multiple periodic tasks at once.
|
 icon in the search box to open the Batch Search dialog box. In the Batch Search dialog box, you can manually enter multiple task IDs or upload a file to search. A batch search can be combined with other filter conditions.
 icon to select the columns to display and reorder them.
 icon to refresh the current list.
Scheduling modes
|
Icon |
Scheduling status |
Description |
|
None |
Normal scheduling |
Runs normally based on the configured scheduling cycle and start time. |
|
|
Dry-run scheduling |
The task is triggered at its scheduled time but only performs a dry run. It immediately returns a success status without executing. |
|
|
Suspended scheduling |
Instances of a suspended task are generated in a paused state. You can use the Resume action to run an instance. Suspending is useful for temporarily disabling a task and its downstream dependencies without taking them offline, for example, to temporarily adjust calculation logic to avoid affecting downstream data. Details are as follows:
|


Periodic task DAG
When you click a task name in the periodic task list, a DAG centered on the current node appears on the right side of the page. The DAG visually displays the node's upstream and downstream dependencies. By default, it displays the main node (the selected node) and the first level of its upstream and downstream nodes. If a periodic task has no upstream or downstream nodes, the DAG shows only the main node. You can also perform O&M on upstream and downstream nodes directly from the DAG.
You can also adjust the DAG view:
-
Click the
 icon to hide the real-time instance list and enlarge the DAG.
 -
Click the
 icon to hide the DAG.
 -
Hover over and drag the
 icon to expand or shrink the DAG view area.
The following example shows a periodic script task:

|
Section |
Description |
|
① Node information |
Displays a summary of the currently selected node. You can click View Node Details to see more information.
Integration and computing task nodes: Include Task Overview, Operation Log, and Node Code. Modeling task nodes: Include Task Overview, Operation Log, and Materialized Code. Real-time tasks: Include Node Details, Operation Log, Node Code, and Task Parameters. Cross-tenant nodes (nodes not belonging to the current tenant): Show only the Task Overview. |
|
② Node filter area |
You can quickly set the number of upstream and downstream levels to expand from the main node. If too many nodes are expanded and the view becomes hard to read, you can search for a node ID or name to quickly locate a node within the current DAG view. |
|
③ Scheduling dependency graph |
Displays the scheduling dependency graph for the instance. You can expand more upstream and downstream nodes and perform O&M operations on them. Hover over a node in the DAG to view its name, type, scheduling type, O&M engineer, and description. If a node has dependencies in another tenant, the external node is marked with a cross-tenant tag, and you can only expand its parent and child nodes.
|
|
④ Canvas adjustment area |
You can quickly adjust the display scale of the DAG. Options include setting a specific scale (default is 100%), zooming in (up to 200%), zooming out (down to 20%), fitting to the canvas, and full-screen display. This area also shows the node ID and name of the main node in the current DAG. |
 icon to compare versions. Click the
  icon to view version information, including its creation time and the modifying user.