A scheduled instance is generated each time a recurring task runs according to its scheduling configuration. You can manage these instances by viewing run status, rerunning them, and inspecting node code.
Scheduled instance generation and run rules
At 23:00 every day, Dataphin generates the scheduled instances for the following day. By default, these instances are in the Not running state.
After all of an instance's upstream dependencies succeed, its status changes from Not running to Waiting for schedule time.
When the scheduled time is reached, Dataphin has sufficient scheduling resources, and the instance passes all throttling rules, its status changes from Waiting for schedule time to Running.
NotePausing an instance stops only the current run and does not affect other instances generated by the same task. To pause multiple scheduled instances, change the task's scheduling property to Pause Scheduling. Manage integration and compute tasks.
Access the Scheduled Instances page
In the top navigation bar of the Dataphin console, choose Development > Task O&M.
In the top navigation bar, select the production environment or development environment.
In the navigation pane on the left, choose Instance O&M > Scheduled Instances.
Scheduled instances page
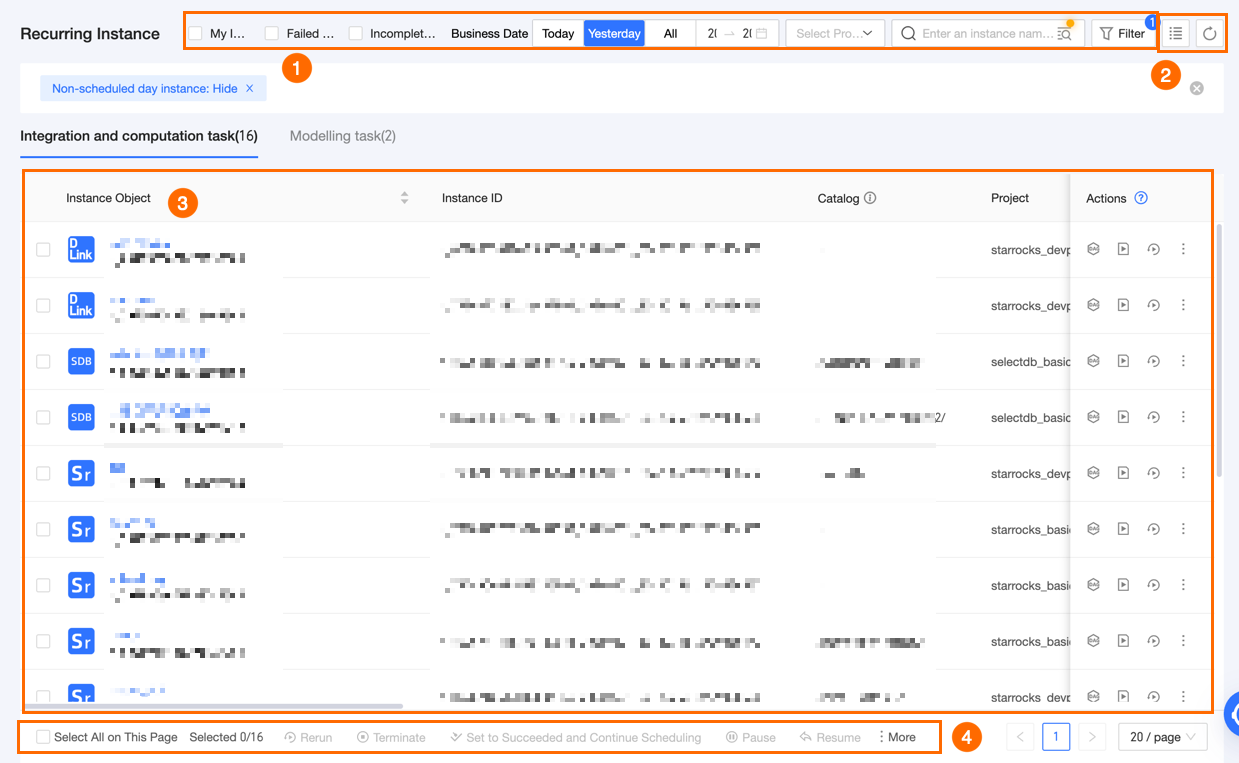
The Scheduled Instances page lists Integration and Compute Tasks and Modeling Tasks, where you manage submitted scheduled instances.
Section | Description |
① Search and filter area |
|
② List actions |
|
③ Scheduled instance list | The Scheduled Instances page lists all recurring tasks in projects where you have O&M - Access Directory permissions, divided into Integration and Compute Tasks and Modeling Tasks. The Actions column provides management options. You can adjust column widths; these settings are saved in your browser and cleared if you clear your cache. Note Only instances for the current tenant are displayed. |
④ Batch actions | You can use batch actions to manage multiple scheduled instances at once. Available actions: Rerun, Terminate, Mark as Succeeded and Continue, Pause, Resume, Modify scheduling resource group, and Modify priority. |
⑤ Time zone conversion | If the tenant's scheduling time zone differs from the system time zone (shown in user center), switch between Scheduling time zone and System time zone to view the Scheduled time, Start time, and End time accordingly. Note The Start Time, End Time, and Scheduled Time filters only support filtering by the System Time Zone. |
Scheduled instance markers
Marker | Tooltip | Description |
| Delayed | For an event fact logical table with data delay detection enabled, this marker appears if Dataphin detects a data delay after the scheduled instance has succeeded. |
| dry run | This instance's corresponding task is configured for a dry run. |
| Paused | The scheduling property of this scheduled instance's task is set to paused. |
Scheduled instance run status
Icon | Status | Description |
| Not running | The instance has not started running. |
| Waiting for scheduling resources | All upstream dependencies have succeeded, and the instance is waiting for scheduling resources. |
| Throttling | The instance is being throttled. |
| Waiting for schedule time | All upstream dependencies have succeeded, and the instance is waiting for its scheduled run time. |
| Running | The instance is currently running. |
| Failed | The instance run failed. If you terminate an instance that is waiting or running, its status changes to Failed. |
| Succeeded | The instance run succeeded. The system immediately marks instances configured for a dry run as succeeded. |
Scheduled instance DAG
Click an instance name to display a DAG on the right, centered on the current node. The DAG visualizes the node's upstream and downstream dependencies. By default, it shows the main node and its immediate upstream and downstream nodes. If an instance has no dependencies, only the main node is shown.
Adjust the DAG view:
Click the
 icon to hide the instance list and enlarge the DAG.
Click the
 icon to hide the DAG.
Hover over and drag the
 icon to expand or shrink the DAG view.
The DAG for modeling task instances shares the same interface as integration and compute task instances. The following example uses an integration and compute task instance:
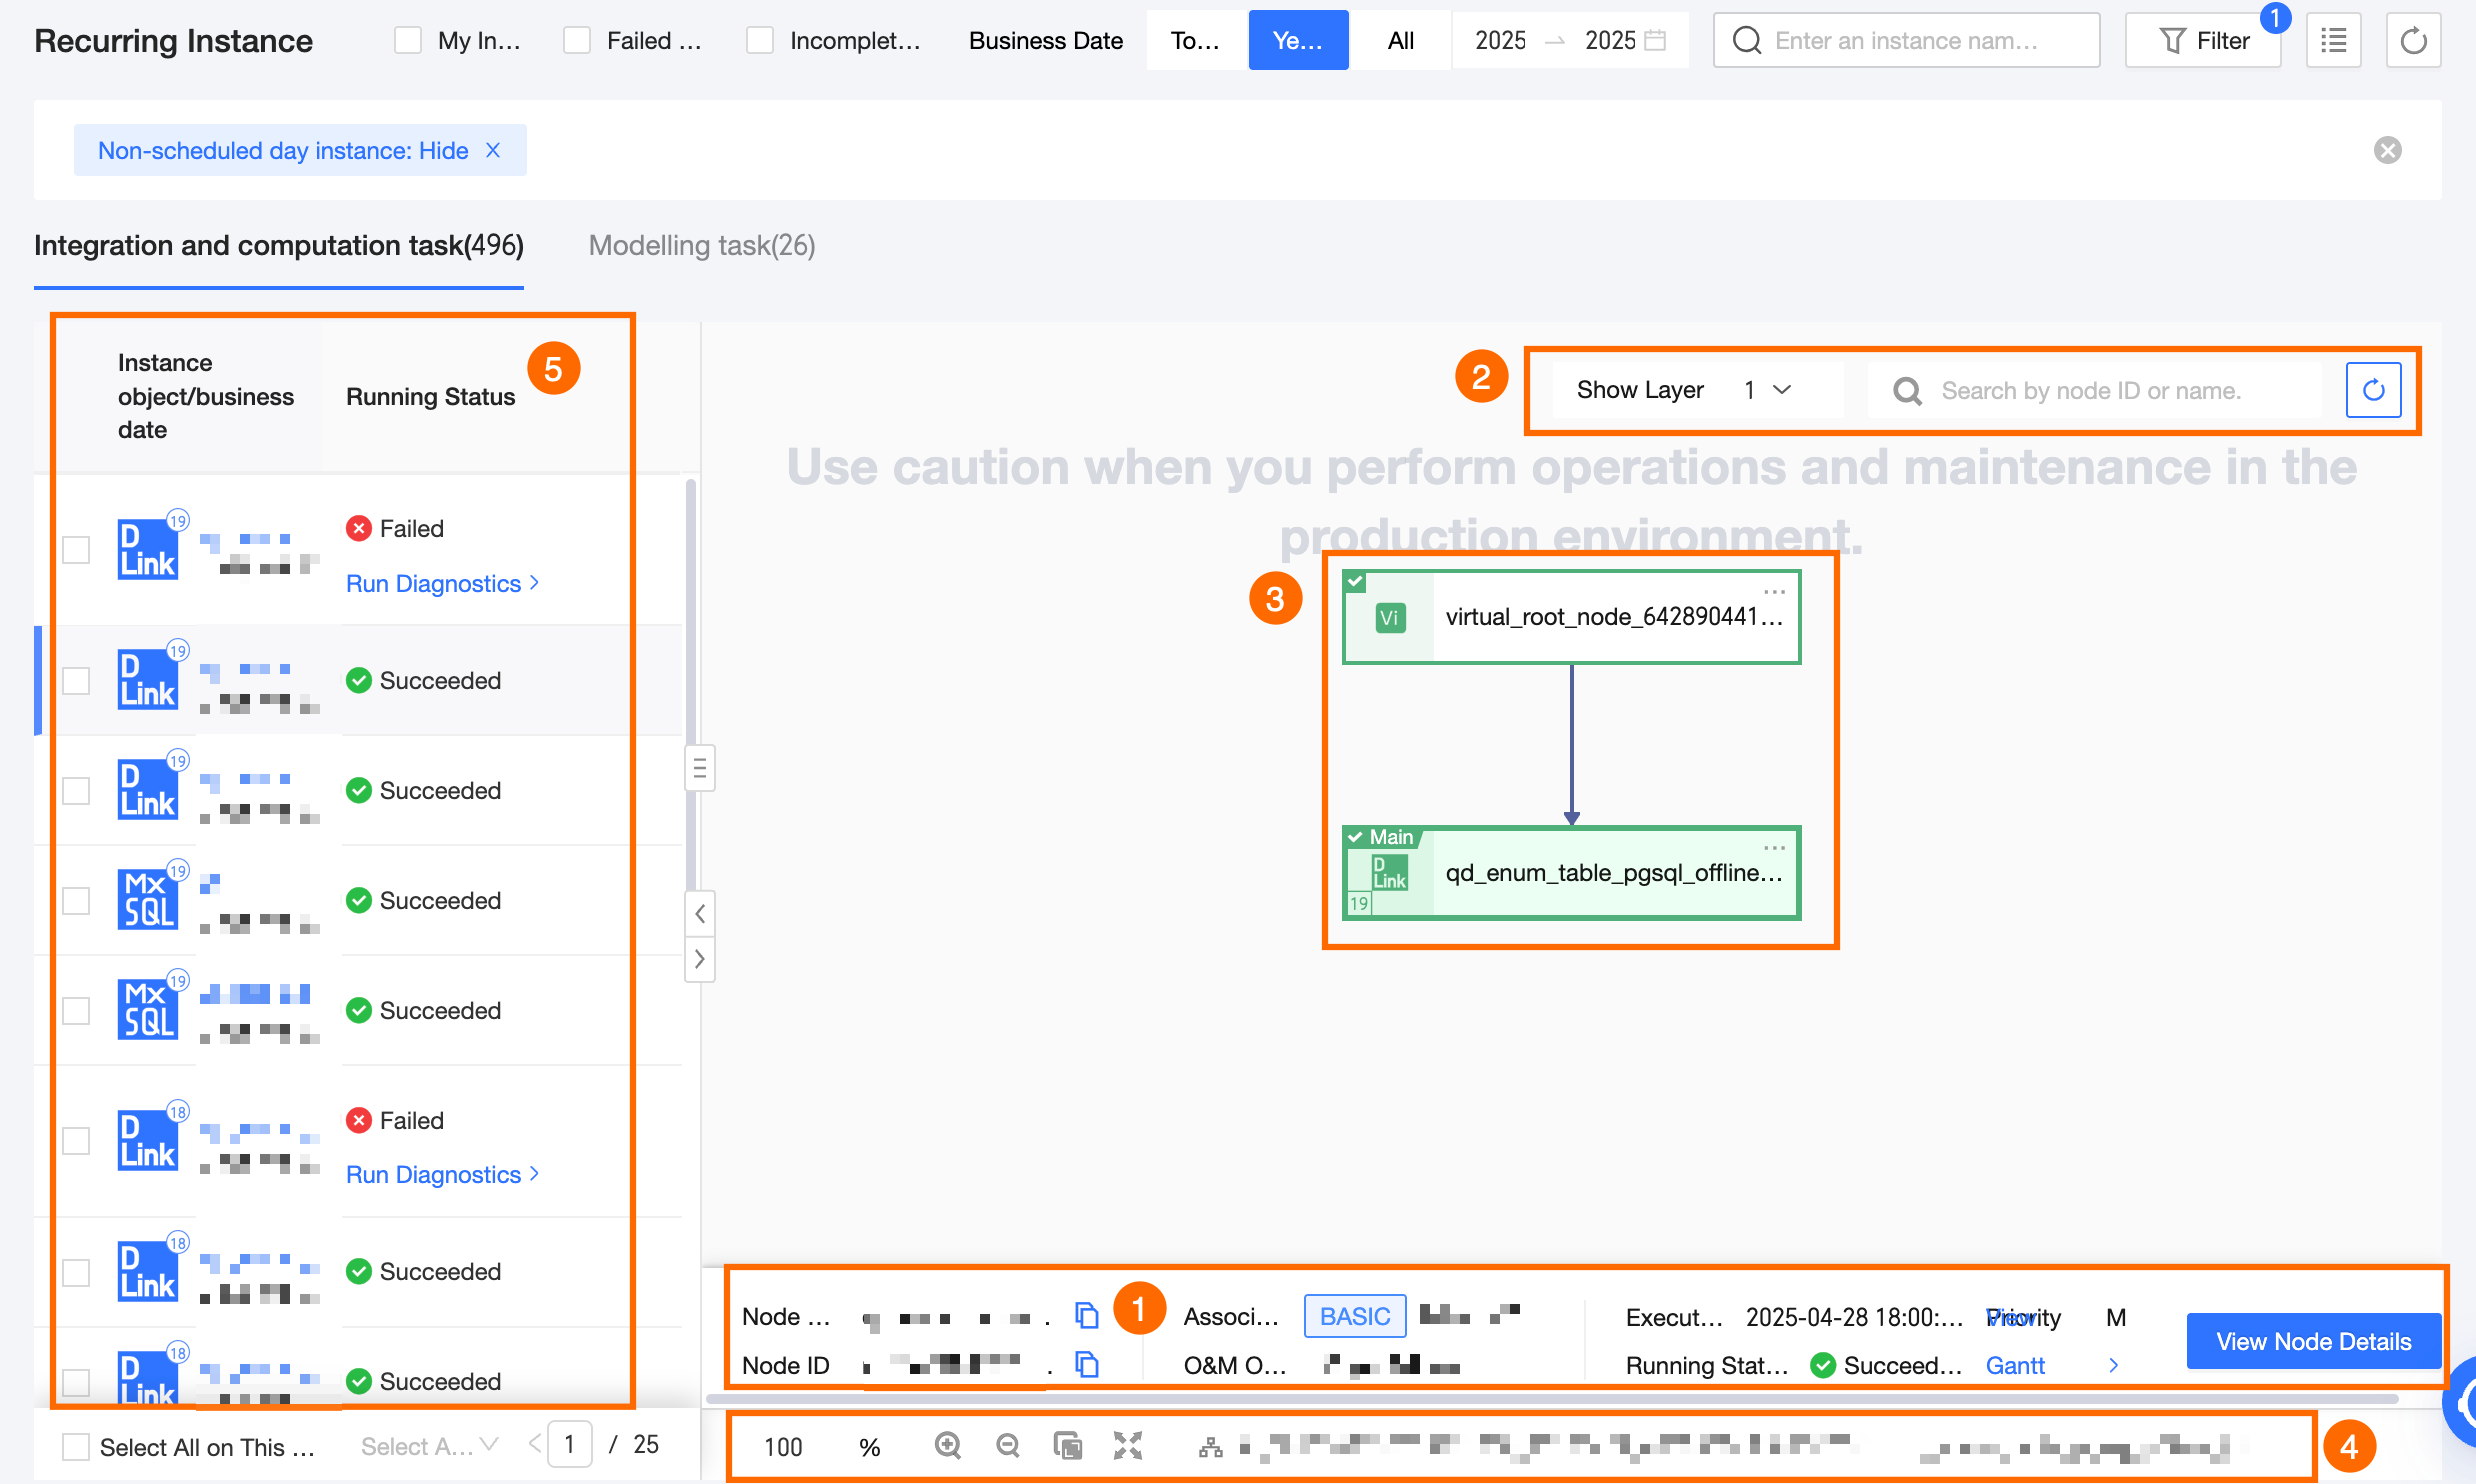
Section | Description |
① Node information | Displays a summary of the selected node. Click View Node Details for more information, including instance overview, run diagnostics, run log, operation log, node code, and task parameters.
Integration and compute task instances: Instance overview, Run diagnostics, Run log, Operation log, and Node code. Modeling task instances: Instance overview, Run diagnostics, Run log, Operation log, and Materialized code. Cross-tenant nodes (nodes that belong to other tenants): displays only the Instance overview. |
② Node filter area | Set the number of upstream and downstream levels to display. Search by node name to locate a specific node. |
③ Scheduling dependency graph | Displays the scheduling dependency graph. You can expand upstream and downstream nodes and manage them. Hover over a node to view its name, type, scheduling cycle, operator, and description. If a node has dependencies belonging to another tenant, a cross-tenant tag is displayed, and you can only expand its parent and child nodes. |
④ Canvas controls | Adjust the DAG display scale. Set a specific zoom level (default 100%), zoom in (up to 200%), zoom out (down to 20%), fit to canvas, or view in full screen. This area also displays the node ID and name of the main node. |
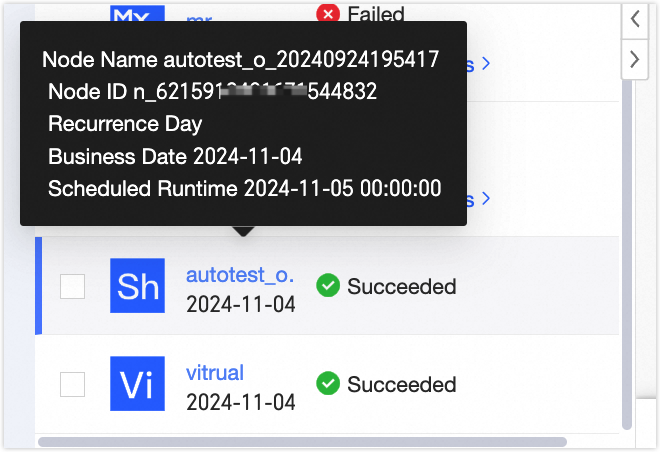
⑤ Instance list | When viewing the DAG, this list displays each instance's name and business date. Hover over an instance to view its node name, node ID, scheduling cycle, business date, and scheduled run time, as shown below: |