Monitor offline node status with configurable alert rules. When a node triggers a rule, the system alerts designated recipients to help you ensure normal node operation and data generation.
Monitoring scope
You can monitor recurring nodes, one-time nodes, logical table nodes (modeling nodes), and logical table fields in Basic projects or the Prod environment of Dev/Prod projects. Three levels are available: field level, node level, and project level.
-
Field-level monitoring: Monitors logical table fields. You can apply one rule to multiple fields or multiple rules to a single field. Configure node monitoring alert rules.
-
Node-level monitoring: Monitors individual nodes. You can apply one rule to multiple nodes or multiple rules to a single node. Configure node monitoring alert rules.
-
Project-level monitoring: Applies rules to all nodes in a project, or batch-configures rules by node type (node type + schedule type). Configure project monitoring alert rules.
Key capabilities
Dataphin supports batch rule configuration: apply the same rule to multiple nodes or fields, or apply multiple rules to a single node or field.
You can assign different recipients and notification methods to a single rule. For example:
-
Phone alerts for on-duty personnel — enables immediate response and minimizes downstream impact.
-
SMS or email alerts for responsible persons — tracks overall node health without requiring immediate action.
-
DingTalk group robot alerts for project administrators — monitors all project nodes via group messages for analysis.
Alert rule priority
When rules conflict, the following priority applies:
-
Field-level monitoring alert rules have higher priority than node-level ones, and node-level monitoring alert rules have higher priority than project-level ones. Field level > Node level > Project level.
-
If no node-level rule exists and multiple project-level rules share the same monitored object, alert reason, recipient, and receiving method but differ in frequency or sending time, a conflict occurs. Conflicting project-level rules are prioritized top-to-bottom in the rule list — the first matching rule takes effect.
ImportantNew project monitoring rules are placed at the top of the list and enabled by default.
Access offline node monitoring
-
On the Dataphin homepage, choose Development > O&M Center.
-
In the left navigation pane, choose Monitoring Management > Offline Node Monitoring.
Page layout
The offline monitoring page has three tabs: Node Monitoring, Field Monitoring, and Project Monitoring.
-
Node monitoring page
Displays configured node monitoring rules with columns such as monitored object, project, alert reason, creator, recipient (type), receiving method, last updater/time, monitoring interval, and status.
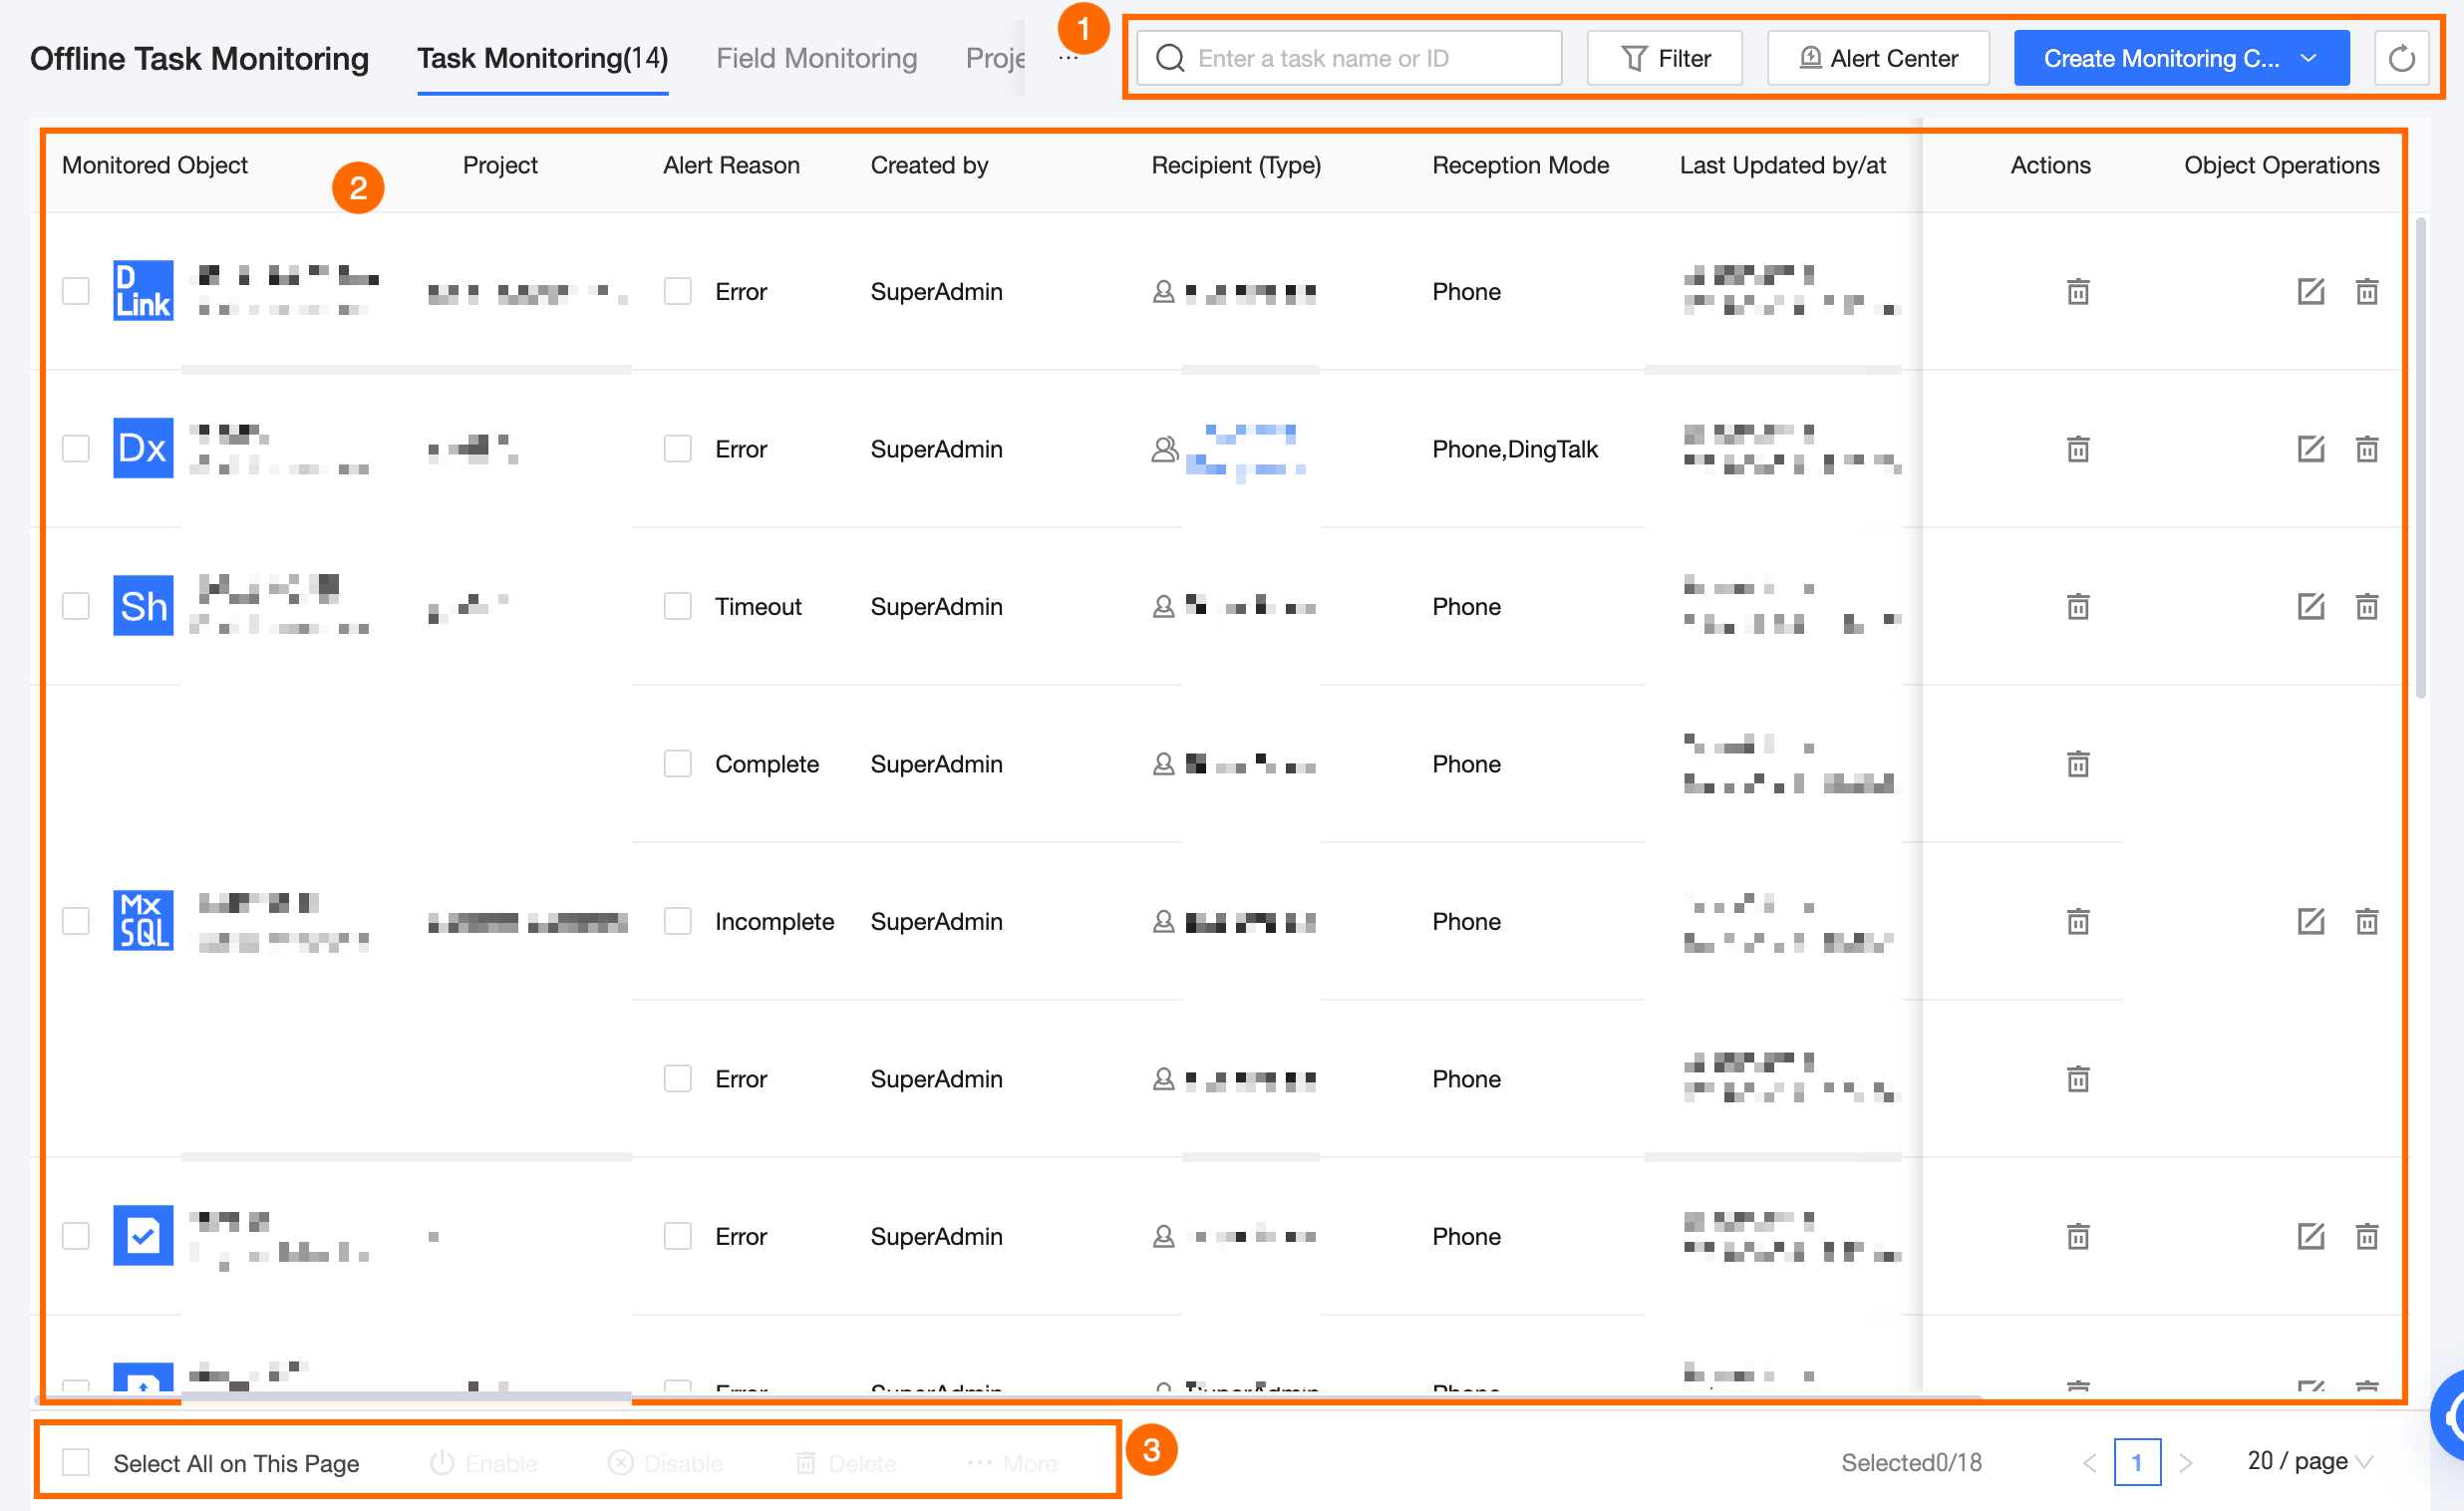
Area
Description
① Search and filter area
Search by Entering Node Name/node ID, or filter by Alert Reason, Receiving Method, Created By, or Recipient.
Available filters:
-
Alert Reason: Includes error, timeout, and incomplete.
-
Receiving Method: Includes phone, text message, DingTalk, and email.
-
Created By: The user who created the monitoring rule.
-
Recipient: The alert recipient configured in each monitoring rule.
-
Project: Select projects where you have O&M - access folder permission.
Click Reset to clear all filters.
② Node monitoring list
Edit, delete, or toggle monitoring rules.
③ Batch operations area
Batch delete rules or toggle monitoring. Click More to batch manage recipients and notification settings.
-
-
Field monitoring page
Displays configured field monitoring rules with columns such as logical table, monitored field, project, alert reason, creator, recipient (type), receiving method, last updater/time, monitoring interval, and status.
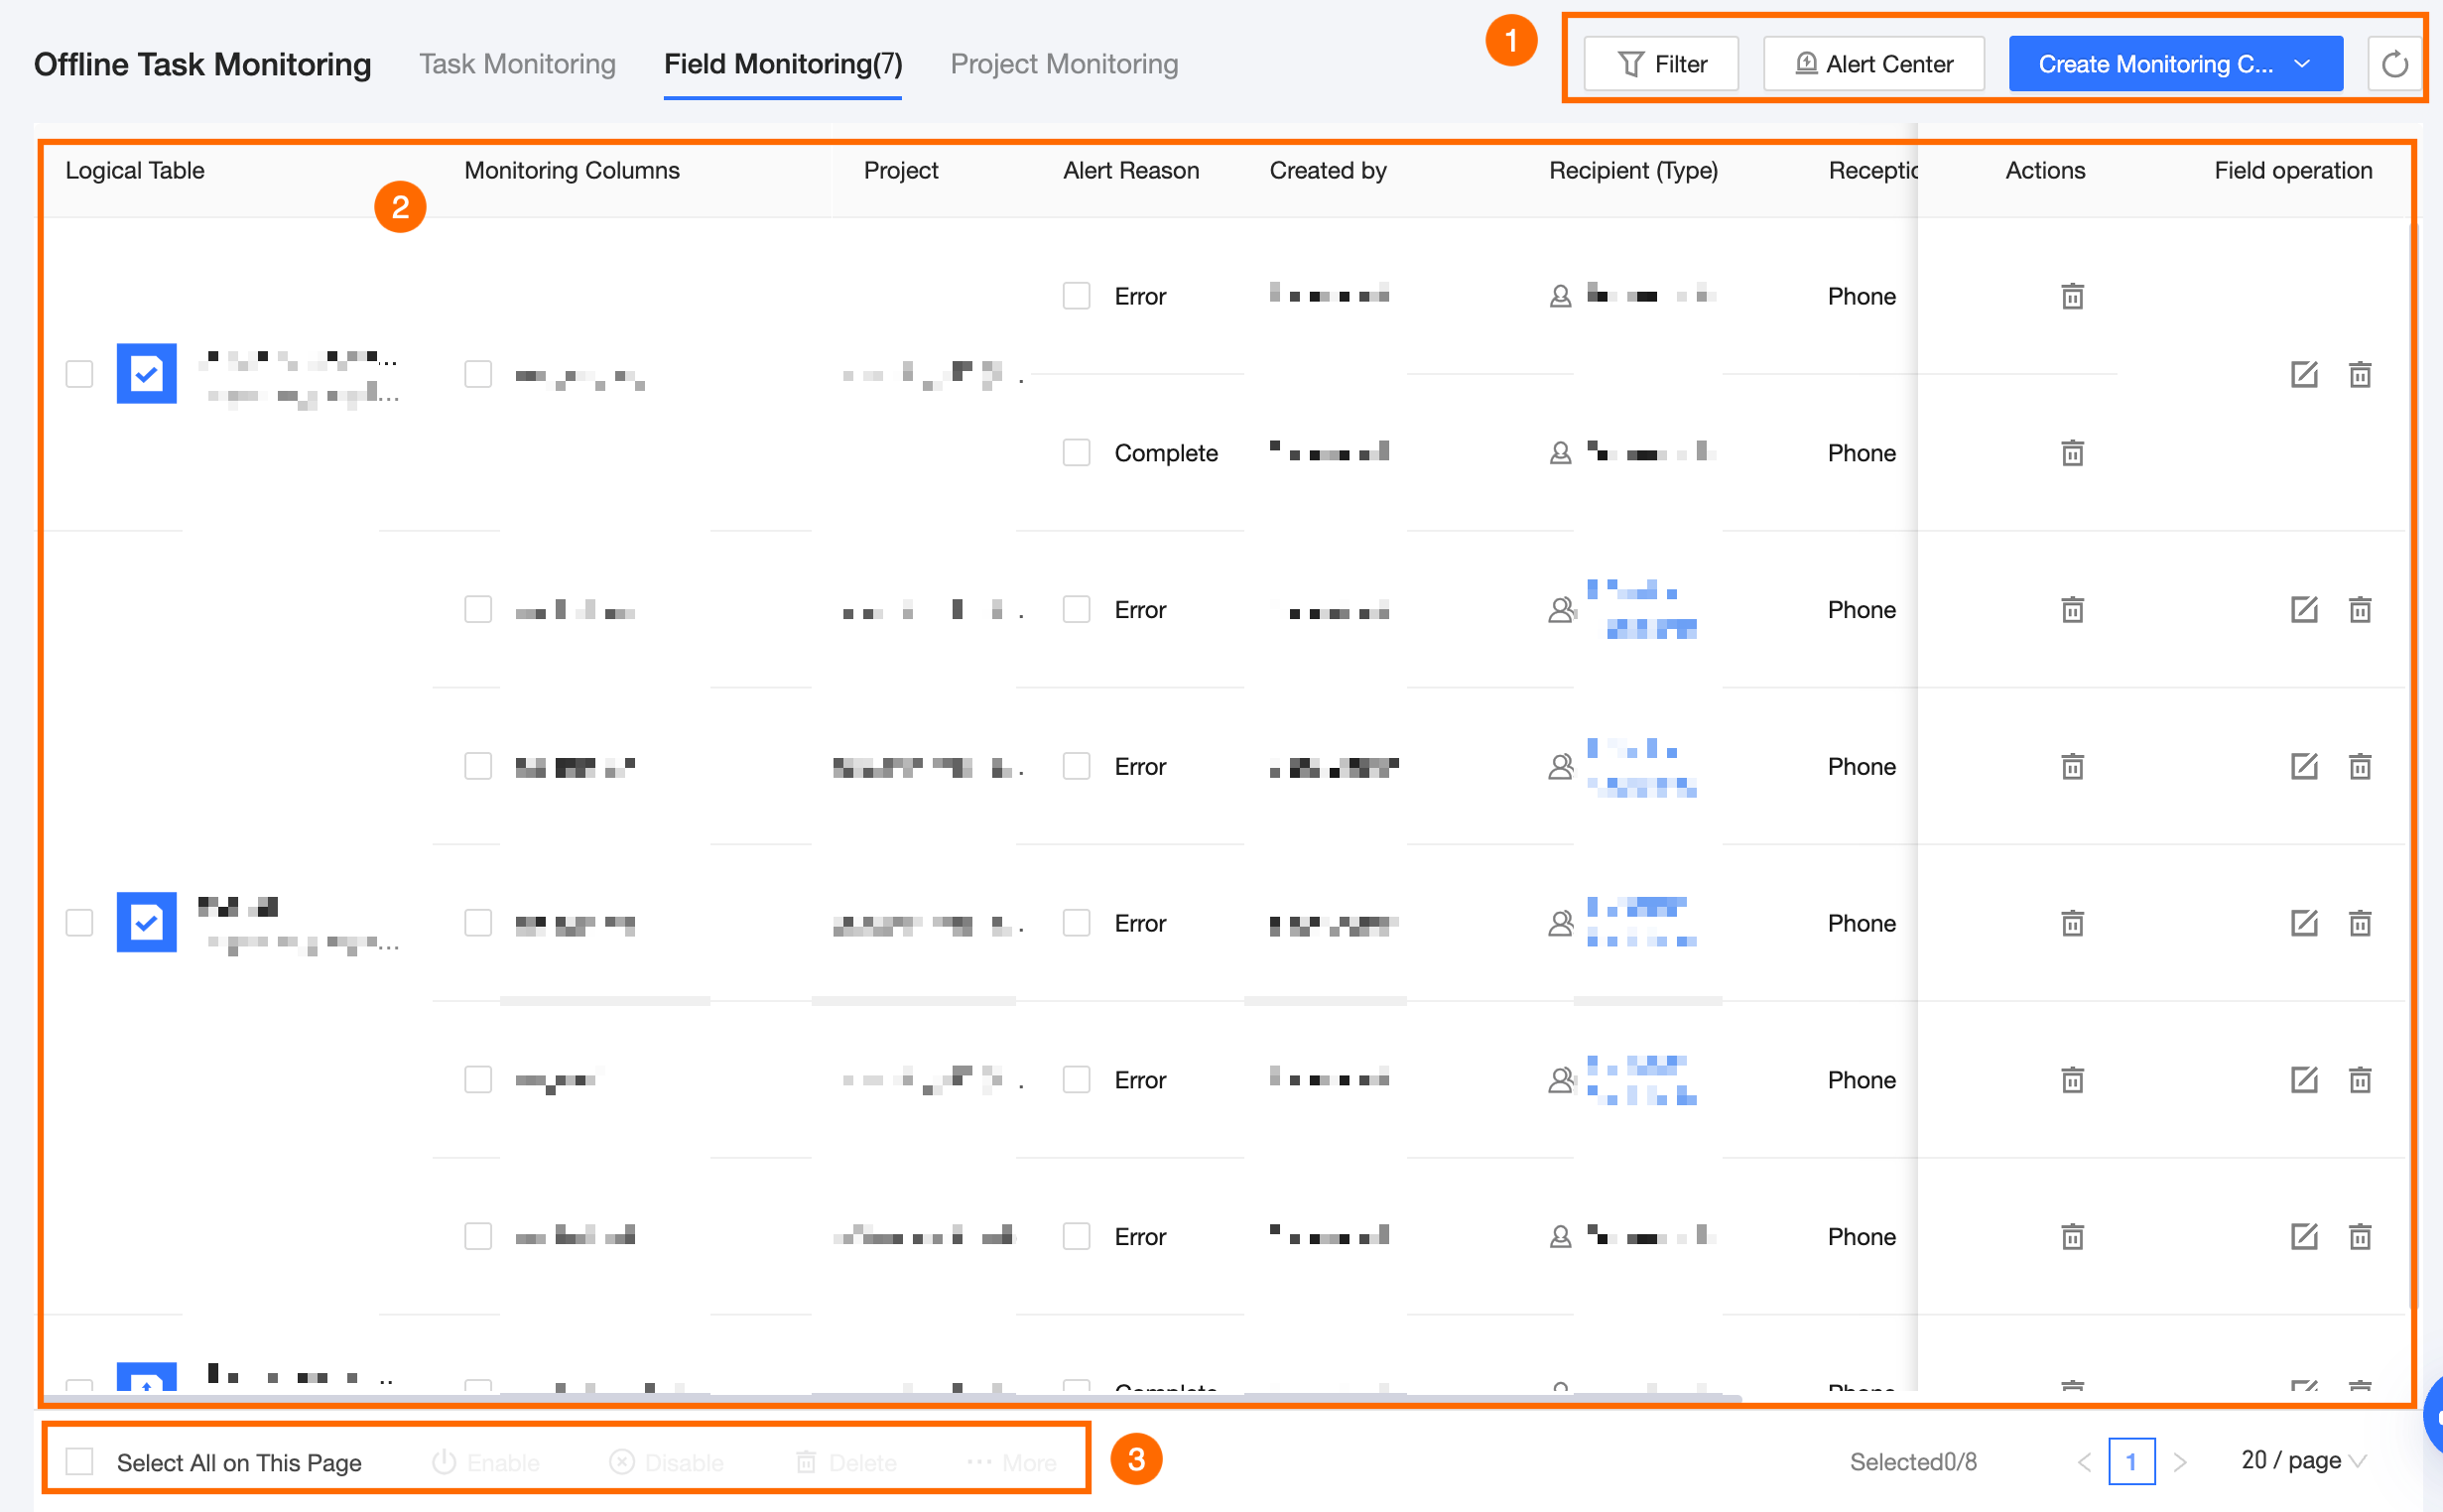
Area
Description
① Search and filter area
Search by Entering Node Name/node ID, or filter by Alert Reason, Receiving Method, Created By, or Recipient.
Available filters:
-
Logical Table: Enter a logical table name keyword to filter.
-
Monitored Field: Select multiple fields from the chosen logical table to filter.
-
Receiving Method: Includes phone, text message, DingTalk, and email.
-
Created By: The user who created the monitoring rule.
-
Recipient: The alert recipient configured in each monitoring rule.
-
Project: Select projects where you have O&M - access folder permission.
Click Reset to clear all filters.
② Node monitoring list
Edit, delete, or toggle monitoring rules.
③ Batch operations area
Batch delete rules or toggle monitoring. Click More to batch manage recipients and notification settings.
-
-
Project monitoring page
Displays configured project monitoring rules with columns such as rule name, monitoring scope, project, alert reason, creator, recipient (type), receiving method, last updater/time, and status.
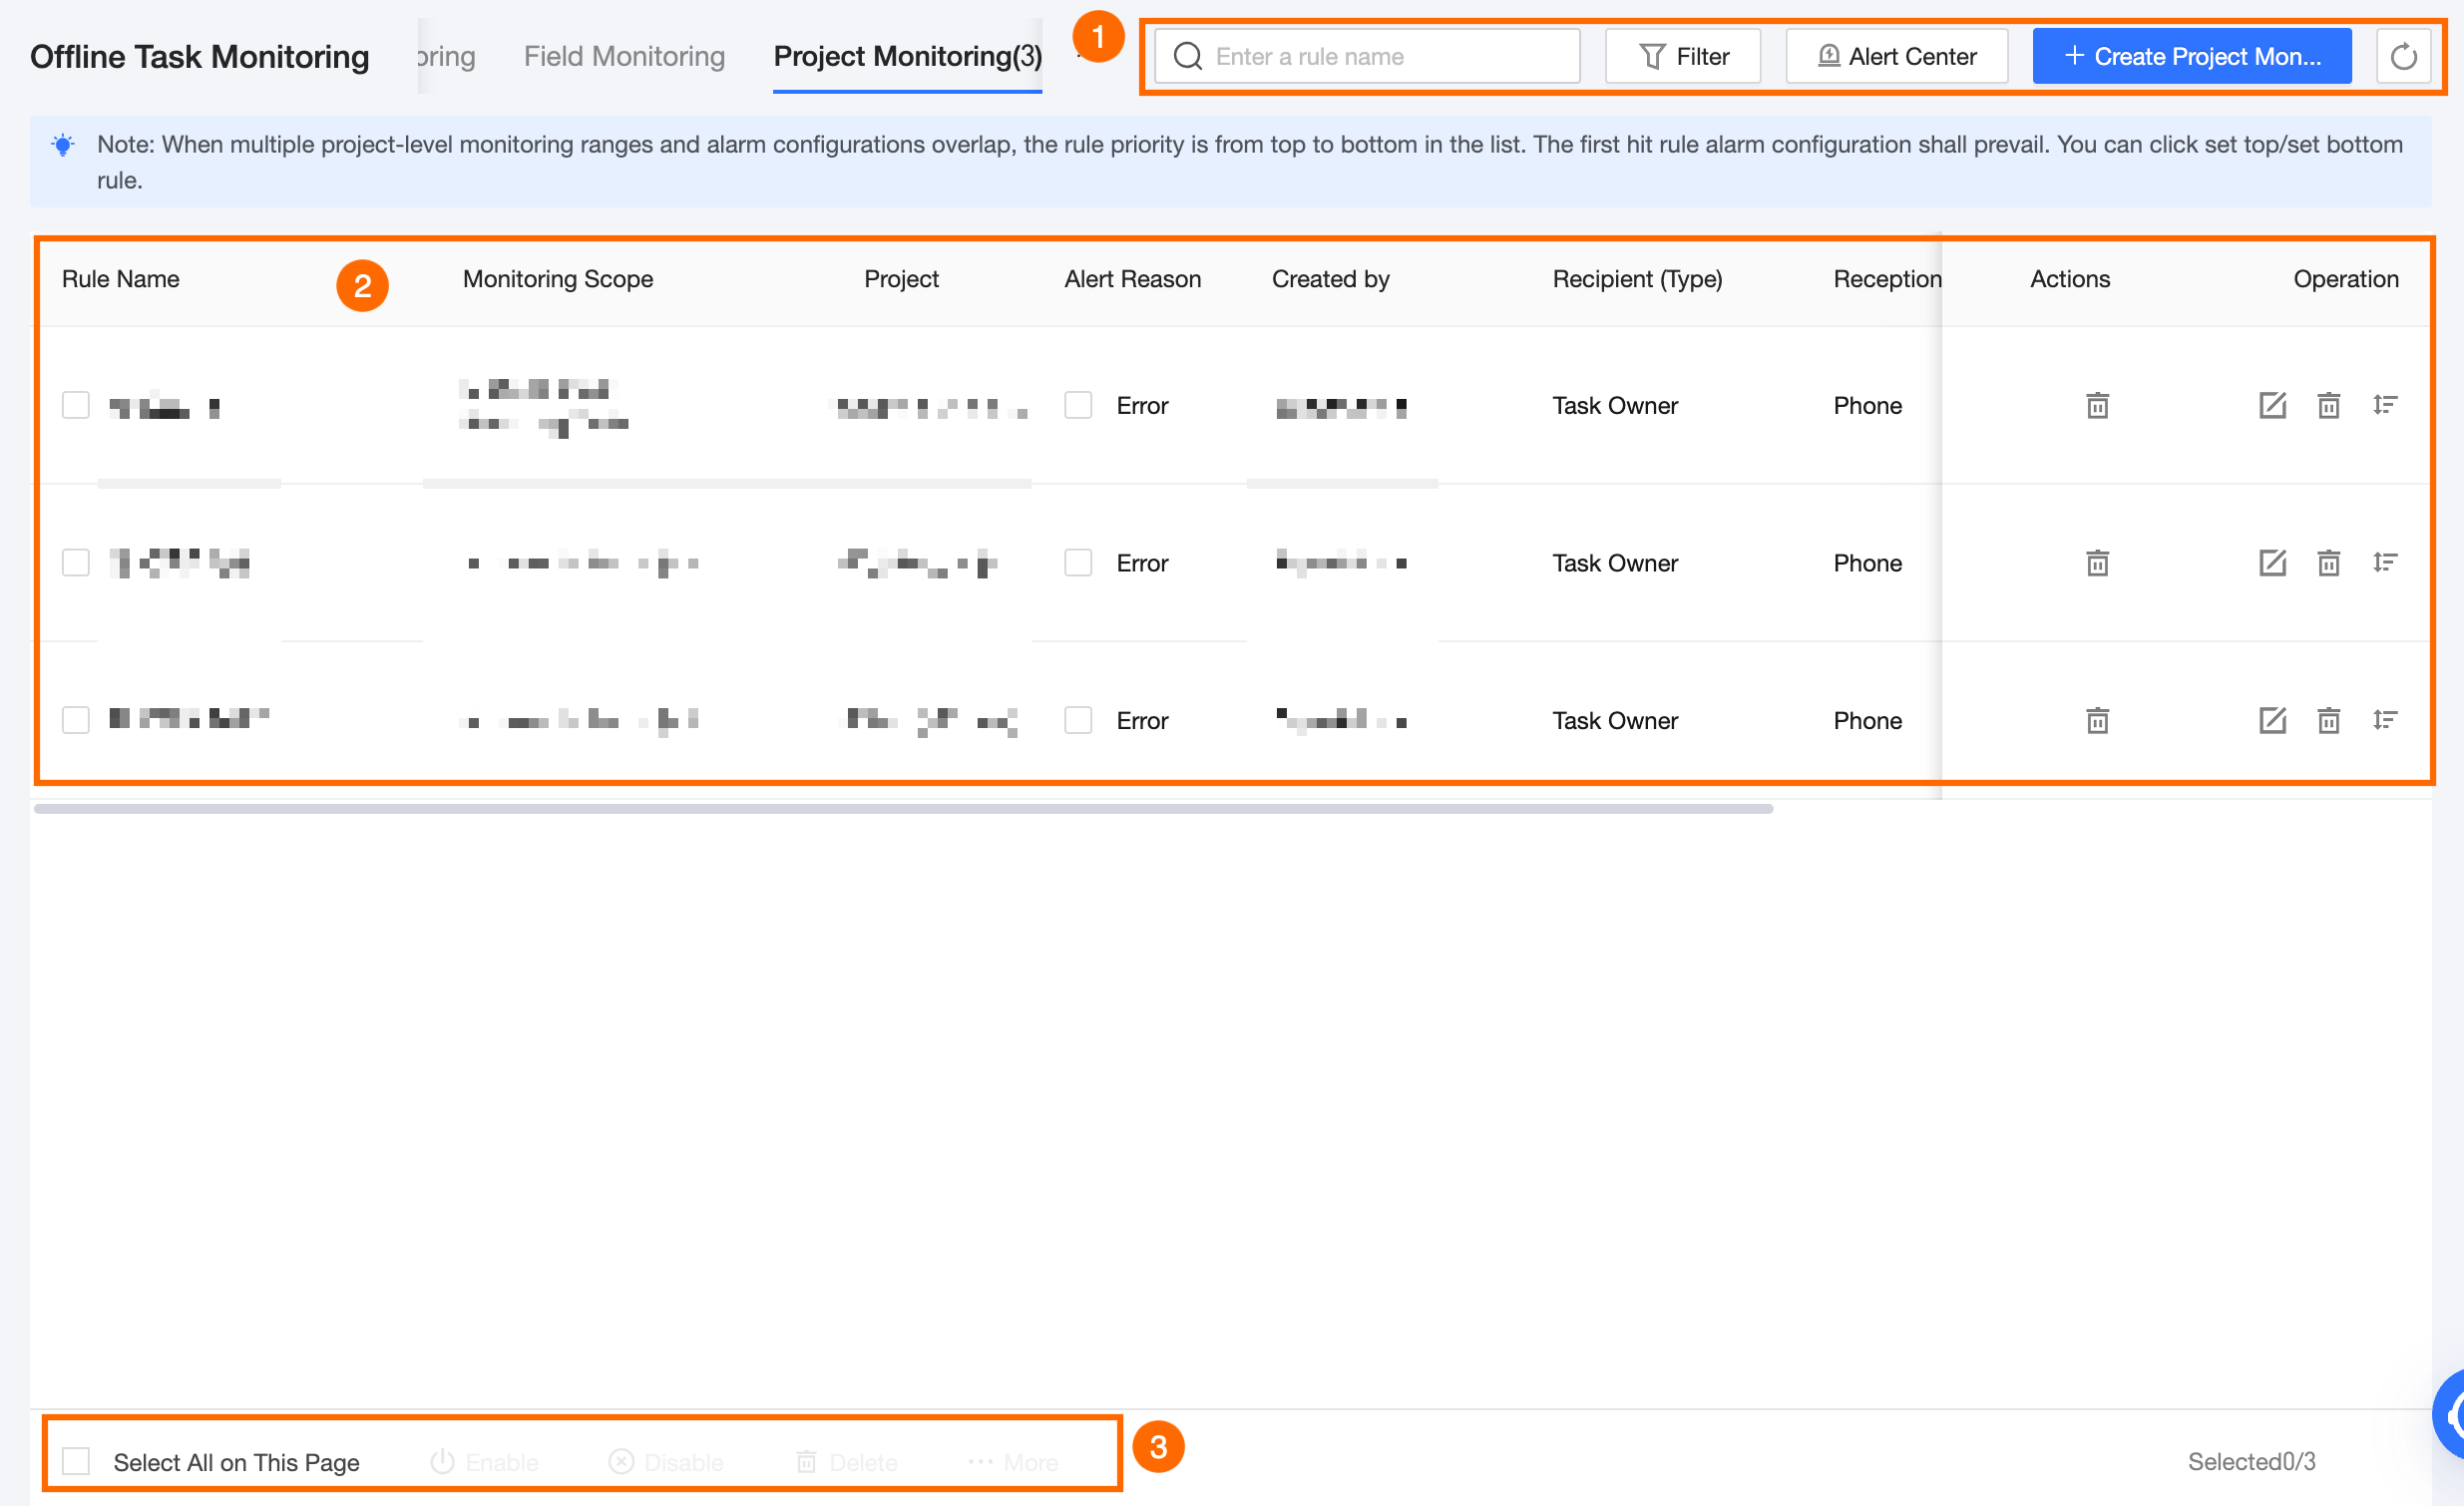
Area
Description
① Search and filter area
Search by Entering Node Name/node ID, or filter by Alert Reason, Receiving Method, Created By, or Recipient.
Available filters:
-
Alert Reason: Includes error, timeout, and incomplete.
-
Receiving Method: Includes phone, text message, DingTalk, and email.
-
Created By: The user who created the monitoring rule.
-
Recipient: The alert recipient configured in each monitoring rule.
-
Project: Select projects where you have O&M - access folder permission.
Click Reset to clear all filters.
② Monitoring rule list
Edit, delete, reorder (set priority), or toggle monitoring rules.
③ Batch operations area
Batch delete rules or toggle monitoring.
NoteEnabling or disabling the monitoring switch will take effect immediately.
Click More to batch manage recipients and notification settings.
-