After you add a node or an aggregate table field to a baseline’s guaranteed objects, baseline monitoring detects anomalies that prevent baseline nodes from completing on time and sends early warnings. This ensures critical data is generated within the expected time in complex dependency scenarios. It helps reduce O&M costs, minimize false alerts, and automatically monitor all important nodes.
Prerequisites
You have purchased the artificial intelligence for IT operations (AIOps) value-added service, and your tenant has enabled the AIOps module.
Scenarios
Manage Task Priority: When the number of tasks increases and resources are limited, resource contention may occur. To ensure that important tasks are allocated resources first, you can add them to a baseline and assign the baseline a higher priority.
Automatically predict node completion times: A node’s runtime depends on available resources and the status of its upstream nodes. After you add a node to a baseline, Dataphin calculates its estimated daily or hourly completion time so you can anticipate its status.
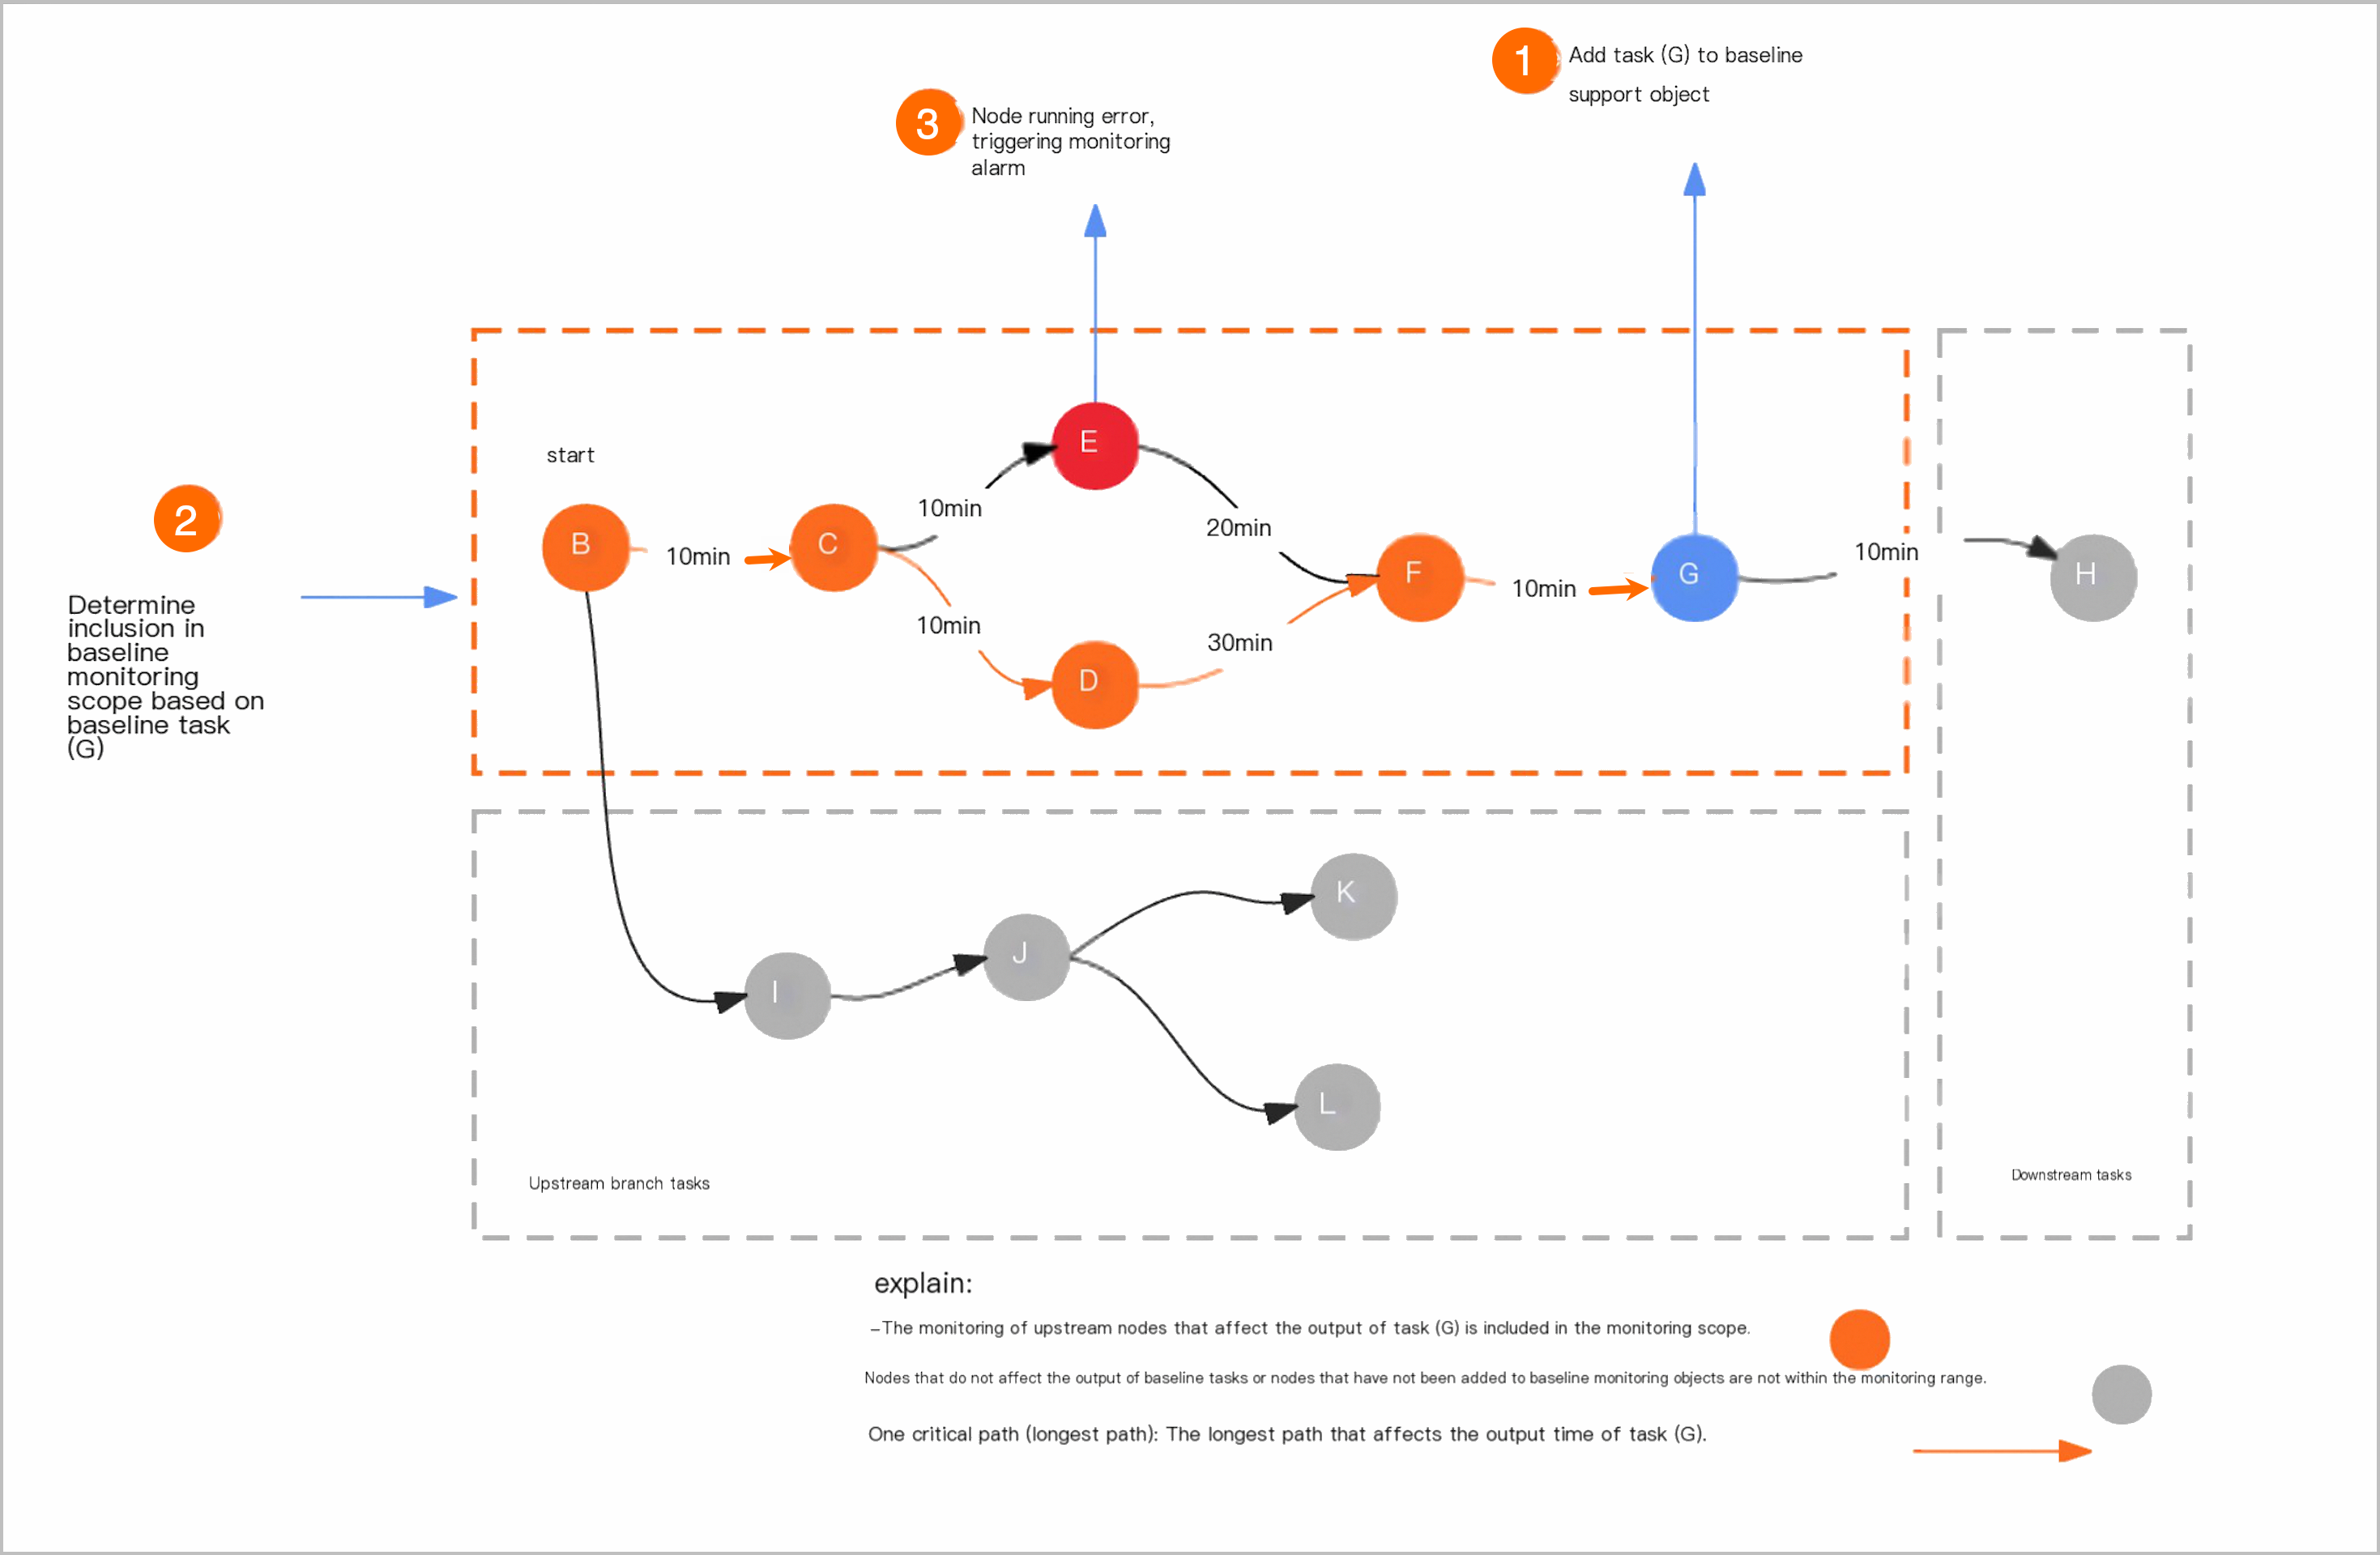
Automatically define the monitoring scope: After you add nodes or fields as guaranteed objects, the system automatically identifies upstream nodes that affect their output and includes them in the monitoring scope based on dependencies. This reduces manual O&M effort.
Baseline and event alerts: You can add a node to a baseline and set a guaranteed completion time. If Dataphin predicts the node will not complete before that time, or if an upstream node fails or slows down, it sends an alert. You can use the alert information to resolve issues promptly and ensure the node completes before its guaranteed completion time.
Identify critical paths and instances: Dependencies for a guaranteed node on a baseline can be complex. Dataphin provides a Gantt chart feature to help you quickly locate the critical paths and instances blocking data generation on the baseline. Among all paths affecting the baseline node’s output, the longest-running path is the baseline’s critical path.
Glossary
Before using the baseline monitoring feature in Dataphin, familiarize yourself with these core concepts and terms.
Baseline: Think of a baseline as an emergency lane on a highway. When you add a node to a baseline’s guaranteed objects, that node runs with higher priority than normal nodes. You can also set a guaranteed completion time. The system estimates the node’s completion time based on its runtime behavior. If the system determines the node may miss its committed time, it sends an alert.
Guaranteed object: A baseline can have one or more guaranteed objects. These can be physical nodes or logical table fields.
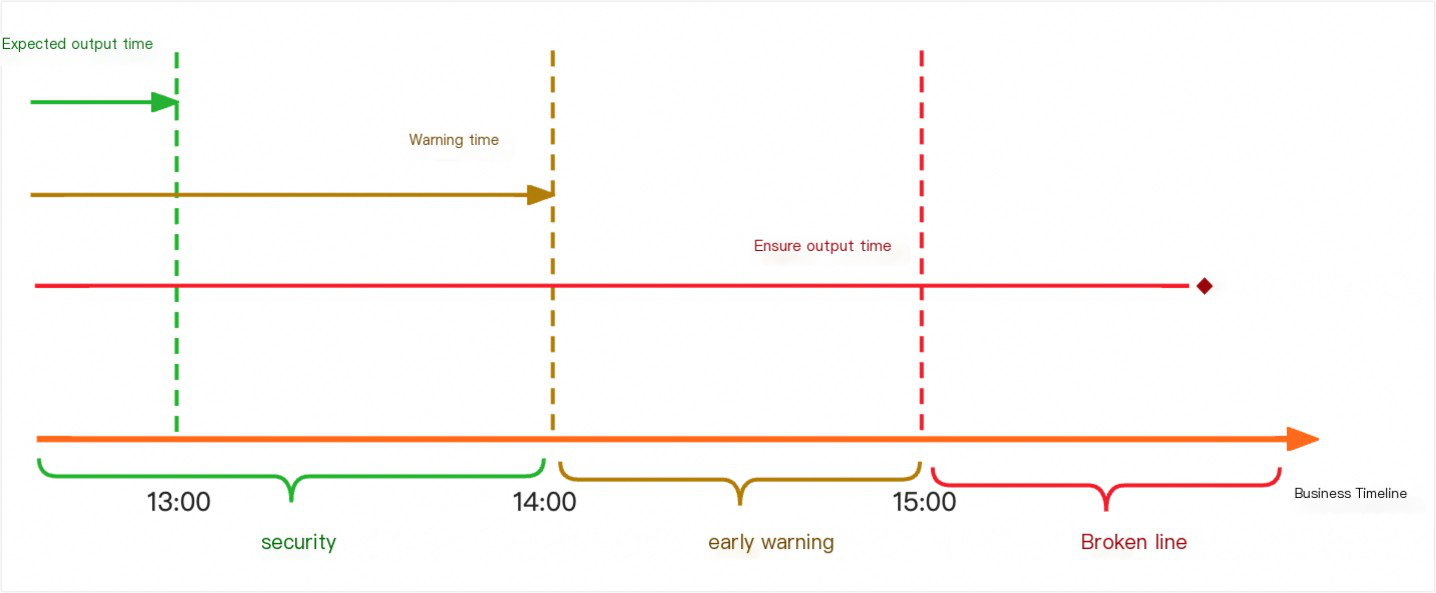
Guaranteed completion time: The latest time by which a node must successfully run. You can also set an alert margin. The system uses this to calculate the alert time and trigger an alert accordingly. When a node reaches its alert time and remains incomplete, the system sends an alert. This provides a buffer to handle exceptions before the guaranteed completion time.
Alert time: Equal to Guaranteed completion time - Alert margin.
Historical estimated completion time: Based on the last seven successful runs of the baseline node, the system predicts its estimated completion time for each subsequent run.
Baseline instance status: A baseline instance can have one of three statuses: Safe, Warning, or Breached:
Safe: Historical estimated completion time < Alert time.
Warning: Alert time < Historical estimated completion time < Guaranteed completion time.
Breached: Estimated completion time > Guaranteed completion time.
Critical path (longest path): Among all paths affecting a baseline node’s execution, this is the path with the longest runtime. You can think of it as the critical path in a PERT chart.
Baseline alert: A baseline alert is generated when the business time reaches the baseline’s alert time and the node remains incomplete.
Event alert: An event alert is generated when a baseline node or its upstream nodes fail, or when a node on the critical path slows down.
Function overview
After you add an important node to a baseline, the system prioritizes its execution according to the baseline’s priority. The monitoring scope is determined by the dependencies of the baseline node. Baseline alerts and event alerts are triggered based on the runtime status of nodes within this scope.
The basic workflow for using baseline monitoring is as follows.
Create a baseline and add guaranteed objects
You can create and manage baselines on the Baseline Monitoring page. For more information about creating and managing baselines, see Create a baseline monitor.
Define the monitoring scope
After you create a baseline, the system defines the monitoring scope based on the dependencies of the guaranteed objects. This ensures monitoring covers all nodes that affect the baseline’s data output. For more information about the rules for defining the scope, see Monitoring scope rules.
Trigger and send alerts
Baseline alert
During actual node execution, a baseline alert is generated when the business time reaches the baseline’s alert time and the baseline node remains incomplete. For more information about baseline alert rules, see Baseline alert rules.
Event alert
After the monitoring scope is defined, an event alert is triggered when a baseline node or its upstream nodes fail, or when a node on the critical path slows down. For more information about event alert rules, see Event alert rules.
Baseline monitoring rules
Before configuring baseline monitoring, review the relevant baseline monitoring rules. These include monitoring scope rules, baseline alert rules, event alert rules, historical estimated completion time rules, and baseline status rules.
Monitoring scope rules
After you create a baseline, the system defines the monitoring scope based on the dependencies of the guaranteed objects. The rules for defining the monitoring scope are as follows:
Upstream nodes: Upstream nodes that affect the data output of the baseline nodes are included in the baseline monitoring scope.
Upstream branch nodes: Other upstream branch nodes that do not affect the data output of the baseline nodes are excluded from the baseline monitoring scope.
Downstream nodes: Downstream nodes are excluded from the baseline monitoring scope.
Baseline alert rules
After you add an important node to a baseline and set the guaranteed completion time and alert margin, the system calculates the alert time as Guaranteed completion time - Alert margin. During actual node execution, a baseline alert is generated when the business time reaches the baseline’s alert time and the baseline node remains incomplete.
Event alert rules
After the monitoring scope is defined, an event alert is triggered when a node within the scope becomes abnormal. Node abnormalities include the following:
Error: The node fails to run.
Slowdown: Based on the last seven normally scheduled and successful runs, the system calculates the historical average runtime. If the current runtime exceeds that average by 30%, a slowdown alert is triggered.
You can view generated alert events in the Alert Center. For more information, see Alert events.
Historical estimated completion time rules
A baseline’s historical estimated completion time is calculated from the last seven successful runs of the nodes added to the baseline. When a baseline has multiple guaranteed objects, the baseline’s historical estimated completion time is derived from the average completion time of each baseline node.
Hourly nodes are excluded from the calculation. If insufficient data is available, results may be inaccurate and should be used for reference only.
Baseline status rules
After you configure the guaranteed objects, guaranteed completion time, and alert margin for a baseline, its status changes over time based on these parameters. For example, assume the estimated completion time of a baseline is 13:00, the guaranteed completion time is 15:00, and the alert margin is 60 minutes (1 hour). The alert time is therefore 14:00 (Guaranteed completion time - Alert margin). Before the business time reaches 14:00, the baseline status is Safe. After 14:00, if the node remains incomplete, a baseline alert is triggered and the status becomes Warning. If the baseline node is still incomplete when the business time reaches the guaranteed completion time of 15:00, the status becomes Breached.
Access baseline monitoring
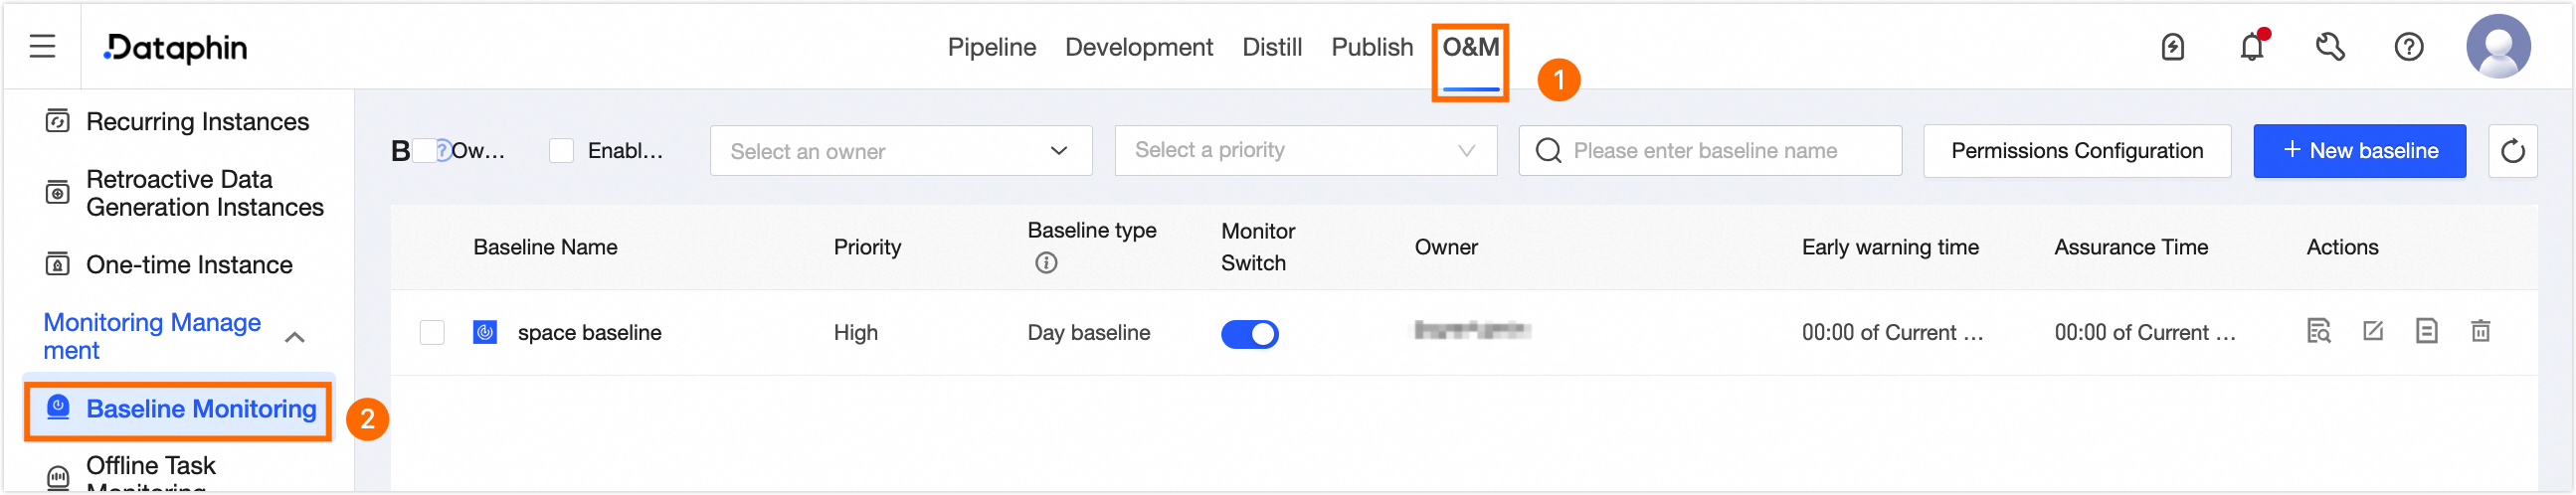
On the Dataphin home page, click Develop in the top menu bar.
On the O&M page, click Baseline Monitoring in the navigation pane on the left to go to the Baseline Monitoring page.
Baseline monitoring page
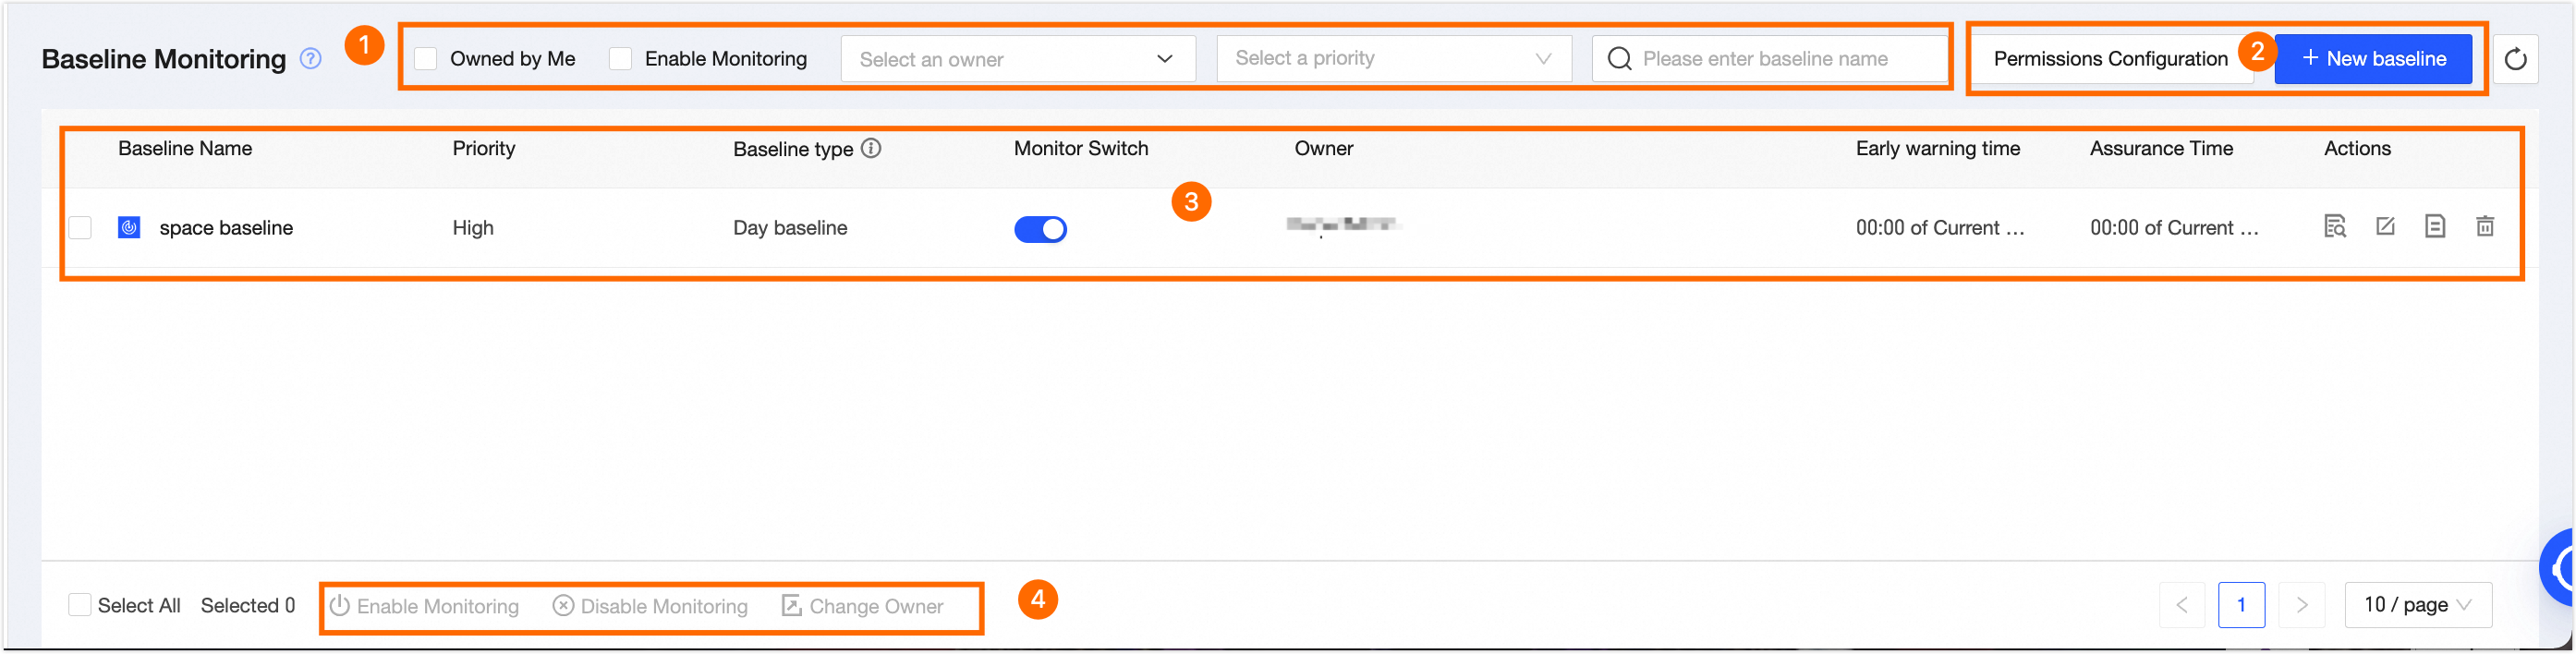
The Baseline Monitoring page consists of a search and filter area, a baseline node list, and a batch operations area. On this page, you can perform O&M operations such as viewing, editing, checking change history, and deleting baseline monitors.
Block | Description |
① Search and filter area | The search and filter area lets you filter baseline monitors by entering a baseline name. You can also quickly filter by checking Owned by me, Monitoring enabled, or selecting an owner or priority.
|
② Operations area |
|
③ Baseline monitoring list | The Baseline Monitoring page displays a list of your configured baselines, including details such as Baseline Name, Priority, Baseline Type, Monitoring Switch, Owner, Alert Time, and Commit Time. You can also click the Note Baseline types include the space baseline and the airborne baseline.
You can perform O&M on baseline monitors. The supported operations are as follows:
|
④ Batch operations area | You can use the batch operations area to enable monitoring, disable monitoring, and modify the owner for multiple baseline monitors at once to improve efficiency. |