Database performance optimization and monitoring are important tasks for database administrators and developers. The Performance Insight (New Version) feature of Database Autonomy Service (DAS) uses MySQL's performance_schema to aggregate SQL information. This feature helps you promptly detect performance issues, provides administration solutions, and improves the performance and stability of your database. It also collects statistics on tables and indexes with no traffic, helping you identify and remove these objects to improve storage utilization and database performance.
Prerequisites
The database instance is one of the following types:
RDS MySQL
NoteApsaraDB RDS for MySQL Basic Edition is not supported.
ApsaraDB RDS for MySQL 5.5 is not supported.
MyBase for MySQL
PolarDB for MySQL
The database instance must have 8 GB or more of memory.
The database instance must have performance_schema enabled. For more information, see Enable Performance Schema. If performance_schema is not enabled, you are prompted to go to the parameter settings page when you enable the service.
NoteEnabling Performance Schema consumes some database instance resources. For more information, see Performance Schema stress test report.
The database instance is located in one of the following regions: China (Hangzhou), China (Shanghai), China (Qingdao), China (Beijing), China (Zhangjiakou), China (Shenzhen), China (Chengdu), China (Hong Kong), Singapore, Malaysia (Kuala Lumpur), and Indonesia (Jakarta).
Billing
Performance Insight is a value-added feature of DAS Economy Edition and Enterprise Edition V3. It is available for instances in regions where these editions are supported. You are charged based on the edition that you enable.
For more information about the databases and regions supported by DAS Economy Edition and Enterprise Edition V3, see Databases and regions supported by different editions.
For more information about the billing of DAS Economy Edition and Enterprise Edition V3, see Billing details.
In regions where DAS Economy Edition and Enterprise Edition V3 are not yet available, Performance Insight is in a free public preview. When these editions become available in a region, the free public preview for Performance Insight in that region ends, and the feature becomes a value-added service of DAS Economy Edition and Enterprise Edition V3.
Features
The Performance Insight (New Version) feature uses MySQL's performance_schema to aggregate SQL information. This helps you assess the load on the target database and identify the root cause of performance issues.
You can quickly identify the Resource Usage, Executions, Scanned Rows, and Execution Duration for all SQL statements.
You can view performance trends for different metrics of the target database and detailed information about target SQL statements.
You can query detailed information about target SQL statements by SQL ID and keyword.
You can view trends for the target SQL's Resource Usage, Executions, Scanned Rows, and Execution Duration, along with SQL sample information.
You can throttle and optimize target SQL statements.
You can compare the Resource Usage, Executions, Scanned Rows, and Execution Duration of all SQL statements and the detailed metrics of a specific SQL statement across different time periods.
You can view tables and indexes with no traffic. DAS collects usage data for tables and indexes in the early morning every day to determine whether they are still in use. It then counts the number of days they have had no traffic.
NoteThe minimum number of days with no traffic is 7. This means that after you enable the feature to identify tables and indexes with no traffic, it takes at least 7 days before you can view the data.
Compared with the old version, the new version provides more metric dimensions and viewing methods:
Comparison Item | Performance Insight (New Version) | |
Metric dimensions |
|
|
Viewing methods |
| You can view metric trends and detailed information for target SQL statements within a specified time range. |
Management solution | You can throttle and optimize target SQL statements. | You can optimize target SQL statements. |
Supported database engines | Supports ApsaraDB RDS for MySQL, PolarDB for MySQL, and MyBase for MySQL. | Supports ApsaraDB RDS for MySQL, ApsaraDB RDS for PostgreSQL, PolarDB for MySQL, PolarDB for PostgreSQL, MyBase for MySQL, and PolarDB for PostgreSQL (Compatible with Oracle). |
Procedure
Log on to the DAS console.
In the navigation pane on the left, click Intelligent O&M Center > Instance Monitoring.
Find the target instance, click the instance ID, and then go to the instance details page.
In the navigation pane on the left, click Performance Insight.
If you have not enabled Alibaba Cloud Managed Services, the You have not activated O&M Service prompt appears. Click the Enable O&M Service button. On the Activate O&M Service page, select a Service Duration and click the Activate button.
On the Performance Insight tab, click Enable Performance Insight.
If you have not enabled performance_schema, the Parameter Settings dialog box appears. Click the Configure button and follow the instructions in Enable Performance Schema to configure the performance_schema parameters.
WarningModifying these parameters requires you to restart the database instance. We recommend that you perform this operation during off-peak hours and ensure that your application has a reconnection mechanism.
When you enable Performance Insight, the feature to identify tables and indexes with no traffic is enabled by default.
ImportantAs of April 11, 2023, Performance Insight includes a feature that identifies tables and indexes with no traffic. This feature is automatically enabled when you enable Performance Insight for an instance. For instances where Performance Insight was enabled before April 11, 2023, you can manually enable Identification for Tables and Indexes with No Traffic in Service Settings.
On the Performance Insight page, you can use the following tabs: Display by Time Range, Display by Comparison, and Tables/Indexes.
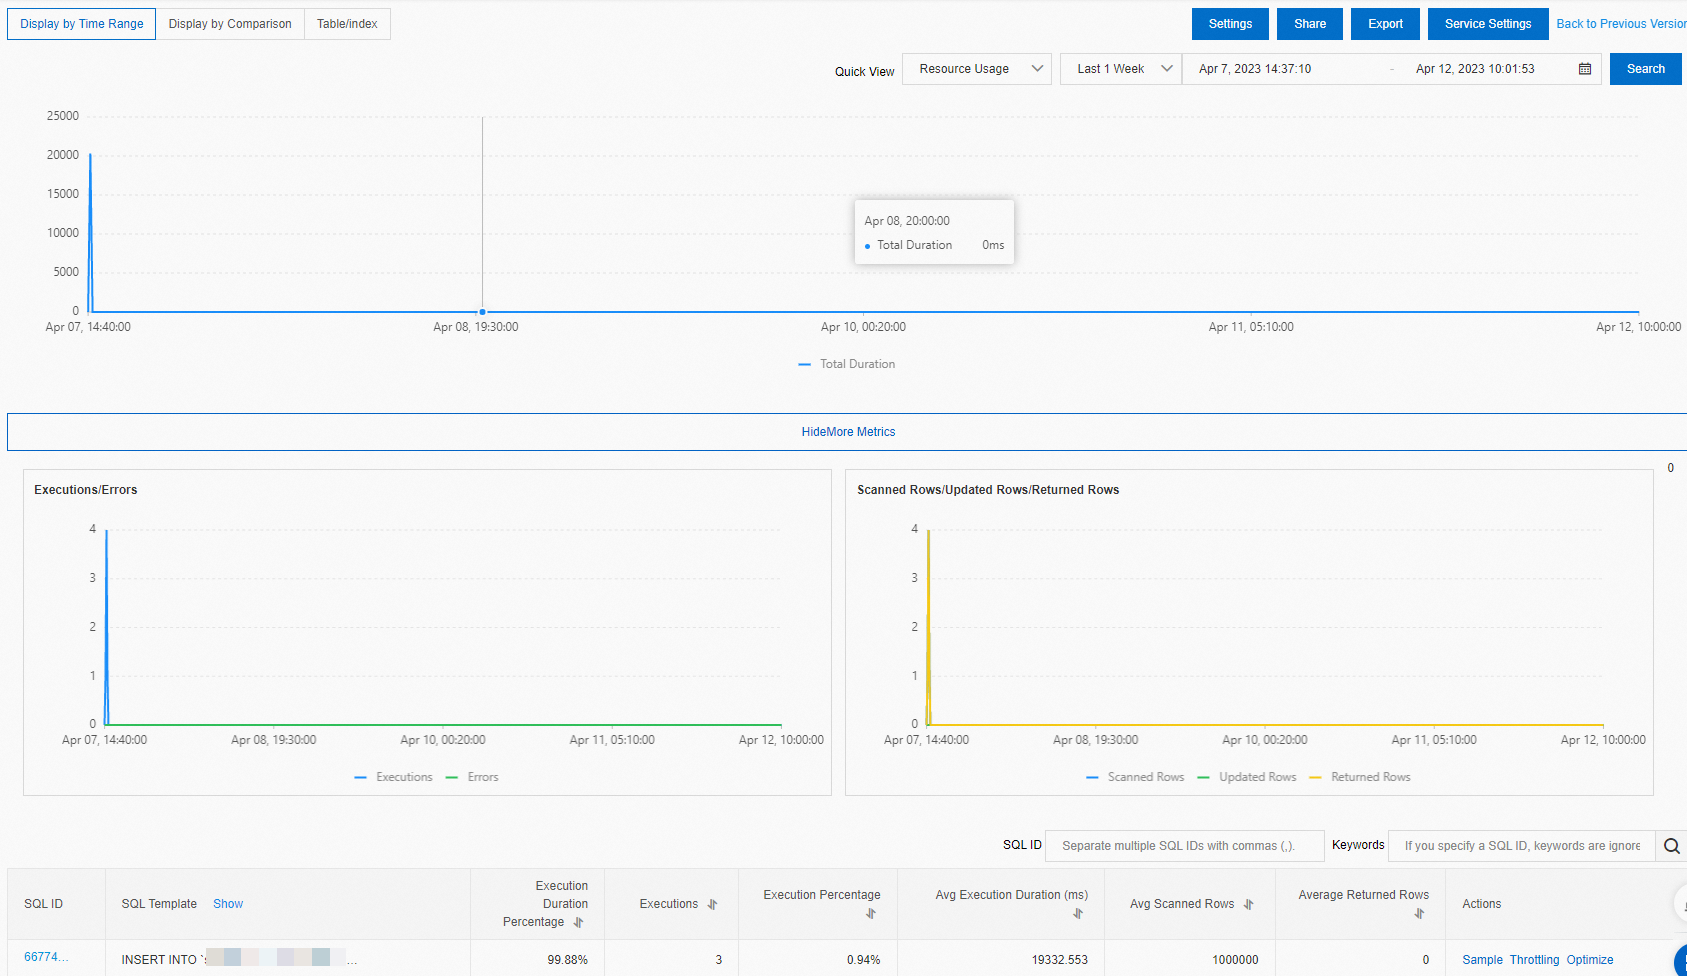
Display by Time Range:
In the Quick View, you can select a metric, such as Resource Usage, Executions, Scanned Rows, Execution Duration, or Average Active Sessions, and specify a time range to view its trend graph.
NoteWhen you select a time range, the end time must be later than the start time. You can view data for any seven days within the last month.
You can click Export to save the SQL information locally.
You can click Show to view graphs of key metric trends.
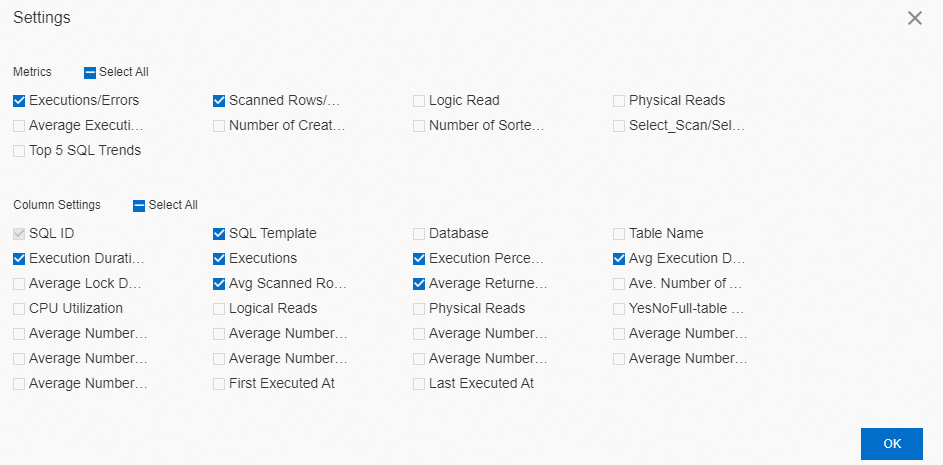
NoteYou can click Settings, and in the Metrics area, select the metrics to display in the trend graphs.
In the SQL list, you can view the details of SQL statements.
NoteYou can click Settings, and in the Column Settings area, select the statistical metrics to display in the list.
You can click the target SQL ID to view trend graphs for Resource Usage, Executions, Scanned Rows, and Execution Duration within the selected time range. You can also view SQL sample information.
You can click Sample in the Actions column to view the sample information for the target SQL statement.
In the Actions column for the target SQL, you can click Throttling. On the SQL Throttling page, you can configure the throttling parameters. For more information, see SQL throttling.
You can click Optimize in the Actions column for the target SQL to view the SQL diagnosis results in the SQL Diagnostic Optimization dialog box.
If you accept the diagnostic suggestion, click Copy in the upper-right corner of the page, and then paste the optimized SQL into a database client or DMS to execute it. If you do not accept the suggestion, click Cancel.
NoteDAS diagnoses the SQL statement based on its complexity, the data volume of the corresponding table, and the database load. The diagnosis may take more than 20 seconds. After the diagnosis is complete, the diagnostics engine provides a diagnostic result, an optimization suggestion, and the expected benefits. You can then decide whether to accept the suggestion.
You can also purchase the Database Expert Service by clicking Expert Service. This service provides professional database support beyond the standard features of ApsaraDB products, including emergency response, health diagnostics, performance tuning, dedicated support, and data migration.
Display by Comparison: You can select time points to compare SQL statements based on Resource Usage, Executions, Scanned Rows, and Execution Duration. Detailed comparison results are available in the SQL list area below.
NoteYou can click Settings to select the metrics to display in the list.
Tables/Indexes: You can set filter conditions to query for tables with no traffic and indexes with no traffic.
Disable Performance Insight
Log on to the DAS console.
In the navigation pane on the left, click Intelligent O&M Center > Instance Monitoring.
Find the target instance, click the instance ID, and then go to the instance details page.
In the navigation pane on the left, click Performance Insight.
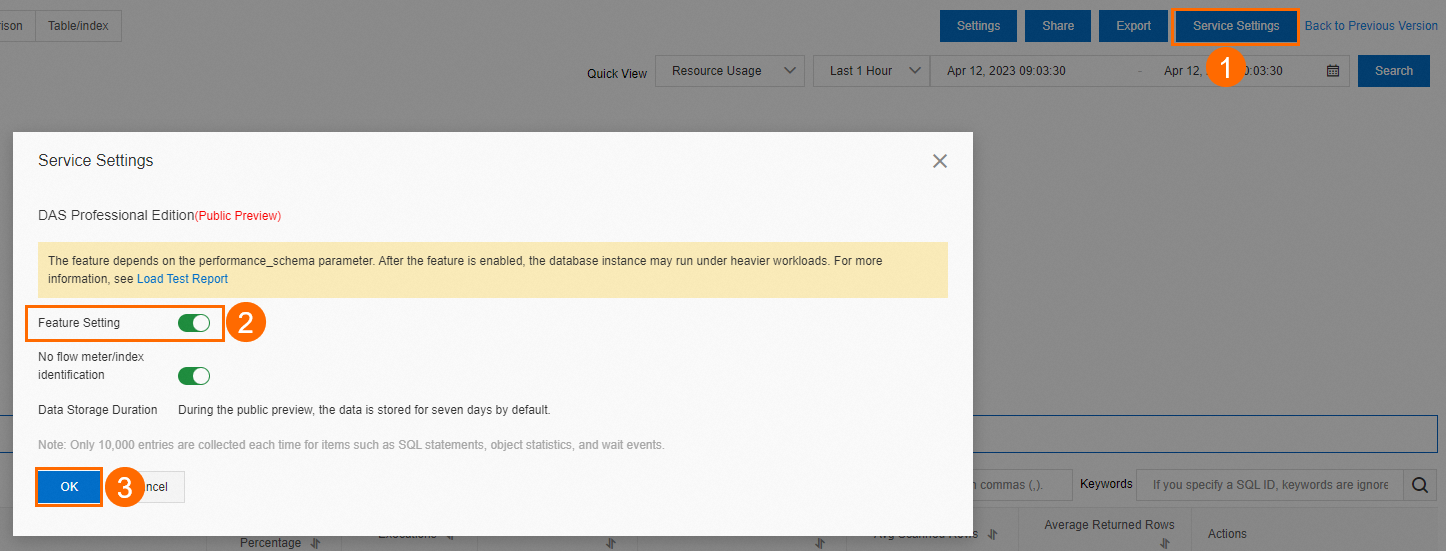
On the Performance Insight tab, click Service Settings. Turn off the Feature Setting and click OK. In the confirmation dialog box, click OK to disable Performance Insight.
Disabling Performance Insight also disables the feature that identifies tables and indexes with no traffic. You can also disable Identification for tables and indexes with no traffic is disabled. separately. If you disable this feature, DAS deletes the data for tables and indexes with no traffic, along with their usage data.
ImportantAfter you disable Performance Insight, DAS stops data ingestion and deletes historical data. This includes data for tables and indexes with no traffic and their usage data.
References
You can enable the autonomy features of DAS to perform automatic administration and resolve database performance issues.