Database Autonomy Service (DAS) provides the Performance Insight (Old Version) feature. You can use its intuitive charts to quickly assess database load, identify the source of performance issues, and improve database stability.
Prerequisites
This feature supports the following database engines:
-
ApsaraDB RDS for MySQL
-
ApsaraDB MyBase for MySQL
-
ApsaraDB RDS for PostgreSQL
-
PolarDB for MySQL
-
PolarDB for PostgreSQL
-
PolarDB for PostgreSQL (Compatible with Oracle)
Notice
DAS now supports Performance Insight (New Version). Building on the capabilities of the old version, the new version uses MySQL's Performance Schema to aggregate SQL information. This allows you to quickly identify metrics for all SQL statements, including Resource Usage, Executions, Scanned Rows, and Execution Duration. You can also throttle and optimize target SQL statements.
Data sources
Performance Insight (Old Version) collects data from the following sources:
-
If Performance Schema is enabled on the target instance, DAS collects and analyzes data directly from Performance Schema.
-
If Performance Schema is not enabled on the target instance, DAS collects and analyzes data from active sessions.
Procedure
Log on to the DAS console.
In the navigation pane on the left, click .
Find the target instance and click the instance ID to open the instance details page.
-
In the left-side navigation pane, click Performance Insight.
-
Click Enable Performance Insight. In the dialog box that appears, click OK to enable Performance Insight.
For ApsaraDB RDS for MySQL and PolarDB for MySQL instances, click Back to Previous Version in the information bar at the top of the DAS page to switch to the old UI and enable Performance Insight. The information bar indicates that you are using DAS Basic Edition. To use the Intelligent Diagnosis and Security Audit features, upgrade to the Professional Edition.
NoteIf you no longer need Performance Insight, click Performance Insight on the Disable Performance Insight page.
-
On the Performance Insight page, select a time range and click Search.
NoteWhen you select a time range, the end time must be later than the start time:
-
You can use Performance Insight to view data for up to seven days within the past month.
-
You can use Average Active Sessions to view session data from the last three days.
-
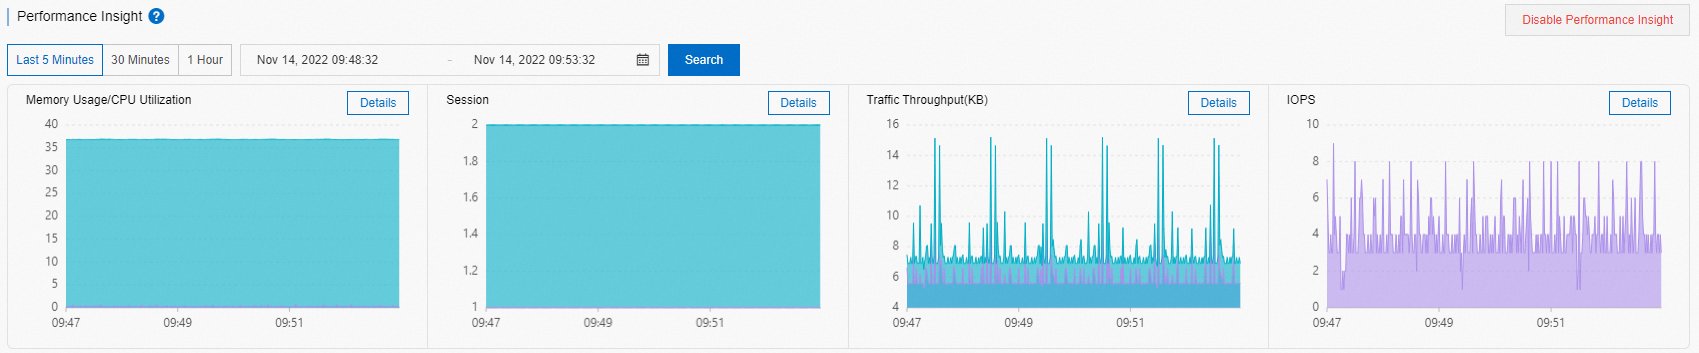
The Performance Insight area displays database performance over the selected period.
To view the details of a specific performance metric, such as Memory Usage/CPU Utilization, click Details next to the metric name.
-
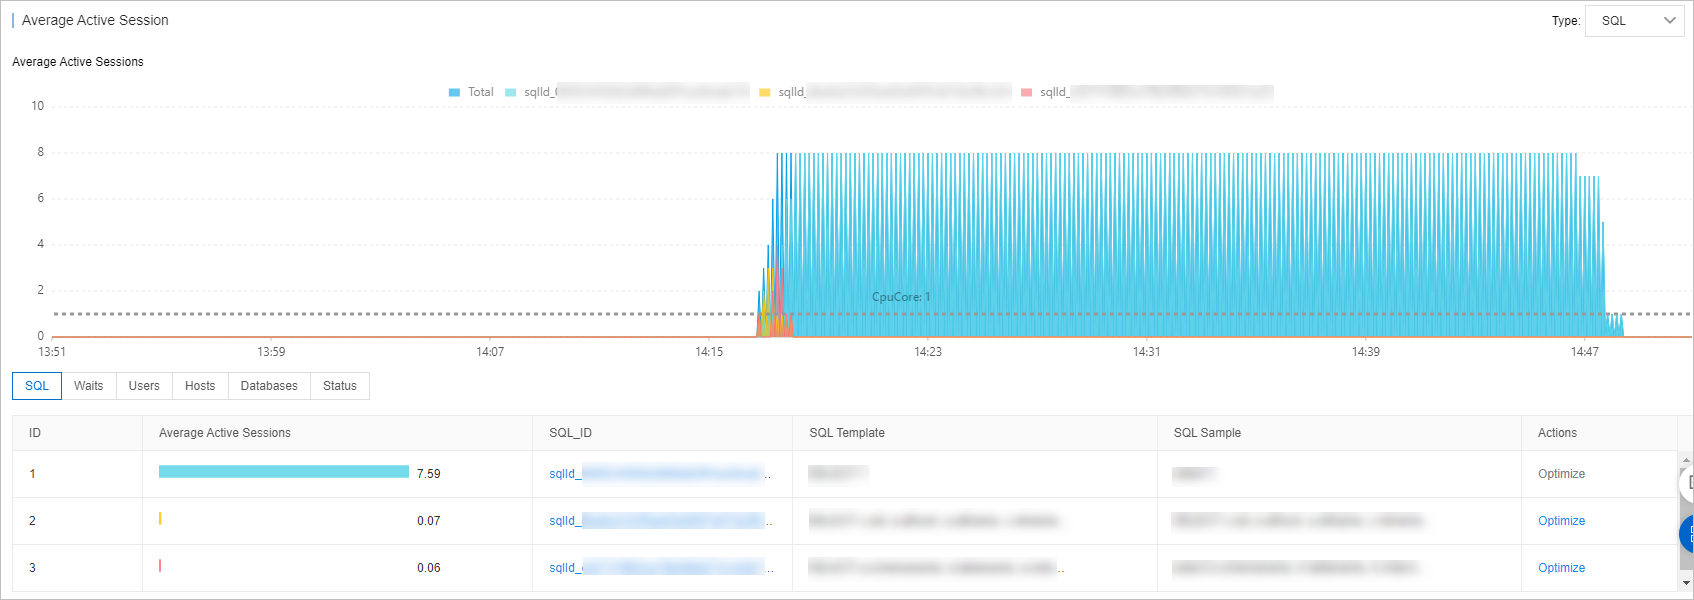
In the Average Active Sessions area, you can view trend charts for different session categories and a multi-dimensional load breakdown to identify the source of performance issues.
In the SQL category, click Optimize in the Actions column to open the SQL Diagnosis Optimization page, which displays the corresponding SQL statement, execution plan, and diagnosis result.
-