Database Autonomy Service (DAS) lets you monitor your database instance's performance metrics and trends in real time, so you can diagnose and fix issues as they happen.
Prerequisites
Before you begin, ensure that you have:
A database instance connected to DAS
The instance in the Normal Access state
Limitations
ApsaraDB for MongoDB standalone instances only: Before you can monitor a standalone instance, you must grant the required permissions to the database account. Complete both steps below.
Step 1: Create an account in the ApsaraDB for MongoDB instance
Connect to the ApsaraDB for MongoDB instance. For more information, see Connect to an ApsaraDB for MongoDB instance.
Run the following commands to create an account for the admin database and grant permissions:
use admin; db.createUser({user:'das_test',pwd:'password',roles:[{role:'readAnyDatabase', db:'admin'}, {role:'clusterMonitor', db:'admin'}, {role: 'hostManager', db: 'admin'},{db: 'local', role: 'dbAdmin'},{db: 'config', role: 'dbAdmin'},{db: 'admin', role: 'dbAdminAnyDatabase'}]});NoteIn this example, the username
das_testand the passwordpasswordare placeholders. Replace them with your actual values.
Step 2: Authorize the account in DAS
Log on to the DAS console.
In the navigation pane on the left, click .
On the Instance Monitoring page, find the database instance and choose Actions > Authorization in the Actions column.
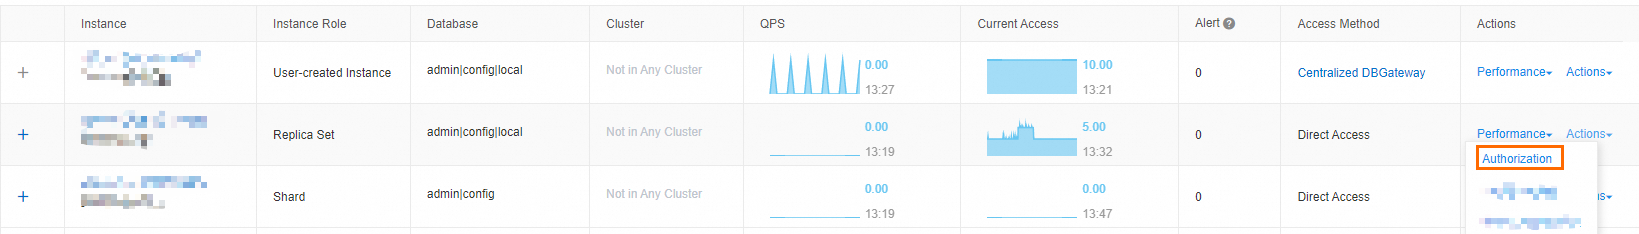
In the Authorization dialog box, configure the Database Account and Password parameters, and then click Authorize.
After the Access Status column displays Connected, click OK.
View real-time performance metrics
Log on to the DAS console.
In the navigation pane on the left, click .
Find the target instance and click the instance ID to open the instance details page.
In the left-side navigation pane, click Real-time Monitoring.
On the Real-time Monitoring page, select a view:
Real-time Charts: view metric trends of the instance in real time.
Mongostat: view performance metrics of the instance at specific points in time.