This topic describes what Full Request is and how to enable Full Request.
Prerequisites
-
This feature is available only for database instances in the China (Shanghai) region.
-
The database instance must have DAS Enterprise Edition enabled. For more information, see Manage DAS audit logs and O&M services (formerly Economy Edition).
Feature overview
When you use a MySQL database, you may encounter the following issues:
-
Difficulty pinpointing historical issues: A CPU usage alert triggers at 3:00 a.m., showing 100% utilization. However, no slow queries were recorded during this period. How do you find the root cause?
-
Difficulty obtaining SQL templates for stress testing: Before a major promotion, database administrators (DBAs) need to collect SQL templates and their execution frequencies from various business teams. This process is inefficient and prone to errors.
-
Uncertainty about which slow queries to prioritize: Not all slow queries require immediate optimization. You need to quickly identify the most resource-intensive SQL statements and optimize them to improve instance stability.
The Full Request feature helps you diagnose SQL performance with the following capabilities:
-
Performance issue analysis: Diagnose SQL health and view the resource consumption, execution count, and execution duration of top SQL statements.
-
SQL templates: Analyze business traffic, perform stress testing, and plan capacity.
-
SQL sample: Query traffic sources and usernames.
Procedure
-
Log on to the DAS console.
-
In the left-side navigation pane, click .
On the SQL explorer page, the Full request trend section contains the Execution duration distribution, Execution duration, and Execution count tabs. You can quickly switch the time range to 15 minutes, 1 hour, 3 hours, or 6 hours. The Full request statistics table includes columns such as SQL ID, SQL statement, database name, IP:Port, table name, average execution duration (ms), execution duration percentage, total execution count, execution count percentage, and execution trend. You can search by SQL ID or keyword.
Note-
Set a time range to View the Full Request Trend chart and the Full Request Statistics table.
-
You can Export Full Request Statistics data, and Export up to 10 million rows of data in a single operation.
-
Reference
-
Execution Time Distribution: The Execution Time Distribution chart shows the distribution of execution durations for all SQL statements in the selected time range.
-
[0,1]ms: the percentage of SQL executions where 0 ms ≤ execution duration ≤ 1 ms. -
(1,2]ms: the percentage of SQL executions where 1 ms < execution duration ≤ 2 ms. -
(2,3]ms: the percentage of SQL executions where 2 ms < execution duration ≤ 3 ms. -
(3,10]ms: the percentage of SQL executions where 3 ms < execution duration ≤ 10 ms. -
(10,100]ms: the percentage of SQL executions where 10 ms < execution duration ≤ 100 ms. -
(0.1,1]s: the percentage of SQL executions where 0.1 s < execution duration ≤ 1 s. -
>1s: the percentage of SQL executions where execution duration > 1 s.
For example:
-
From 10:40:00 on October 19, 2020 to 10:40:00 on November 19, 2020.
-
For this instance, 34.30% of SQL executions are in the [0,1] ms range.
-
23.13% of SQL executions are in the (10,100] ms range.
-
25.98% of SQL executions are in the (0.1,1] s range.
NoteIn the Execution Time Distribution chart, a larger blue area indicates better SQL health. More orange and red areas indicate poorer SQL health.
-
-
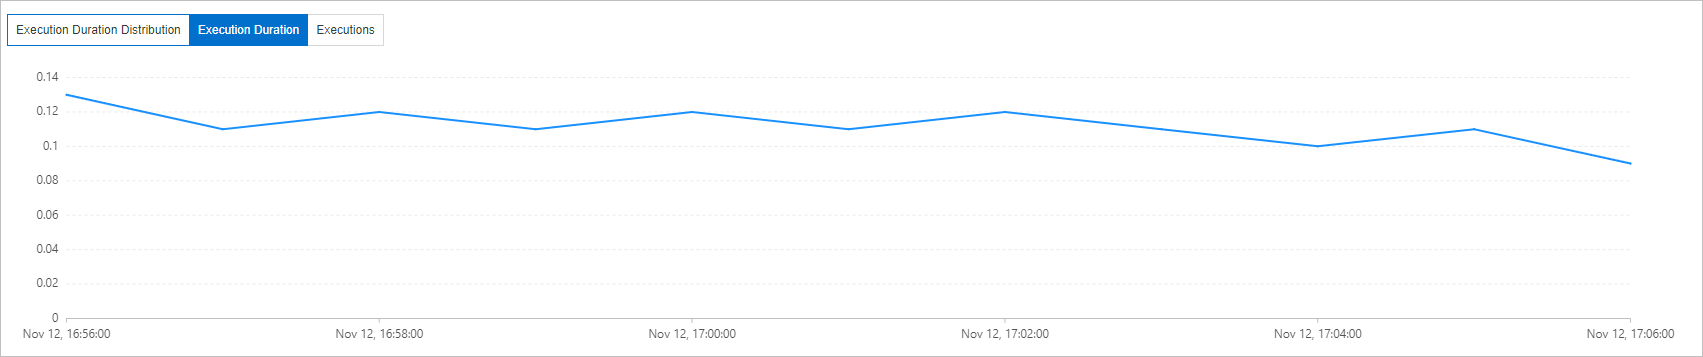
Execution duration (SQL RT): The Execution duration tab shows the execution duration of SQL statements in the selected time range.
-
SQL Queries: The SQL Queries displays details for each SQL template in the selected time range, including the SQL text, execution duration percentage, average execution duration, and execution trend.
NoteThe execution duration percentage is calculated by using the following formula: (Execution duration of the SQL template × execution count) / (Total execution duration of all SQL templates × total execution count) × 100%. An SQL template with a high execution duration percentage consumes more MySQL resources. Optimizing such SQL templates can yield a higher return on investment.
-
SQL ID: Click an SQL ID to view its performance trend and SQL samples.
-
SQL Sample: The SQL Sample tab helps you identify which client application initiated an SQL statement. The SQL sample tab displays a table of individual SQL execution records with columns such as execution time, database name, SQL text, execution duration (ms), rows scanned, rows returned, username, and client IP address.