Database administrators and security teams managing PolarDB for PostgreSQL clusters need full visibility into SQL activity to investigate incidents, support compliance audits, and diagnose performance issues. SQL Explorer and Audit records every database operation and provides search, export, and analysis tools so you can act on that data without leaving the Database Autonomy Service (DAS) console.
SQL Explorer and Audit for PolarDB for PostgreSQL clusters is available from February 24, 2023.
What you can do
| Capability | Description |
|---|---|
| SQL audit logging | Record all operations performed on your databases. Use the logs for fault analysis, behavior analysis, and security audit. |
| Enhanced search | Query audit logs by database, user, client IP address, thread ID, execution duration, or number of scanned rows. Export and download the results. |
| SQL analysis | Explore audit logs interactively with visualizations. Identify SQL statements that behave unexpectedly and troubleshoot performance issues within any time window. |
Prerequisites
Before you begin, ensure that you have:
A PolarDB for PostgreSQL cluster
Enable SQL Explorer and Audit
Log on to the DAS console.
In the left-side navigation pane, click Instance Monitoring.
Find the cluster you want to manage and click its instance ID.
In the left-side navigation pane, choose Request Analysis > SQL Explorer and Audit.
Click Enable Enterprise EditionV3.
In the Configure DAS Enterprise Edition step, select the features you want to enable, set the storage duration for SQL logs, and click Submit.
Modify the storage duration of SQL audit logs
Log on to the DAS console.
In the left-side navigation pane, click Instance Monitoring.
Find the cluster you want to manage and click its instance ID.
In the left-side navigation pane, choose Request Analysis > SQL Explorer and Audit.
Click Service Settings. In the panel that appears, update the storage duration and click Submit.
Export SQL audit logs
Log on to the DAS console.
In the left-side navigation pane, click Instance Monitoring.
Find the cluster you want to manage and click its instance ID.
In the left-side navigation pane, choose Request Analysis > SQL Explorer and Audit.
Click the Audit tab.
In the Logs section, click Export.
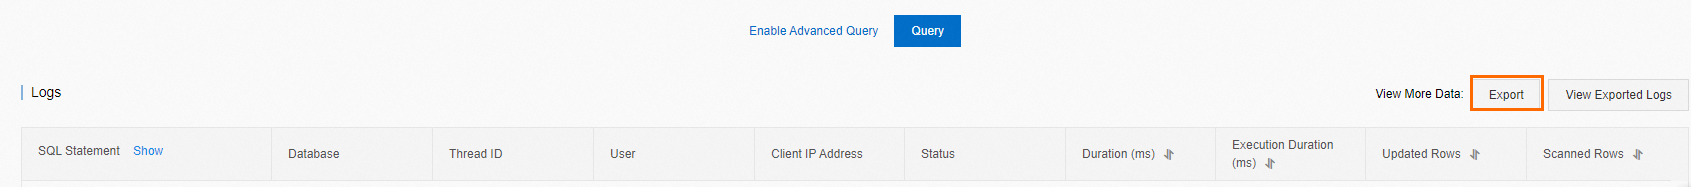
Set the Exported Fields and Export Time Range, then click OK.
Enter a Task name, set the CSV Separator, and click Confirm. The system creates an export task. Click Task list in the upper-right corner of the page to track progress and download the exported file.
Disable SQL Explorer and Audit
After you disable SQL Explorer and Audit, your business is not affected. However, SQL audit logs are cleared. Export and download your logs before disabling the feature. After you re-enable the feature, audit logs are generated only from that point forward.
Log on to the DAS console.
In the left-side navigation pane, click Instance Monitoring.
Find the cluster you want to manage and click its instance ID.
In the left-side navigation pane, choose Request Analysis > SQL Explorer and Audit.
Export your SQL audit logs. For details, see Export SQL audit logs.
Click Service Settings. In the Service Settings panel, clear all selected features and click Submit.
Storage space used by SQL Explorer and Audit is released one hour after you disable the feature.
View audit log size and billing details
Audit log storage is billed under the sql_explorer billing item. To check how much storage your cluster is consuming and its associated cost:
Log on to the Alibaba Cloud Management Console.
In the upper-right corner, click Expenses.
In the left-side navigation pane of the Expenses and Costs page, choose Bills > Bill Details.In the left-side navigation pane of the Expenses and Costs page, choose .
On the Bill Details page, click the Billing Details tab. In the search bar, select Instance ID from the drop-down list and enter the ID of your cluster.On the Bill Details page, click the Billing Details tab. In the search bar, select Instance ID from the drop-down list and enter the ID of the cluster for which you want to query the details.
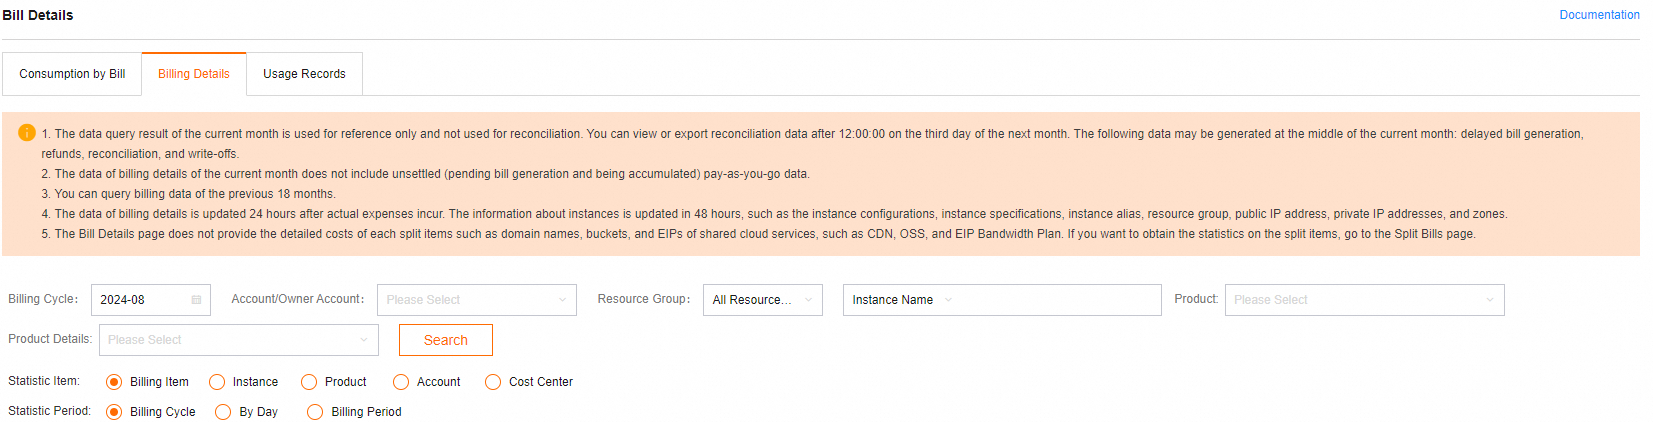
Review the entries where the Billing Item value is sql_explorer.