The real-time monitoring dashboard in Database Autonomy Service (DAS) gives you a unified view of performance metrics across all connected database instances, updated automatically. Use it during business peak hours or major changes to spot unhealthy instances before they impact users.
Example scenario: Your e-commerce platform is running a flash sale. Traffic spikes across dozens of database instances. Open the real-time monitoring dashboard to identify which instances show abnormal metrics, then drill down into a specific instance to investigate.
What the dashboard shows
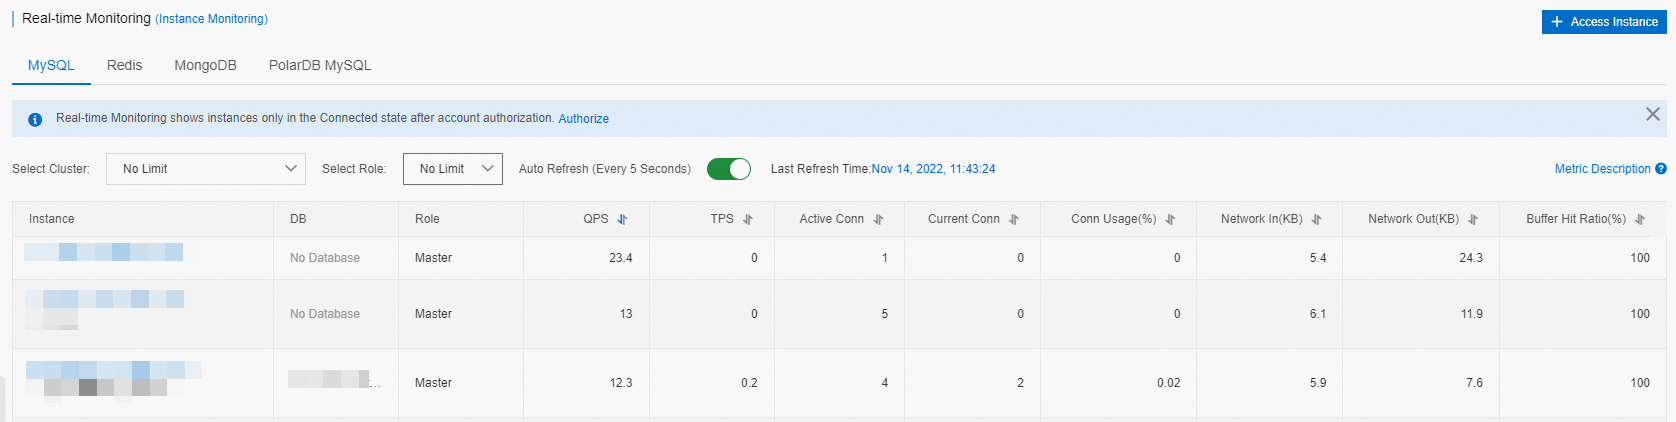
The real-time monitoring dashboard displays performance metrics for all database instances in Normal Access state. Data refreshes automatically.
| Capability | Details |
|---|---|
| Database type tabs | Switch between tabs to view instances by database engine (for example, MySQL). Each tab shows the performance metrics for that engine type. |
| Per-instance metrics | View key performance indicators for each instance in real time. Click Metric Description in the upper-right corner of a tab to see what each metric measures. |
| Cluster view | If you have grouped instances into clusters using cluster management, select a cluster from the Select Cluster drop-down list to filter the view to that group. |
View the real-time monitoring dashboard
Log on to the DAS console.
In the left-side navigation pane, click Real-time Monitoring Dashboard.
On the Real-time Monitoring page, select the database type you want to view. The tab displays real-time performance metrics for each instance of that type.
Optional: To view metric descriptions, click Metric Description in the upper-right corner of the tab.
Optional: To filter by cluster, select a cluster from the Select Cluster drop-down list.
What's next
To group database instances by engine type, see Manage clusters.