Group instances by their database engine, such as MySQL, to view cluster-level performance trends, slow query log trends, and storage rankings.
Supported engines
-
MySQL
-
Redis
-
MongoDB
-
PostgreSQL
-
RDS SQL Server
-
PolarDB for MySQL
-
PolarDB for PostgreSQL
-
PolarDB for PostgreSQL (Compatible with Oracle)
-
PolarDB-X 2.0
-
MySQL, Redis, MongoDB, and PostgreSQL instances can be either Alibaba Cloud databases or self-managed databases.
-
Each database instance can belong to only one cluster.
Procedure
Log on to the DAS console.
-
In the left-side navigation pane, choose Resource Management > Clusters.
-
In the upper-right corner of the Clusters page, click Add Cluster.
-
In the Add Cluster dialog box, enter the cluster configuration information, add the database instances, and click Save. In the instance selection area, select the target instance from the Available Instances list on the left, click the right arrow button to move it to the Selected Instances list on the right, and then click Save.
Parameter
Description
Cluster name
Enter a name for the new cluster.
Select environment
Select an environment for the cluster:
-
Development Environment
-
Test Environment
-
Production Environment
Select engine
Select a database engine that supports cluster management.
Cluster description
Enter a description for the cluster.
-
-
In the Actions column on the right side of the cluster list page, you can perform the following actions:
-
Edit: Modify the cluster's settings, such as its environment and description.
-
Delete: Remove the target cluster from the cluster list.
-
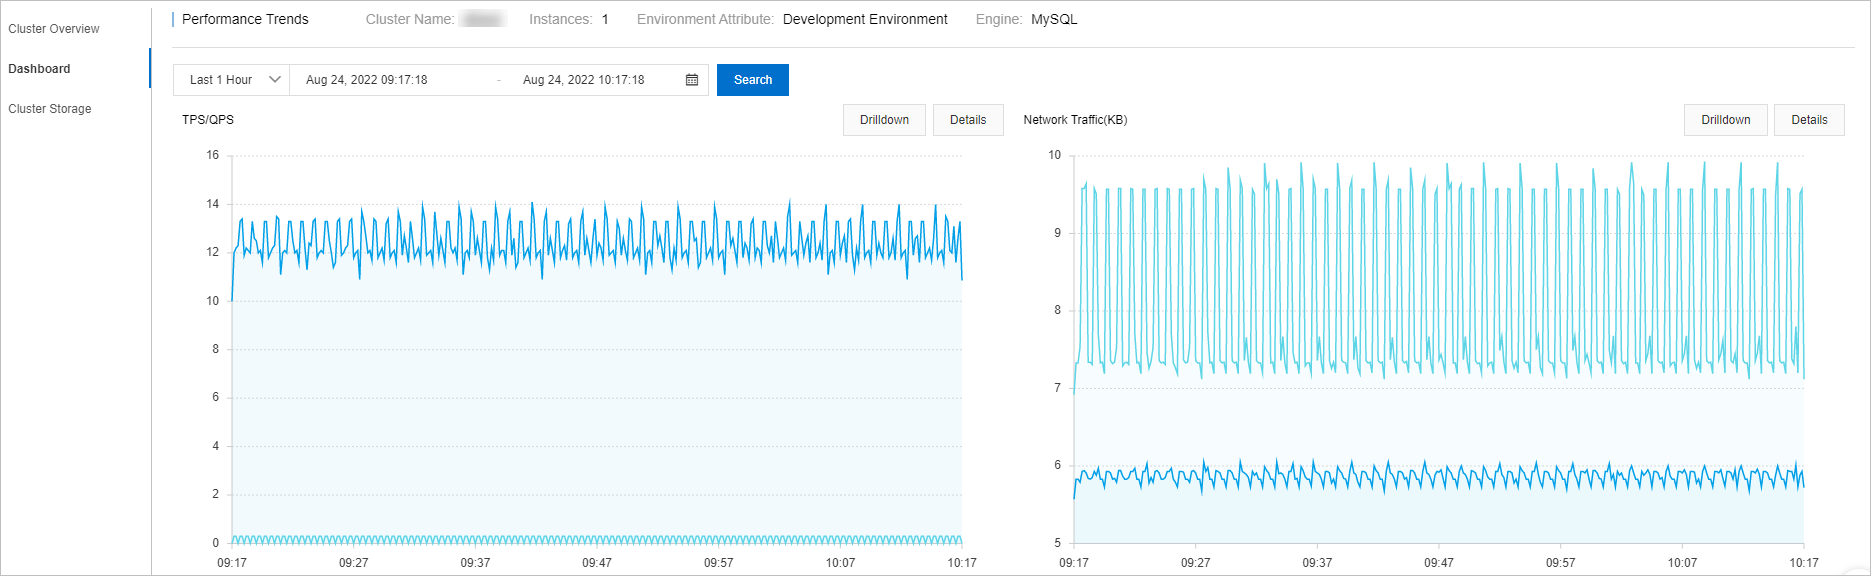
Monitor: View the cluster's Cluster Overview, Performance Trends, and Cluster Storage.
-