Performance insight analyzes SQL workload composition by aggregating statement statistics from MySQL's Performance Schema. Use it to identify which queries consume the most resources, drill into execution trends, and take direct action — throttle or optimize — without leaving the DAS console.
This feature is in public preview and is free to use during the preview period.
Prerequisites
Before you begin, make sure that:
The database instance is one of the following types:
ApsaraDB RDS for MySQL (Basic Edition and V5.5 are not supported)
ApsaraDB MyBase for MySQL
The instance has at least 8 GB of memory.
Performance Schema is enabled on the instance. See Enable the Performance Schema feature.
The instance is in one of the following regions: China (Hangzhou), China (Shanghai), China (Qingdao), China (Beijing), China (Zhangjiakou), China (Shenzhen), China (Chengdu), China (Hong Kong), Singapore, Malaysia (Kuala Lumpur), or Indonesia (Jakarta).
What you can do with Performance insight
Performance insight gives you three complementary views of database workload:
| View | What it shows | When to use it |
|---|---|---|
| Display by Time Range | Resource Usage, Executions, Scanned Rows, and Execution Duration trends for all SQL statements over a selected period | Investigating a known incident window or monitoring ongoing workload |
| Display by Comparison | Side-by-side metric comparison between two points in time | Determining whether a deployment or configuration change affected query behavior |
| Tables/Indexes | Statistics on tables and indexes with no read or write traffic | Identifying unused schema objects before a cleanup or migration |
Within each view, you can drill into individual SQL statements to see execution trends, SQL samples, and — when needed — apply throttling or get optimization suggestions.
How it works
Performance insight collects SQL statement statistics from MySQL's Performance Schema and aggregates them into trend charts and ranked lists. DAS scans tables and indexes every morning to track which objects have had no traffic and records the number of consecutive idle days.
If Performance Schema is not yet enabled on the instance, enabling it does require a restart — plan that step during off-peak hours and make sure your application can automatically reconnect.
New version vs. original version
The new version adds cross-period comparison, SQL-level throttling, and no-traffic table and index tracking. The original version supports a broader set of database engines.
| New version | Original version | |
|---|---|---|
| Metrics | Resource Usage, Executions, Scanned Rows, Execution Duration, Executions/Errors, Scanned Rows/Updated Rows/Returned Rows, Logic Read, Physical Reads, Average Execution Duration/AvLock Duration, Number of Created Temporary Tables/Number of Created Temporary Disk Tables, Number of Sorted Rows, Select_Scan/Select_Range/Full Join/Full Range Join/Sort_Scan/Sort_Range, Top 5 SQL Trends | Memory Usage/CPU Utilization, Session, Traffic Throughput, IOPS; active session trends and multidimensional load breakdowns |
| Displayed details | Trends and SQL details for a selected period; cross-period comparison; SQL ID and keyword search; no-traffic table and index statistics | Trends and SQL details for a selected period |
| Actions | Throttling and optimization | Optimization only |
| Supported engines | ApsaraDB RDS for MySQL, PolarDB for MySQL, ApsaraDB MyBase for MySQL | ApsaraDB RDS for MySQL, ApsaraDB RDS for PostgreSQL, PolarDB for MySQL, PolarDB for PostgreSQL, ApsaraDB MyBase for MySQL, PolarDB for PostgreSQL (Compatible with Oracle) |
Enable Performance insight
Log on to the DAS console.
In the left-side navigation pane, click Instance Monitoring.
Find the database instance you want to manage and click its instance ID.
In the left-side navigation pane, click Performance Insight.
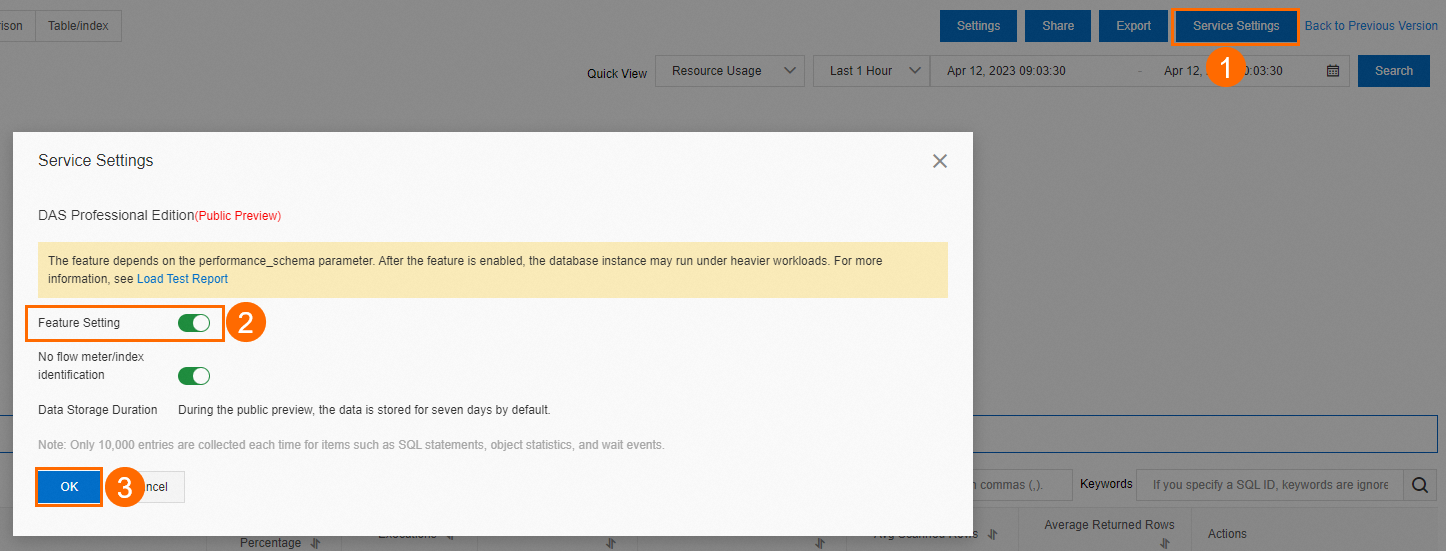
On the Performance Insight tab, click Enable Performance Insight. If Performance Schema is disabled, the Parameter Settings dialog box appears. Click Configure to enable it. When Performance insight is enabled, DAS automatically enables the no-traffic table and index identification feature.
WarningEnabling Performance Schema requires restarting the database instance. Perform this step during off-peak hours and make sure your application can automatically reconnect.
ImportantFrom April 11, 2023 onward, the no-traffic identification feature is automatically enabled with Performance insight. If you enabled Performance insight before April 11, 2023, manually enable Identification for Tables and Indexes with No Traffic in the Service Settings dialog box.
Analyze SQL workload
After enabling Performance insight, use the tabs on the Performance Insight tab to investigate your workload.
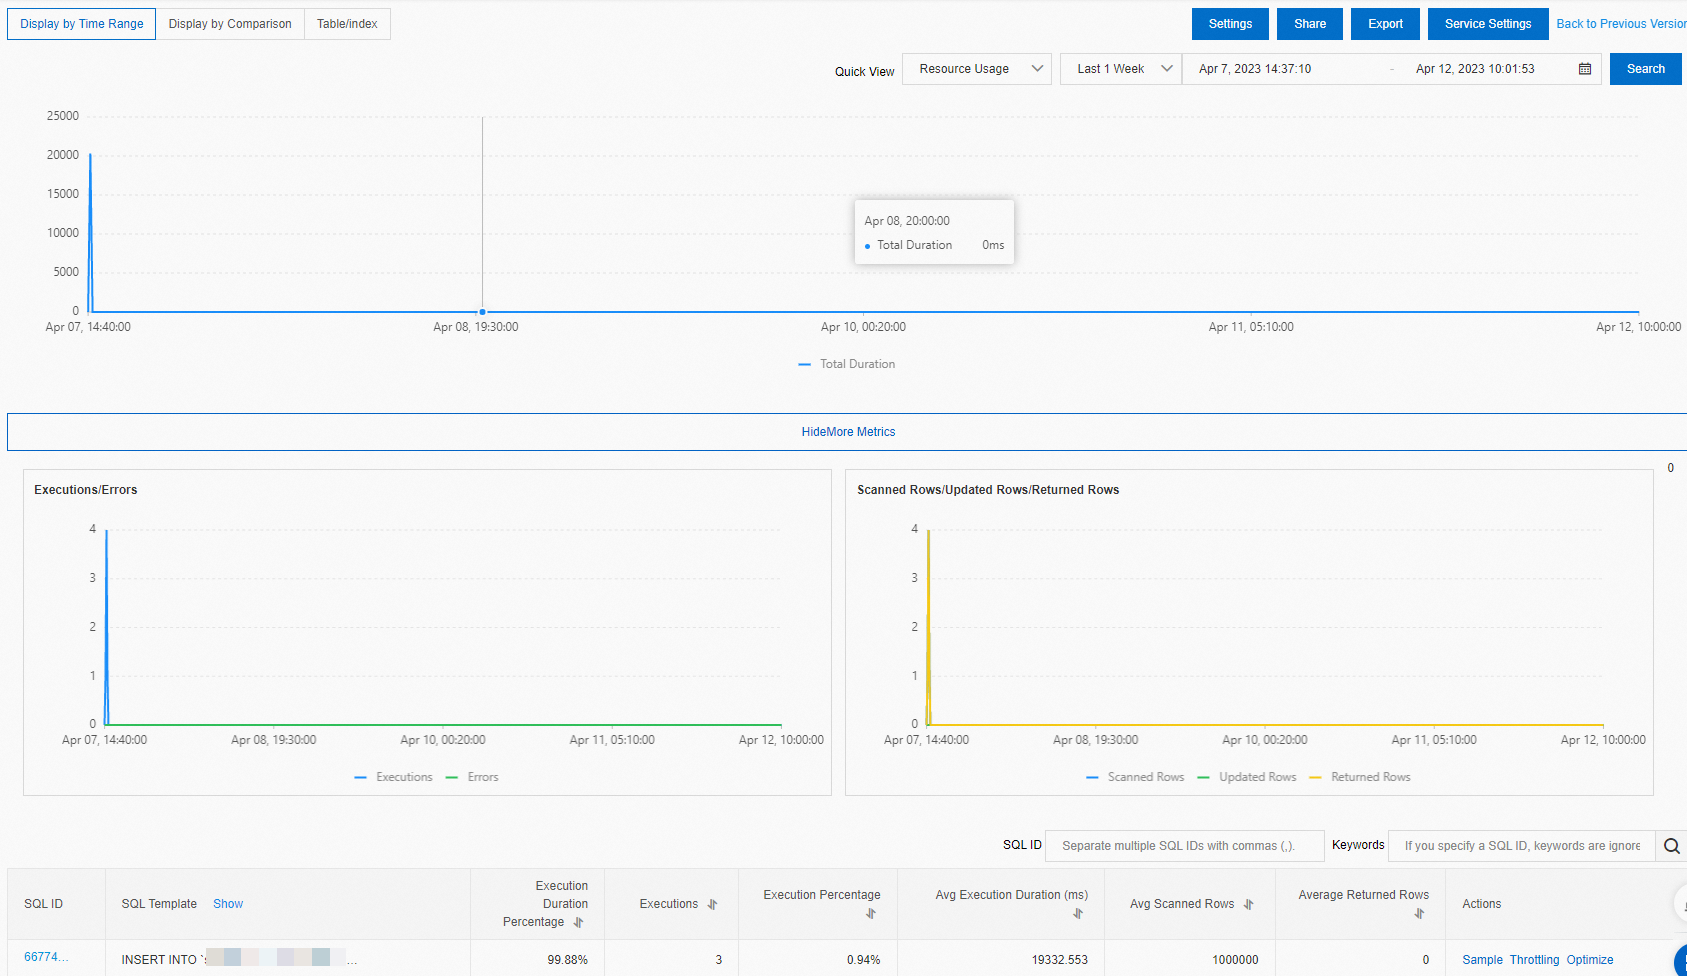
Display by Time Range
Select a time range to view the Resource Usage, Executions, Scanned Rows, and Execution Duration trend charts for all SQL statements in that window.
The end time must be later than the start time. The maximum query range is 7 days within the last month.
Click Export to save the data to your computer.
Click ShowMore Metrics to view additional performance metric trend charts. Click Settings to choose which metrics appear.
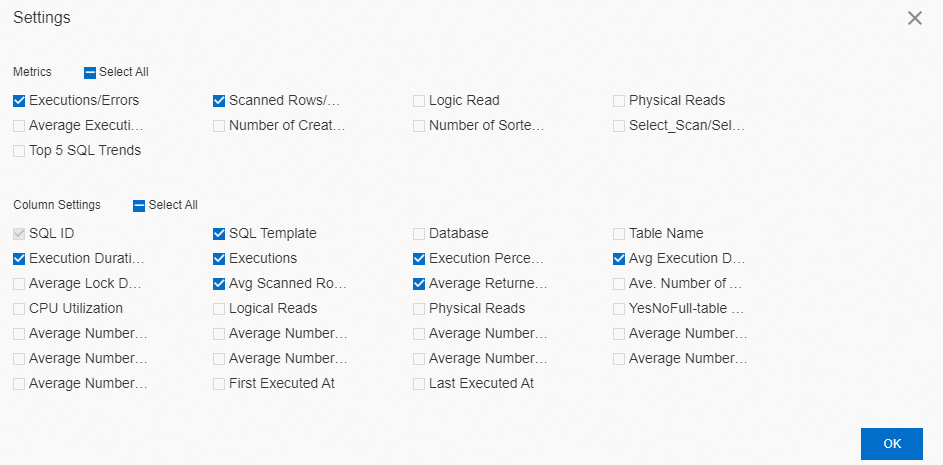
The SQL list below the charts ranks statements by the selected metric. To customize which columns appear, click Settings and select metrics in the Column Settings section.
Choosing the right metric for your investigation:
| Metric | What it reveals | When to use it |
|---|---|---|
| Resource Usage | Queries consuming the most combined database resources | Start here for general performance problems |
| Executions | Most frequently called statements | High-execution statements with modest per-call cost can still dominate workload |
| Scanned Rows | Full-table scans and poorly filtered queries | Focus here when CPU or I/O is elevated |
| Execution Duration (Max) | Slowest single executions — outlier spikes | Investigating latency spikes |
| Execution Duration (Avg) | Consistently slow queries across all executions | Identifying chronic slowness rather than one-off spikes |
From the SQL list, you can take the following actions on a specific statement:
View details: Click the SQL ID to see Resource Usage, Executions, Scanned Rows, and Execution Duration trend charts for that statement, along with its SQL samples.
View samples: Click Sample in the Actions column to inspect the SQL samples for the statement.
Throttle: Click Throttling in the Actions column. In the SQL Throttling dialog box, configure throttling parameters to limit the statement's execution rate. See SQL throttling.
Optimize: Click Optimize in the Actions column. The SQL Diagnostic Optimization dialog box shows diagnostic results based on the statement's complexity, table data volume, and current database load. DAS returns optimization suggestions with expected optimization benefits. To get expert assistance, click Database Expert Service to purchase professional database services, including emergency assistance, health diagnostics, performance optimization, security assurance, and data migration.
NoteDiagnostics can take more than 20 seconds to complete. After analysis, DAS returns diagnostic results, optimization suggestions, and expected optimization benefits. Review the results and decide whether to apply them. If you accept the suggestions, click Copy in the upper-right corner and run the optimized SQL in your database client or in Data Management (DMS). To close without applying, click Cancel.
Display by Comparison
Select a point in time to compare SQL statement metrics — Resource Usage, Executions, Scanned Rows, and Execution Duration — against that reference point. You can also view the detailed comparison results in the SQL list section.
Click Settings to choose which metrics appear in the comparison list.
Tables/Indexes
Set filter conditions to query statistics on tables and indexes with no read or write traffic. Results appear in the Tables with No Traffic and Indexes with No Traffic sections.
Click Export to save the filtered results to your computer.
Disable Performance insight
Log on to the DAS console.
In the left-side navigation pane, click Instance Monitoring.
Find the database instance you want to manage and click its instance ID.
In the left-side navigation pane, click Performance Insight.
Click Service Settings. In the Service Settings dialog box, turn off Feature Setting and click OK. In the confirmation message, click OK.
Disabling Performance insight also disables no-traffic table and index identification. To turn off only the identification feature while keeping Performance insight active, turn off Identification for tables and indexes with no traffic is disabled in the Service Settings dialog box.
After Performance insight is disabled, DAS stops collecting data and permanently deletes all historical data — including statistics on both no-traffic and active tables and indexes.