In daily database operations and maintenance, you can gain timely and comprehensive insights into database performance issues and related maintenance activities by viewing performance events (such as exception events, optimization events, auto scaling events, etc.) that are scheduled, in progress, or completed within the database instance. This article introduces how to use the Performance Center feature of Database Autonomy Service (DAS) to view various performance events of database instances in real time.
Before you start
The database instance must meet the following requirements:
The database instance is connected to DAS. For details, see Connect an Alibaba Cloud database instance to DAS.
Supported database instances include:
ApsaraDB RDS for MySQL
ApsaraDB MyBase for MySQL
ApsaraDB RDS for PostgreSQL
Tair (Redis OSS-compatible)
PolarDB for MySQL Cluster Edition
View events and suggestions
Log on to the DAS console.
In the left-side navigation pane, choose Intelligent O&M Center > Event Center.
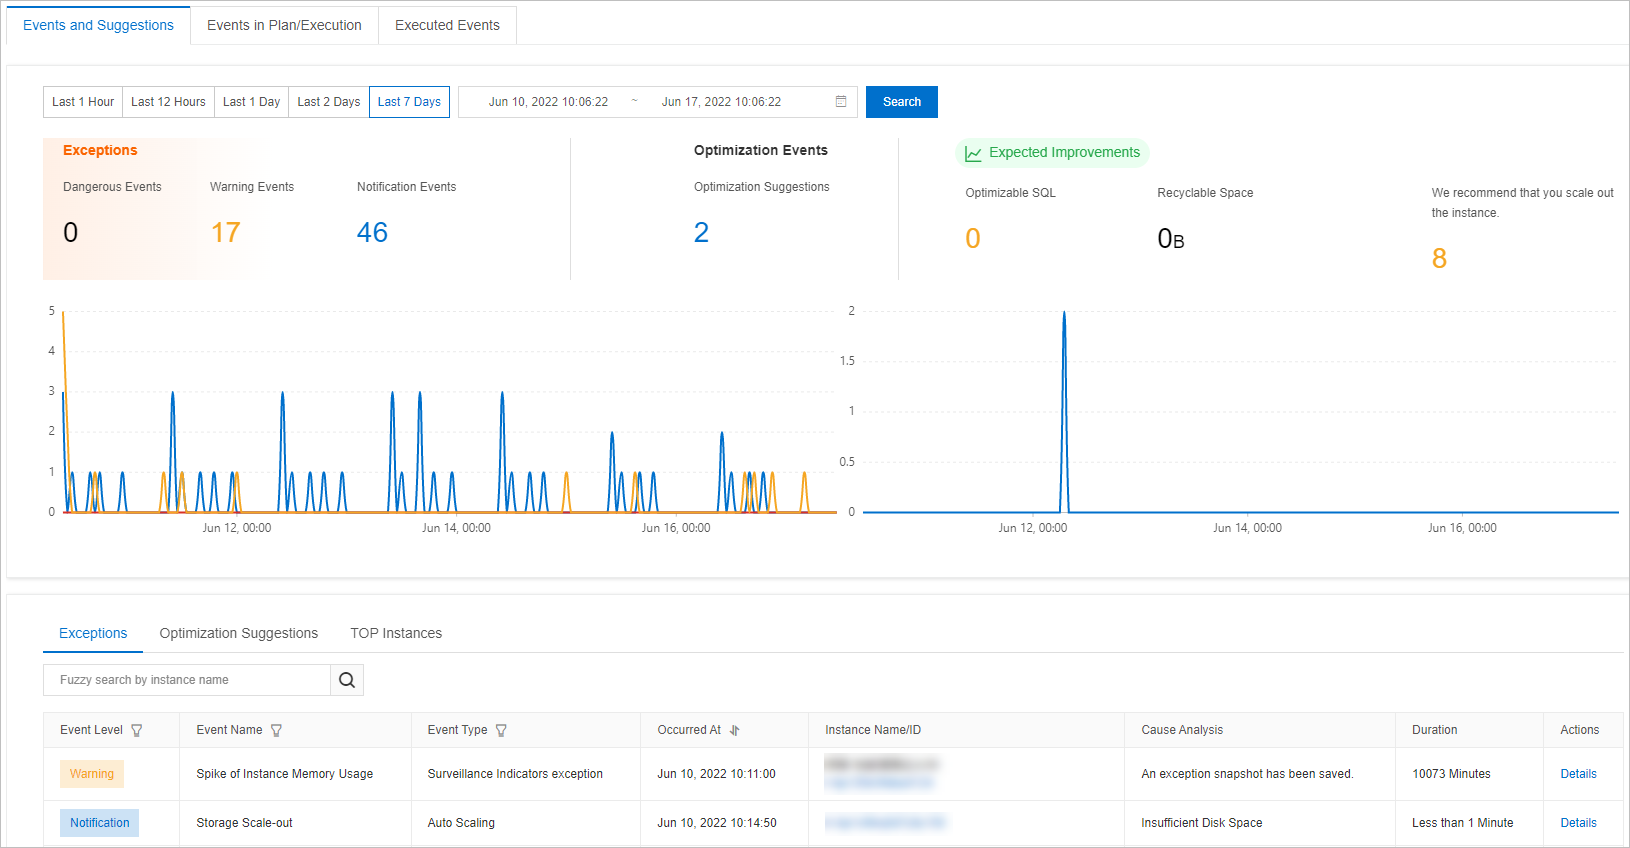
On the Event Center page, click the Events and Suggestions tab to view the statistics and trend charts of events within the selected time range.
 Note
NoteWhen you select a time range, the end time must be later than the start time, and the interval between the start time and the end time cannot exceed 7 days.
On the Exceptions tab, view the statistics of exceptions.
On the Optimization Suggestions tab, view the statistics of optimization events.
On the Top Instances tab, view the statistics of database instances sorted by the number of events.
You can filter events by Event Level, Event Name, or Event Type.
Click the ID of a database instance or click Details in the Actions column corresponding to the database instance to go to the autonomy center of the database instance and view the event details.
View events in plan/execution
Log on to the DAS console.
In the left-side navigation pane, choose Intelligent O&M Center > Event Center.
On the Event Center page, click the Events in Plan/Execution tab to view the events that are planned for execution and events that are being executed.
You can filter events by Event Level to find the event that you want to manage.
Click the ID of a database instance or click Details in the Actions column corresponding to the database instance to go to the autonomy center of the database instance and view the event details.
View executed events
Log on to the DAS console.
In the left-side navigation pane, choose Intelligent O&M Center > Event Center.
On the Event Center page, click the Executed Events tab to view the execution results of events within a specific time range.
NoteWhen you select a time range, the end time must be later than the start time, and the interval between the start time and the end time cannot exceed seven days.
ImportantThe retention period for events is 30 days.
You can filter events by Event Level to find the event that you want to manage.
Click the ID of a database instance or click Details in the Actions column corresponding to the database instance to go to the autonomy center of the database instance and view the event details.
What to do next
You can enable the event subscription feature for your database instance. When related events are detected on the database instance, the system sends you notifications based on the notification method that you specify. For more information, see Event subscription.
On the Autonomy Center tab of a database instance, you can view the details of events.