DAS Agent is an intelligent database operations and maintenance (O&M) solution powered by a large language model. It leverages insights from over 100,000 Alibaba Cloud tickets and extensive expertise to resolve common O&M and stability issues for cloud databases. By integrating AI, DAS Agent provides end-to-end autonomous capabilities, including anomaly detection, diagnostics, and optimization, ensuring the stability and efficiency of your cloud databases with high precision.
DAS Agent is the only database operations skill selected for the official Alibaba Cloud skill market, certified for its effectiveness and security. You can download the skill and deploy it to a local agent or different types of Claw.
Prerequisites
The target database must be connected to DAS.
DAS supports the following databases:
MySQL: RDS for MySQL, PolarDB for MySQL, MySQL from other cloud providers, and on-premises MySQL.
PostgreSQL: RDS for PostgreSQL, PolarDB for PostgreSQL, PostgreSQL from other cloud providers, and on-premises PostgreSQL.
Redis: Tair, Redis from other cloud providers, and on-premises Redis.
MongoDB: ApsaraDB for MongoDB, MongoDB from other cloud providers, and on-premises MongoDB.
SQL Server: RDS for SQL Server.
Distributed database: PolarDB-X.
Notes
To use DAS Agent with a RAM user (sub-account), ensure the RAM user has management permissions for DAS and the corresponding database instance.
To integrate the intelligent O&M capabilities of DAS Agent with business systems or consoles other than the DAS console, submit a ticket.
Because data security regulations vary by region, a single large model service cannot manage database instances across multiple regions. Therefore, you must enable DAS Agent in each region where your instances are located. For example, instances within the Chinese mainland (such as those in Beijing, Shanghai, China (Hangzhou), and Guangzhou) can share a single DAS Agent for the China region, while instances in other regions, such as the United States, Singapore, and Indonesia, require a separate DAS Agent in each.
DAS Agent for regions outside the Chinese mainland uses the Model Studio large model, which is currently deployed only in Singapore and the United States. Therefore, DAS routes model calls to the nearer of these two regions. When Model Studio is launched in more countries or regions, DAS Agent will automatically migrate to the local Model Studio service.
Note: This cross-border call routing applies only to the Model Studio model. Your data, including database audit logs, always remains within the Region where the instance resides.
Billing
For more information, see DAS Agent pricing details.
Starting March 17, 2026, DAS Agent offers a daily free trial.
Base quota: Each user receives a daily free quota of 5,000 characters. To continue using the service after the quota is exhausted, upgrade to the commercial version.
Check-in bonus: Check in daily by viewing or querying the operations daily report in the console. Each successful check-in grants an additional quota of 700 characters. By checking in for seven consecutive days, you can earn a cumulative bonus of 4,900 characters.
Quota status: You can check your remaining daily quota and usage details at any time in the console.
Note: The free quota policy is subject to change based on operational needs. We recommend starting your free trial soon to take full advantage of the current offer.
Features
Feature | Status | Description |
database knowledge Q&A | Supported | This knowledge base supplements general database knowledge with internal documentation curated by Alibaba Cloud experts. It covers major online transaction processing (OLTP) and NoSQL engine types, offering guidance on exception handling, scaling, and change impact analysis. |
database anomaly diagnosis | Supported | Covers various scenarios for online transaction processing (OLTP) and NoSQL, including metric and anomaly queries, real-time diagnostics (CPU, memory, and sessions), lock analysis, latency insights (Tair), large key analysis (Tair), slow SQL analysis (OLTP and MongoDB), SQL optimization (with pre-flight checks for unexecuted SQL), and database security risk detection. The DAS Agent analyzes issues to identify root causes, providing optimization recommendations and immediate remediation suggestions. Note Currently, you must manually apply suggestions. Automatic execution of recommendations by the large model is not yet available. |
automated O&M reporting | Supported | Generates unified O&M reports for multiple instances (including cross-engine instances) in your account. These reports include metric trend comparisons, optimization recommendations, and monitoring suggestions. Note Currently, only daily reports are supported. Support for weekly and monthly reports, as well as customizable report templates, will be added in the future. |
anomaly detection and alerting | Not supported | Will detect and predict anomalies based on performance metrics and trigger alerts. |
Supported skills
Scenario/function | Description | Cloud instances | On-premises/other clouds | Parameters | API query |
Real-time CPU diagnosis (MySQL) | Diagnoses the cause of abnormal CPU utilization by collecting real-time data. |
| Not supported | • Instance ID |
|
Real-time CPU diagnosis (Tair/Redis) | Diagnoses abnormal CPU usage for ApsaraDB for Tair (Redis-compatible) instances by analyzing real-time session data, large keys, and hot keys. |
| Not supported | • Instance ID |
|
CPU utilization diagnosis (MySQL) | Diagnoses abnormal CPU utilization by analyzing sessions, slow logs, and SQL Explorer data from the database instance within a specified time range. |
| Not supported | • Instance ID |
|
SQL diagnosis and optimization | Analyzes SQL statements in a specified database to identify performance issues and provide optimization suggestions based on the engine type, version, table structure, indexes, and execution plan. It also supports pre-flight checks for unreleased SQL. |
| Supports MySQL and PostgreSQL engines. | • Instance ID |
|
Slow log analysis (TP) | Identifies problematic SQL from slow log statistics and provides optimization suggestions. |
| Not supported | • Instance ID |
|
Slow log analysis (MongoDB) | Identifies problematic query templates from MongoDB slow log statistics, recommends specific QueryIDs for review, and provides remediation suggestions. |
| Not supported | • Instance ID |
|
Monitoring metrics query | Queries database instance metrics such as CPU utilization, memory usage, and storage space usage. |
| Not supported | • Instance ID |
|
Key performance metrics summary | Queries and summarizes key performance metrics for an instance within a specified time range. Select a short time range to avoid query failures due to excessive data volume. |
| Not supported | • Instance ID |
|
Recent deadlock analysis | Analyzes the latest deadlock log from the output of the |
| Supports MySQL. | • Instance ID |
|
Metadata lock and transaction blocking analysis | Analyzes metadata locks and transaction blocking in the current session. For transaction blocking analysis, Performance Schema must be enabled for RDS MySQL 8.0 and PolarDB for MySQL 8.0 instances. |
| Not supported | • Instance ID |
|
Space analysis | Queries database and table information for an instance, provides an overview of database and table space, lists items that require optimization, and shows detailed information. |
| Supports MySQL and PostgreSQL engines. | • Instance ID |
|
SQL Server storage space analysis | Queries the storage space usage of a SQL Server instance and analyzes storage space anomalies. |
| Not supported | Instance ID |
|
Latency insight analysis (Tair/Redis) | Analyzes latency insight data from an ApsaraDB for Tair (Redis-compatible) instance by examining latency data from its proxy and data nodes to identify commands or nodes with high latency. |
| Not supported | • Instance ID |
|
Large key query and analysis | Analyzes historical large keys in an ApsaraDB for Tair (Redis-compatible) instance and identifies related hot keys. |
| Not supported | • Instance ID |
|
Abnormal session identification | Analyzes abnormal sessions by querying |
| Supports MySQL. | • Instance ID |
|
Memory anomaly diagnosis (MySQL) | Diagnoses memory usage anomalies in a database instance. If an anomaly is detected, this function investigates its cause. Otherwise, it alerts you to potential memory-related risks. |
| Not supported | • Instance ID |
|
Memory anomaly identification (MySQL) | Identifies abnormal memory usage in a database instance. If an anomaly or a prolonged high watermark is detected, it provides common causes. |
| Not supported | • Instance ID |
|
HA query and analysis | Queries and analyzes primary/standby switchover records for an RDS MySQL instance and generates a concise report. |
| Not supported | • Instance ID |
|
Auto-increment ID overflow risk analysis | Analyzes table auto-increment ID usage to identify overflow risks. |
| Not supported | • Instance ID (Optional) |
|
Error log analysis | Analyzes deadlock, Warning, and Error level entries in the database instance's error log, and returns detailed deadlock information and the cause of the error entries. Important
|
| Not supported | • Instance ID |
|
Overview of instances to be optimized | Lists database instances under your Alibaba Cloud account that may require optimization. This includes instances with recent load changes, CPU or I/O spikes, high IOPS, sudden memory increases, or an abnormal number of slow logs. |
| Not supported | Time range (start_time and end_time) |
|
Instance information query | Queries information about database instances under the current Alibaba Cloud account, including engine type, engine version, instance ID, instance alias, region, and status. The results can be filtered by database engine type or keyword. |
| Supports MySQL, PostgreSQL, Redis, and MongoDB engines. | • Engine type |
|
Instance topology query | Queries the topology of a database instance and the details of each node. |
| Not supported | Instance ID |
|
Instance configuration query | Queries the configuration and status of a database instance, including details such as log settings, storage policies (hot/cold), audit status, Performance Insights status, and migration and version support. |
| Not supported | Instance ID |
|
View CREATE TABLE statement | Displays the CREATE TABLE statement for a specified table. |
| Supports MySQL and PostgreSQL engines. | • Instance ID |
|
Abnormal security events | Queries for abnormal security events in database instances under your Alibaba Cloud account, such as account cracking attempts, sensitive data downloads, abnormal logins, mass data deletion in a short time, and credential stuffing attacks. This helps you quickly identify potential security threats, analyze the context of abnormal behaviors, and take targeted protective measures to enhance database security and compliance. |
| Not supported | None |
|
Security baseline changes | Queries the trend of security baseline changes for a database instance within a specified time range. This helps you understand the evolution of its security configuration, identify risk improvements or deteriorations, track long-standing unremediated items, and receive actionable guidance to enhance security and compliance. |
| Not supported | • Instance ID |
|
Latest security baseline | Queries the latest security baseline scan results for database instances under your Alibaba Cloud account. This helps you understand the overall security configuration status, identify potential risks, and provides actionable remediation guidance to enhance database security and compliance. |
| Not supported | None |
|
Sensitive data discovery | Queries the sensitive data scan results for database instances under your Alibaba Cloud account and provides detailed information on data classification and categorization. This helps you determine if sensitive data exists, understand its distribution, and assess its risk level to support data security management and compliance checks. |
| Not supported | None |
|
Global security risk trend | Analyzes the time trend of global database security risks, using histogram data to identify risk fluctuation patterns, detect abnormal peaks, and provide a visual analysis of risk evolution. |
| Not supported | None |
|
Instance security risk trend | Analyzes the security risk time trend for a single database instance using histogram data. This helps identify fluctuation patterns and abnormal peaks across risk dimensions like abnormal SQL operations, SQL injection, and data leaks, enabling DBAs to quickly trace the evolution of the instance's security issues. |
| Not supported | Instance ID |
|
Instance security alert statistics | Queries SQL security alert statistics for a single database instance within a specified time range. It provides distributions by alert level (critical, warning, informational) and type (SQL injection, data leak, abnormal operation) to help you quickly understand the instance's overall security posture and risk distribution. |
| Not supported | Instance ID |
|
Supported on-premises/third-party cloud instances: For databases from other cloud providers or on-premises deployments, the DAS Agent provides diagnostics and optimization suggestions for MySQL, PostgreSQL, Redis, and MongoDB engines over standard protocols. The agent is not compatible with vendor-specific customizations or non-standard modifications.
API query example format: This format uses a structured request body to trigger a skill directly via an API call. Unlike natural language queries, this method ensures stable and reliable execution of the diagnostic task.
Procedure
Go to the DAS Agent page.
PC
Log on to the DAS console.
Click the DAS Agent icon.
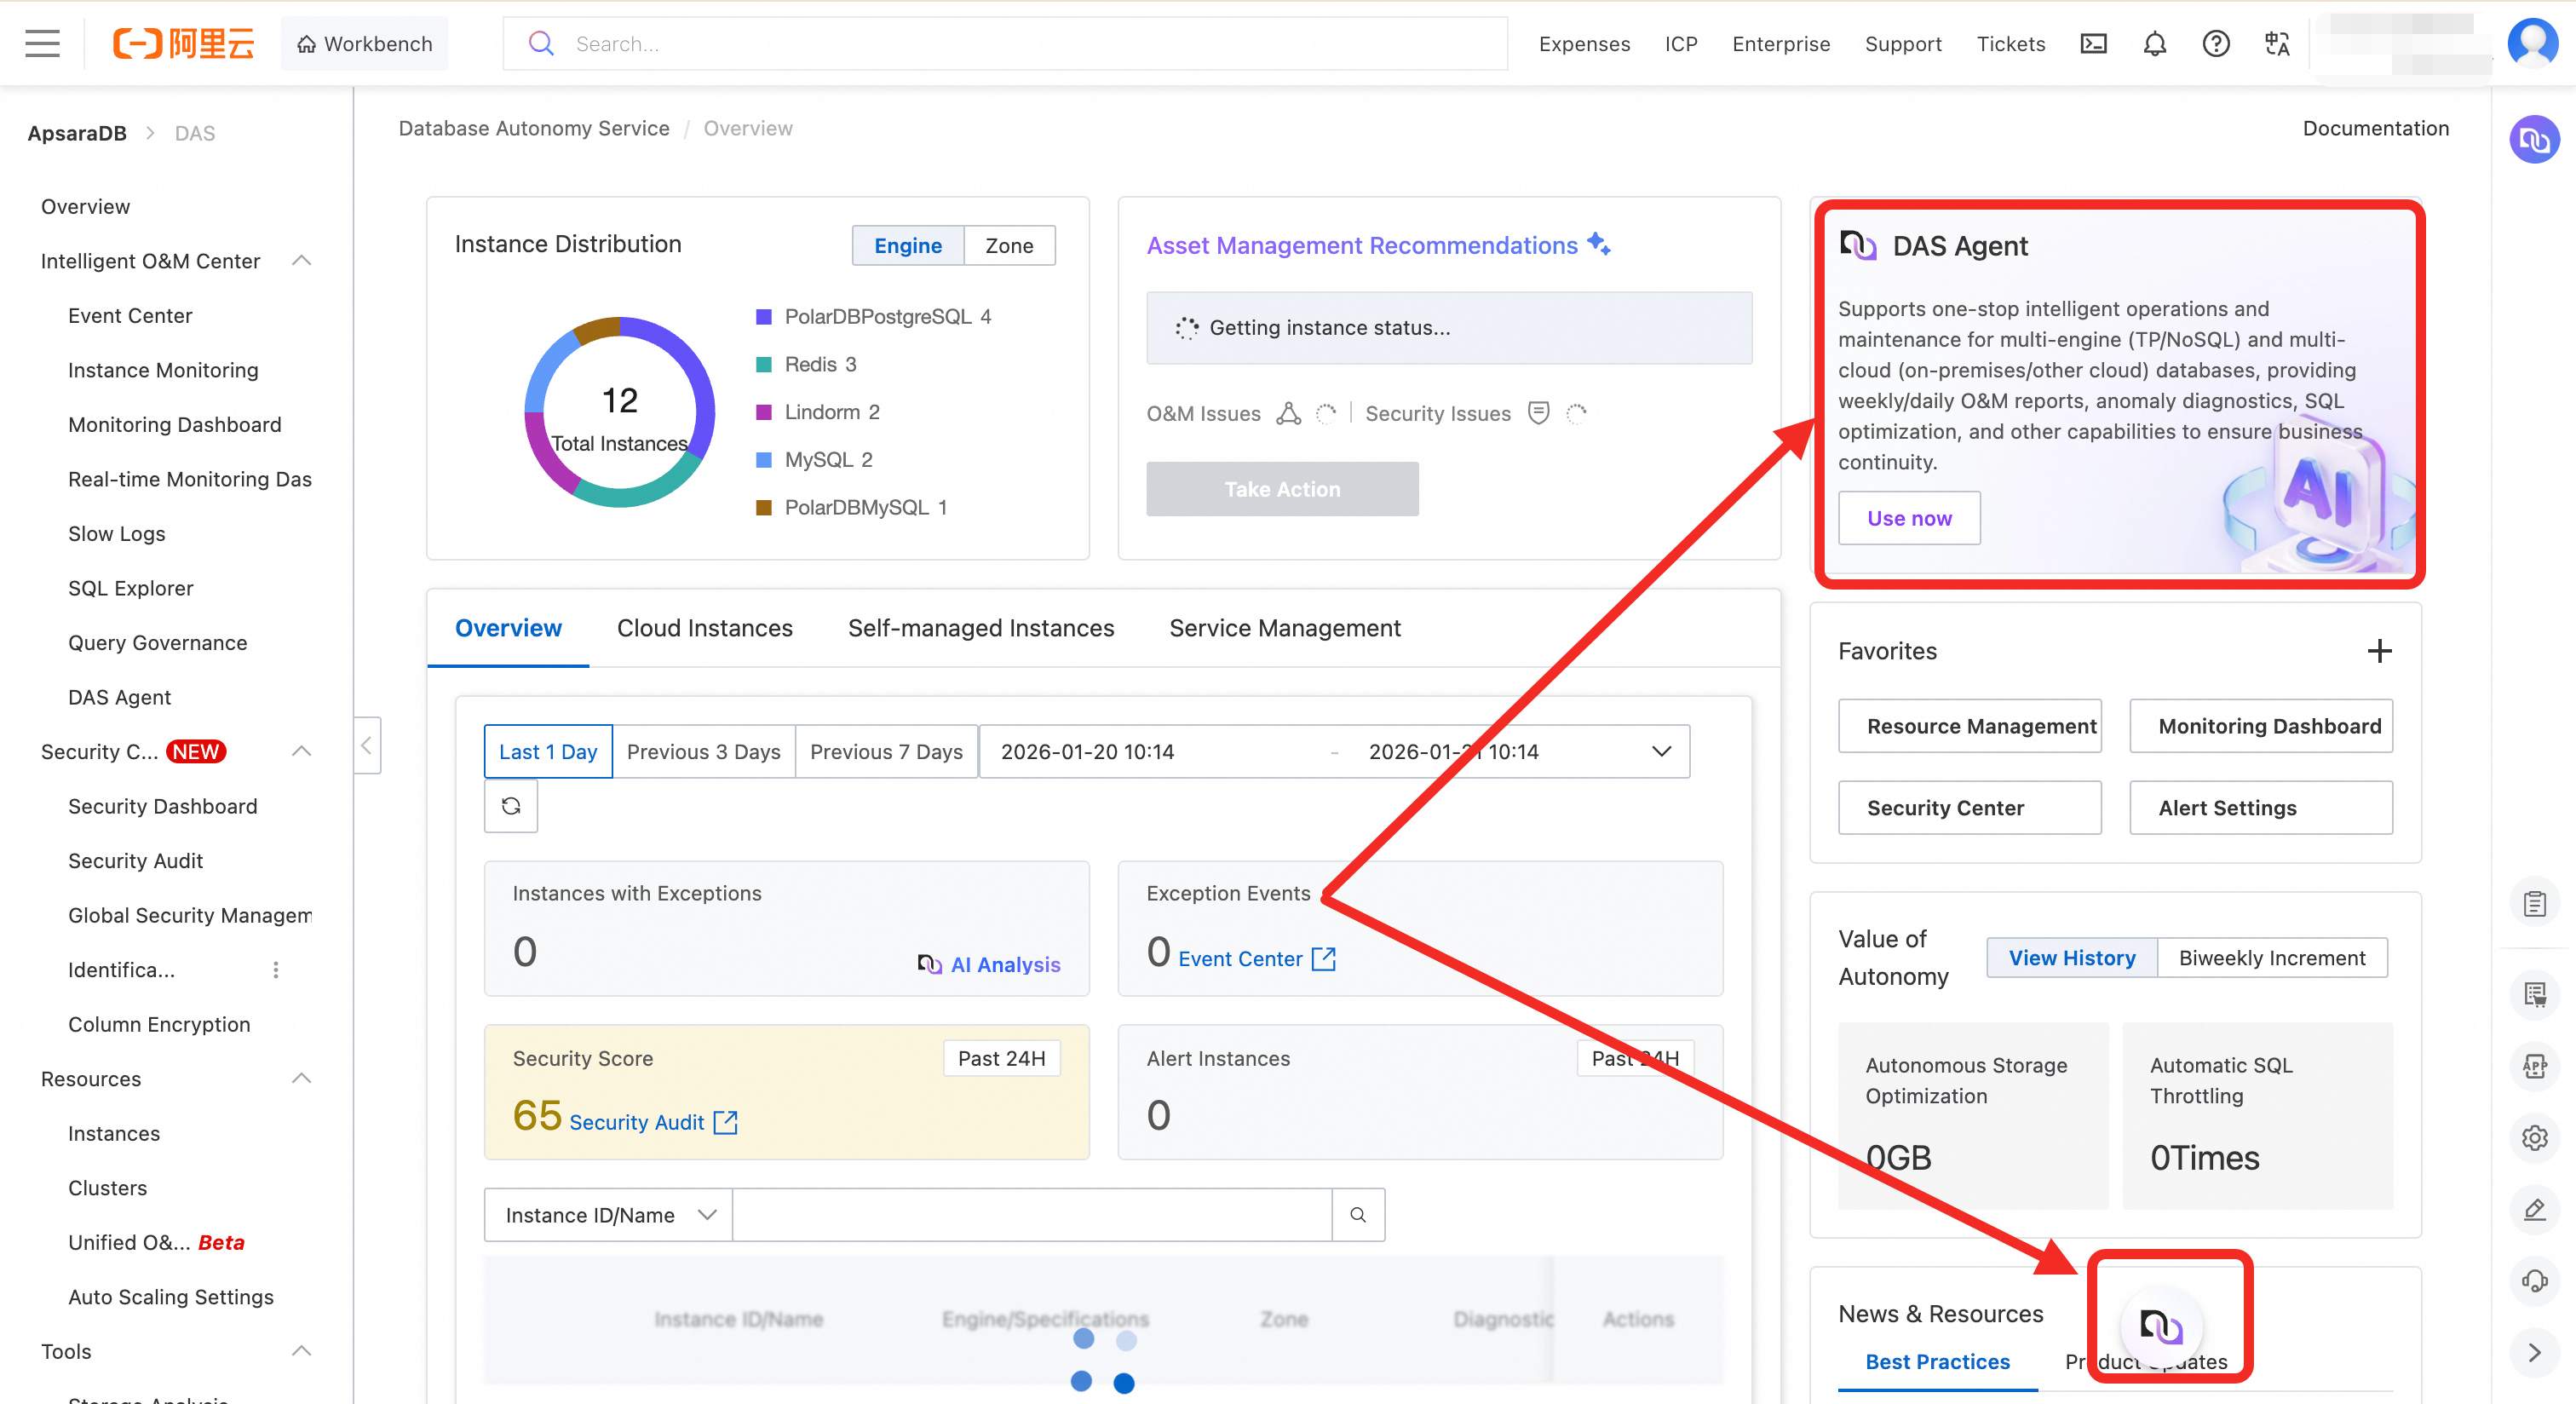
Select an appropriate instance specification and complete the purchase. For details about instance specifications and billing, see DAS Agent.
Mobile Web
Log on to the DAS Agent page.
NoteOn Mobile Web, you can access DAS Agent only from a web browser. In-app access is not supported.
Configure DAS Agent.
After you complete the payment, you must configure DAS Agent to manage different instance groups. DAS provides different management capabilities based on the edition:
Basic Edition (formerly Personal Edition): Supports one agent that can manage up to 10 instances.
Enterprise Edition: Allows you to configure multiple agents to manage different instance groups. You can also have multiple agents manage the same instance, similar to a scenario where multiple DBAs manage the same set of instances in shifts.
To configure an agent:
Log on to the Agent management page.
(Optional) For the Enterprise Edition, click Add on the list page to create multiple agents and assign instances to each agent.
Edit the agent configuration.
In the Actions column of the target agent, click Edit to open the Edit Configuration page.
In the Associated Instances section, select the instance IDs that you want the agent to manage, and then click OK.
Limitations
After the configuration is complete, each agent can perform operations such as Q&A, diagnostics, and interactive sessions only on the instances that it manages.
Use cases:
Integrate with your system by using an API
If you integrate DAS Agent with your system by using an API, you can connect based on different agent IDs. This way, different personnel, such as DBAs or developers, can only access and operate the instances within their permission scope.
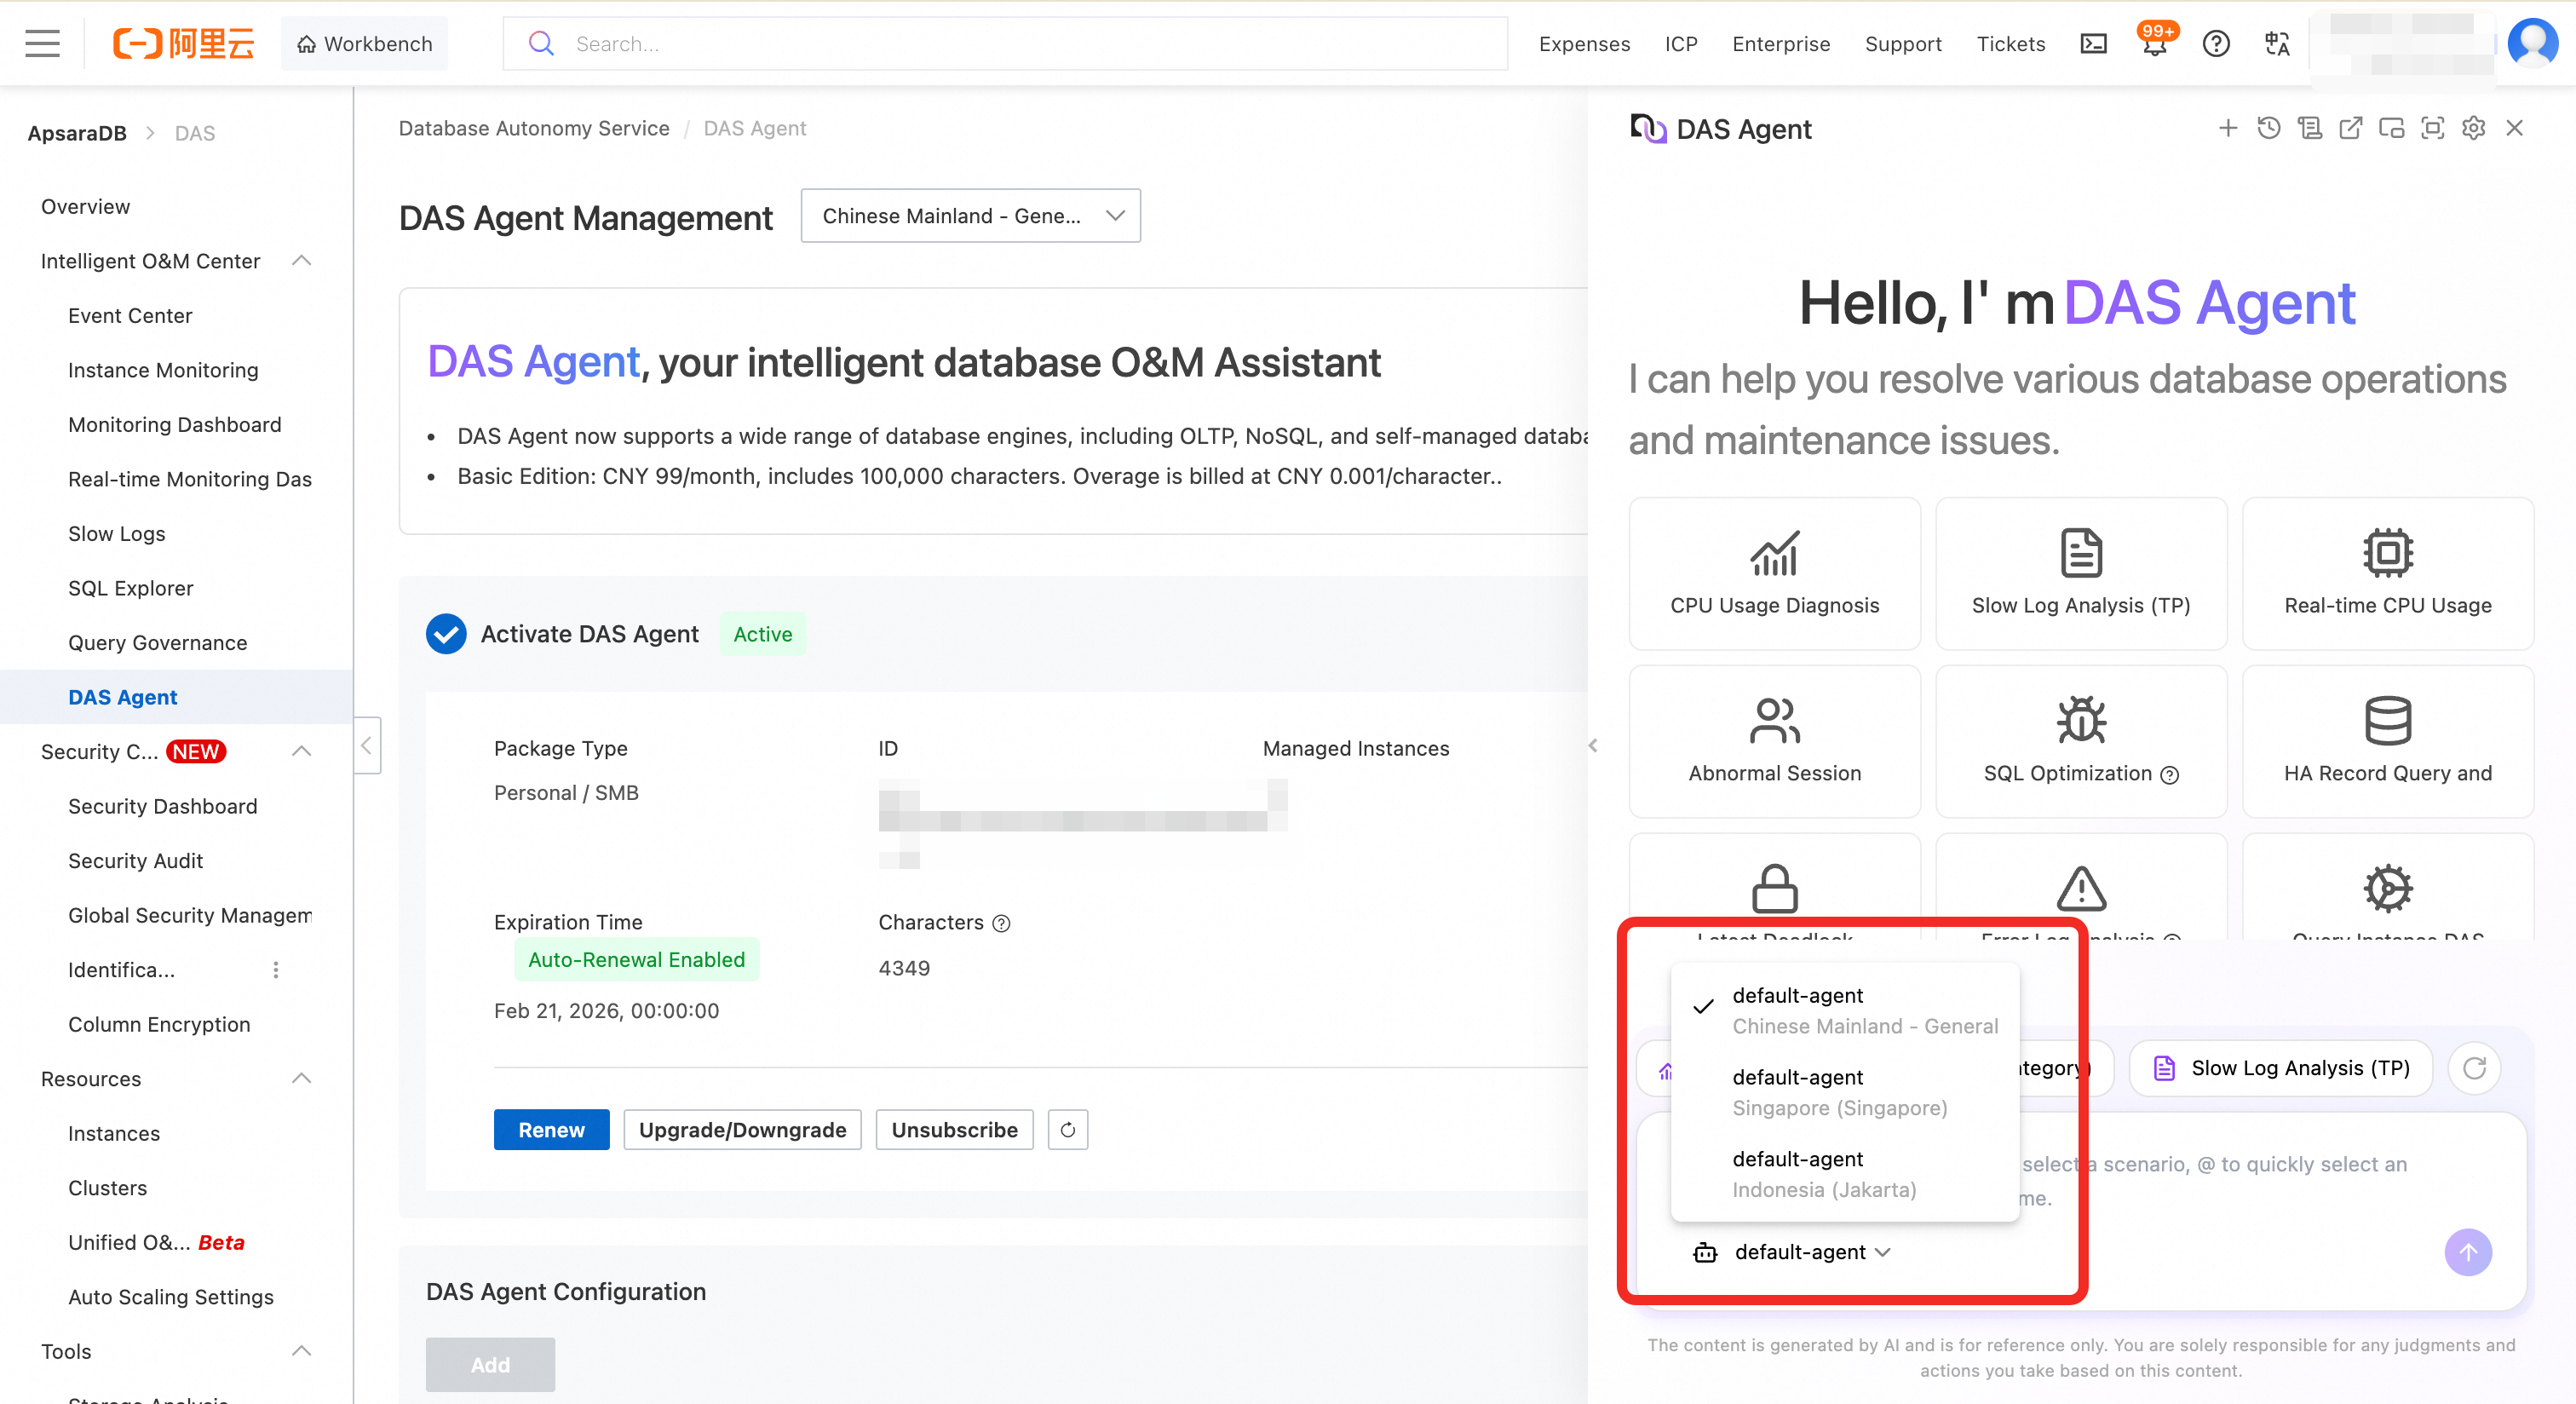
Use the chat feature in the console
When you operate directly in the console, you must switch to the corresponding agent for the country or region to perform O&M on the instances it manages.
Permission configuration
To ensure system security and operational compliance, you must configure appropriate permissions for the account before using DAS Agent. DAS provides two built-in permission policies for different roles and use cases:
Policy name
Permission level
Key capabilities
AliyunHDMReadOnlyAccessread-only access
Allows users to view all instances within their permission scope in the DAS console.
Prohibits users from making changes, such as restarting instances or modifying parameters.
Allows users to use the O&M capabilities of DAS Agent, such as intelligent diagnostics, performance analysis, and natural language interaction, for authorized instances.
AliyunHDMFullAccessfull access
Provides full control over all DAS features.
Allows users to perform operations such as diagnostics, optimization, changes, and data export for all database instances under the current UID.
Includes all capabilities of the
AliyunHDMReadOnlyAccesspolicy.
To configure permissions:
Log on to the RAM console.
In the navigation pane on the left, choose .
Find the target user and click Add Permissions in the Actions column.
In the Select Policy panel, search for and select
AliyunHDMReadOnlyAccessorAliyunHDMFullAccess.Click OK to grant the permission.
Use DAS Agent to start an AI-powered diagnosis.
Diagnostic card
Click the card for your use case.
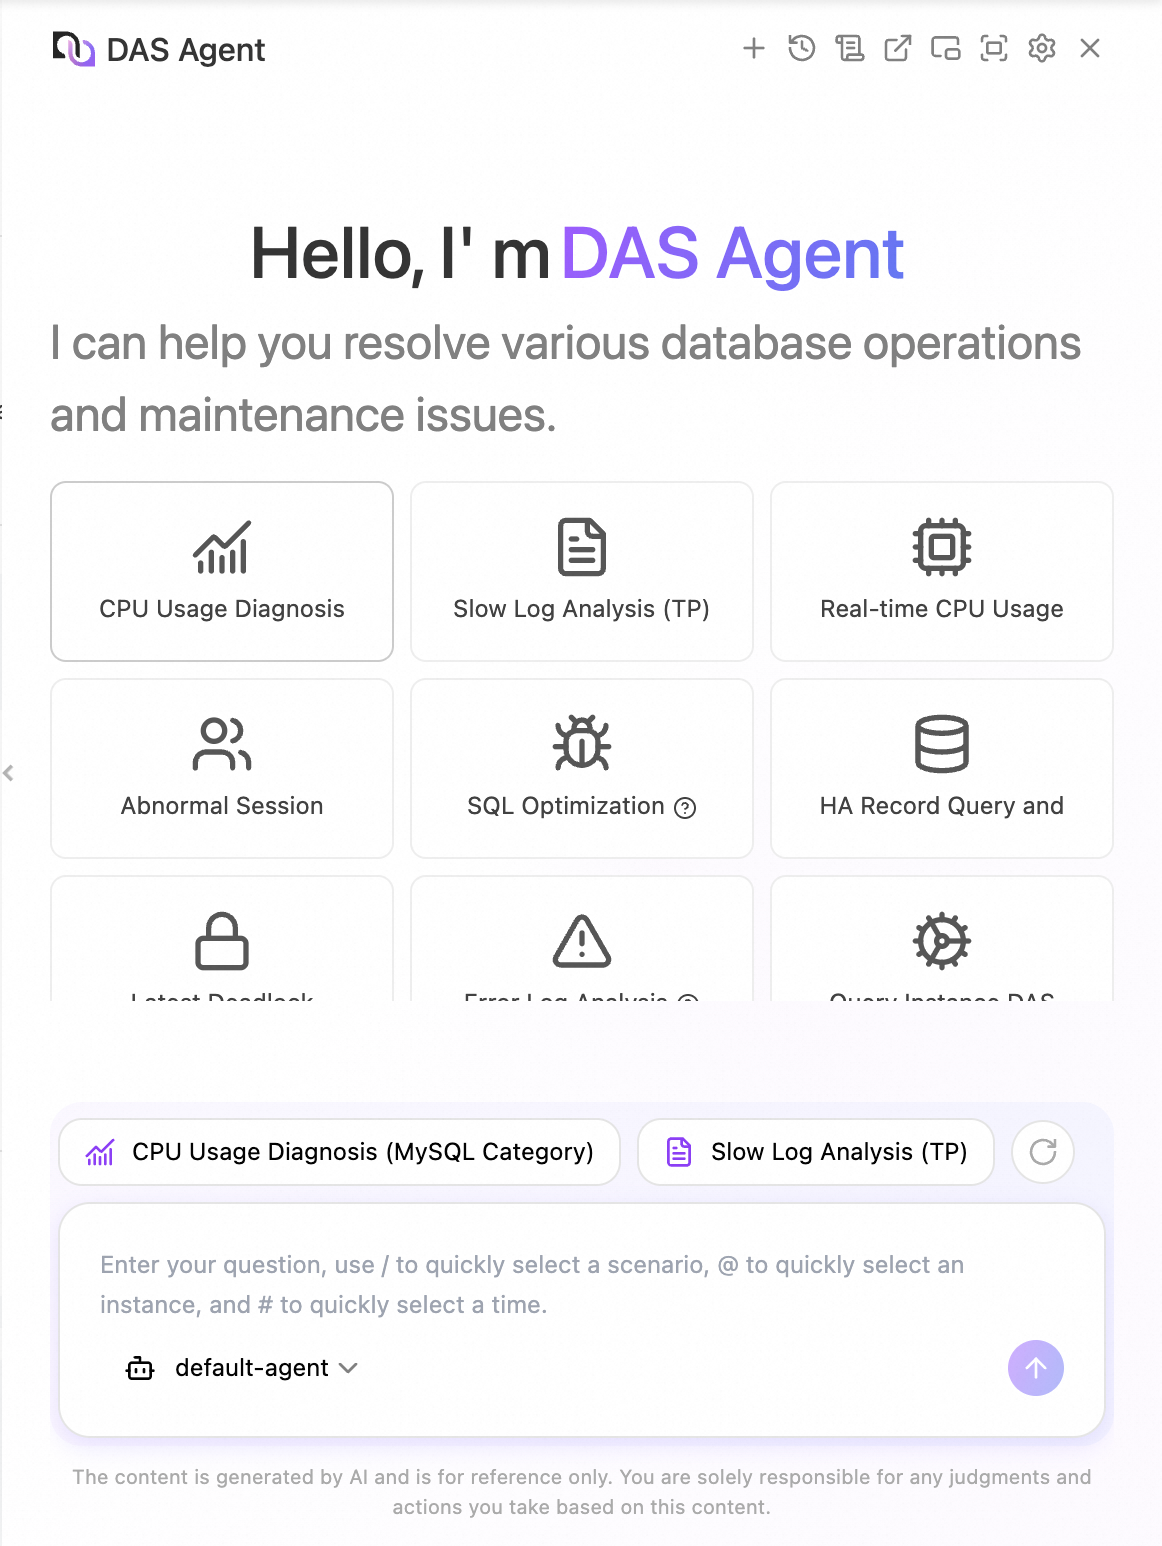
In the dialog box that appears, select the diagnostic target (instance ID), time range, and other parameters as needed.
NoteThe required parameters vary based on the scenario. For example, to perform SQL Diagnostic and Optimization, you must provide the database and the SQL statement.
Click OK.
Chat session
When you enter a question in the chat box, DAS Agent identifies your intent, finds relevant knowledge, and starts a diagnosis. The agent then plans a diagnostic path based on your question and adjusts the steps based on real-time feedback. For example, to assess an instance's health, the agent analyzes metrics like CPU utilization, session count, memory usage, TPS, QPS, deadlocks, and slow SQL. If it finds significant slow SQL issues, the agent performs further diagnostics and provides index recommendations or query rewrite suggestions.
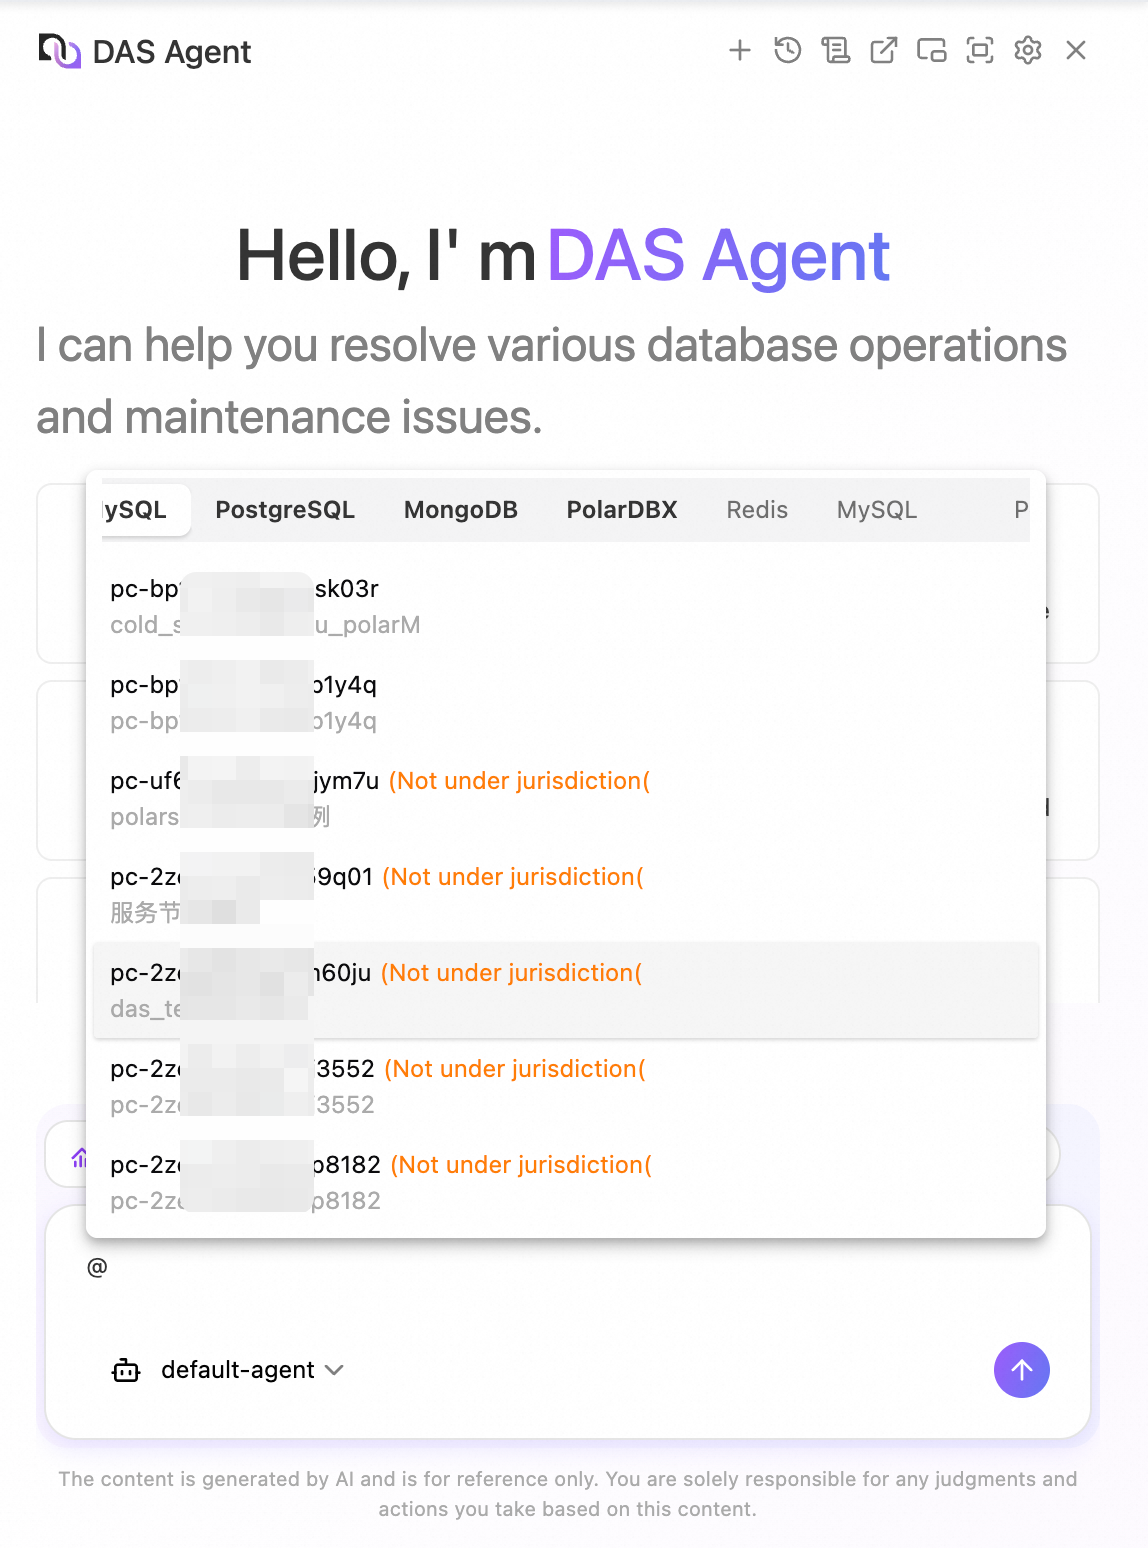
You can also use the /, @, or # shortcut to quickly open a diagnostic scenario, retrieve a list of instances, or select a time range.
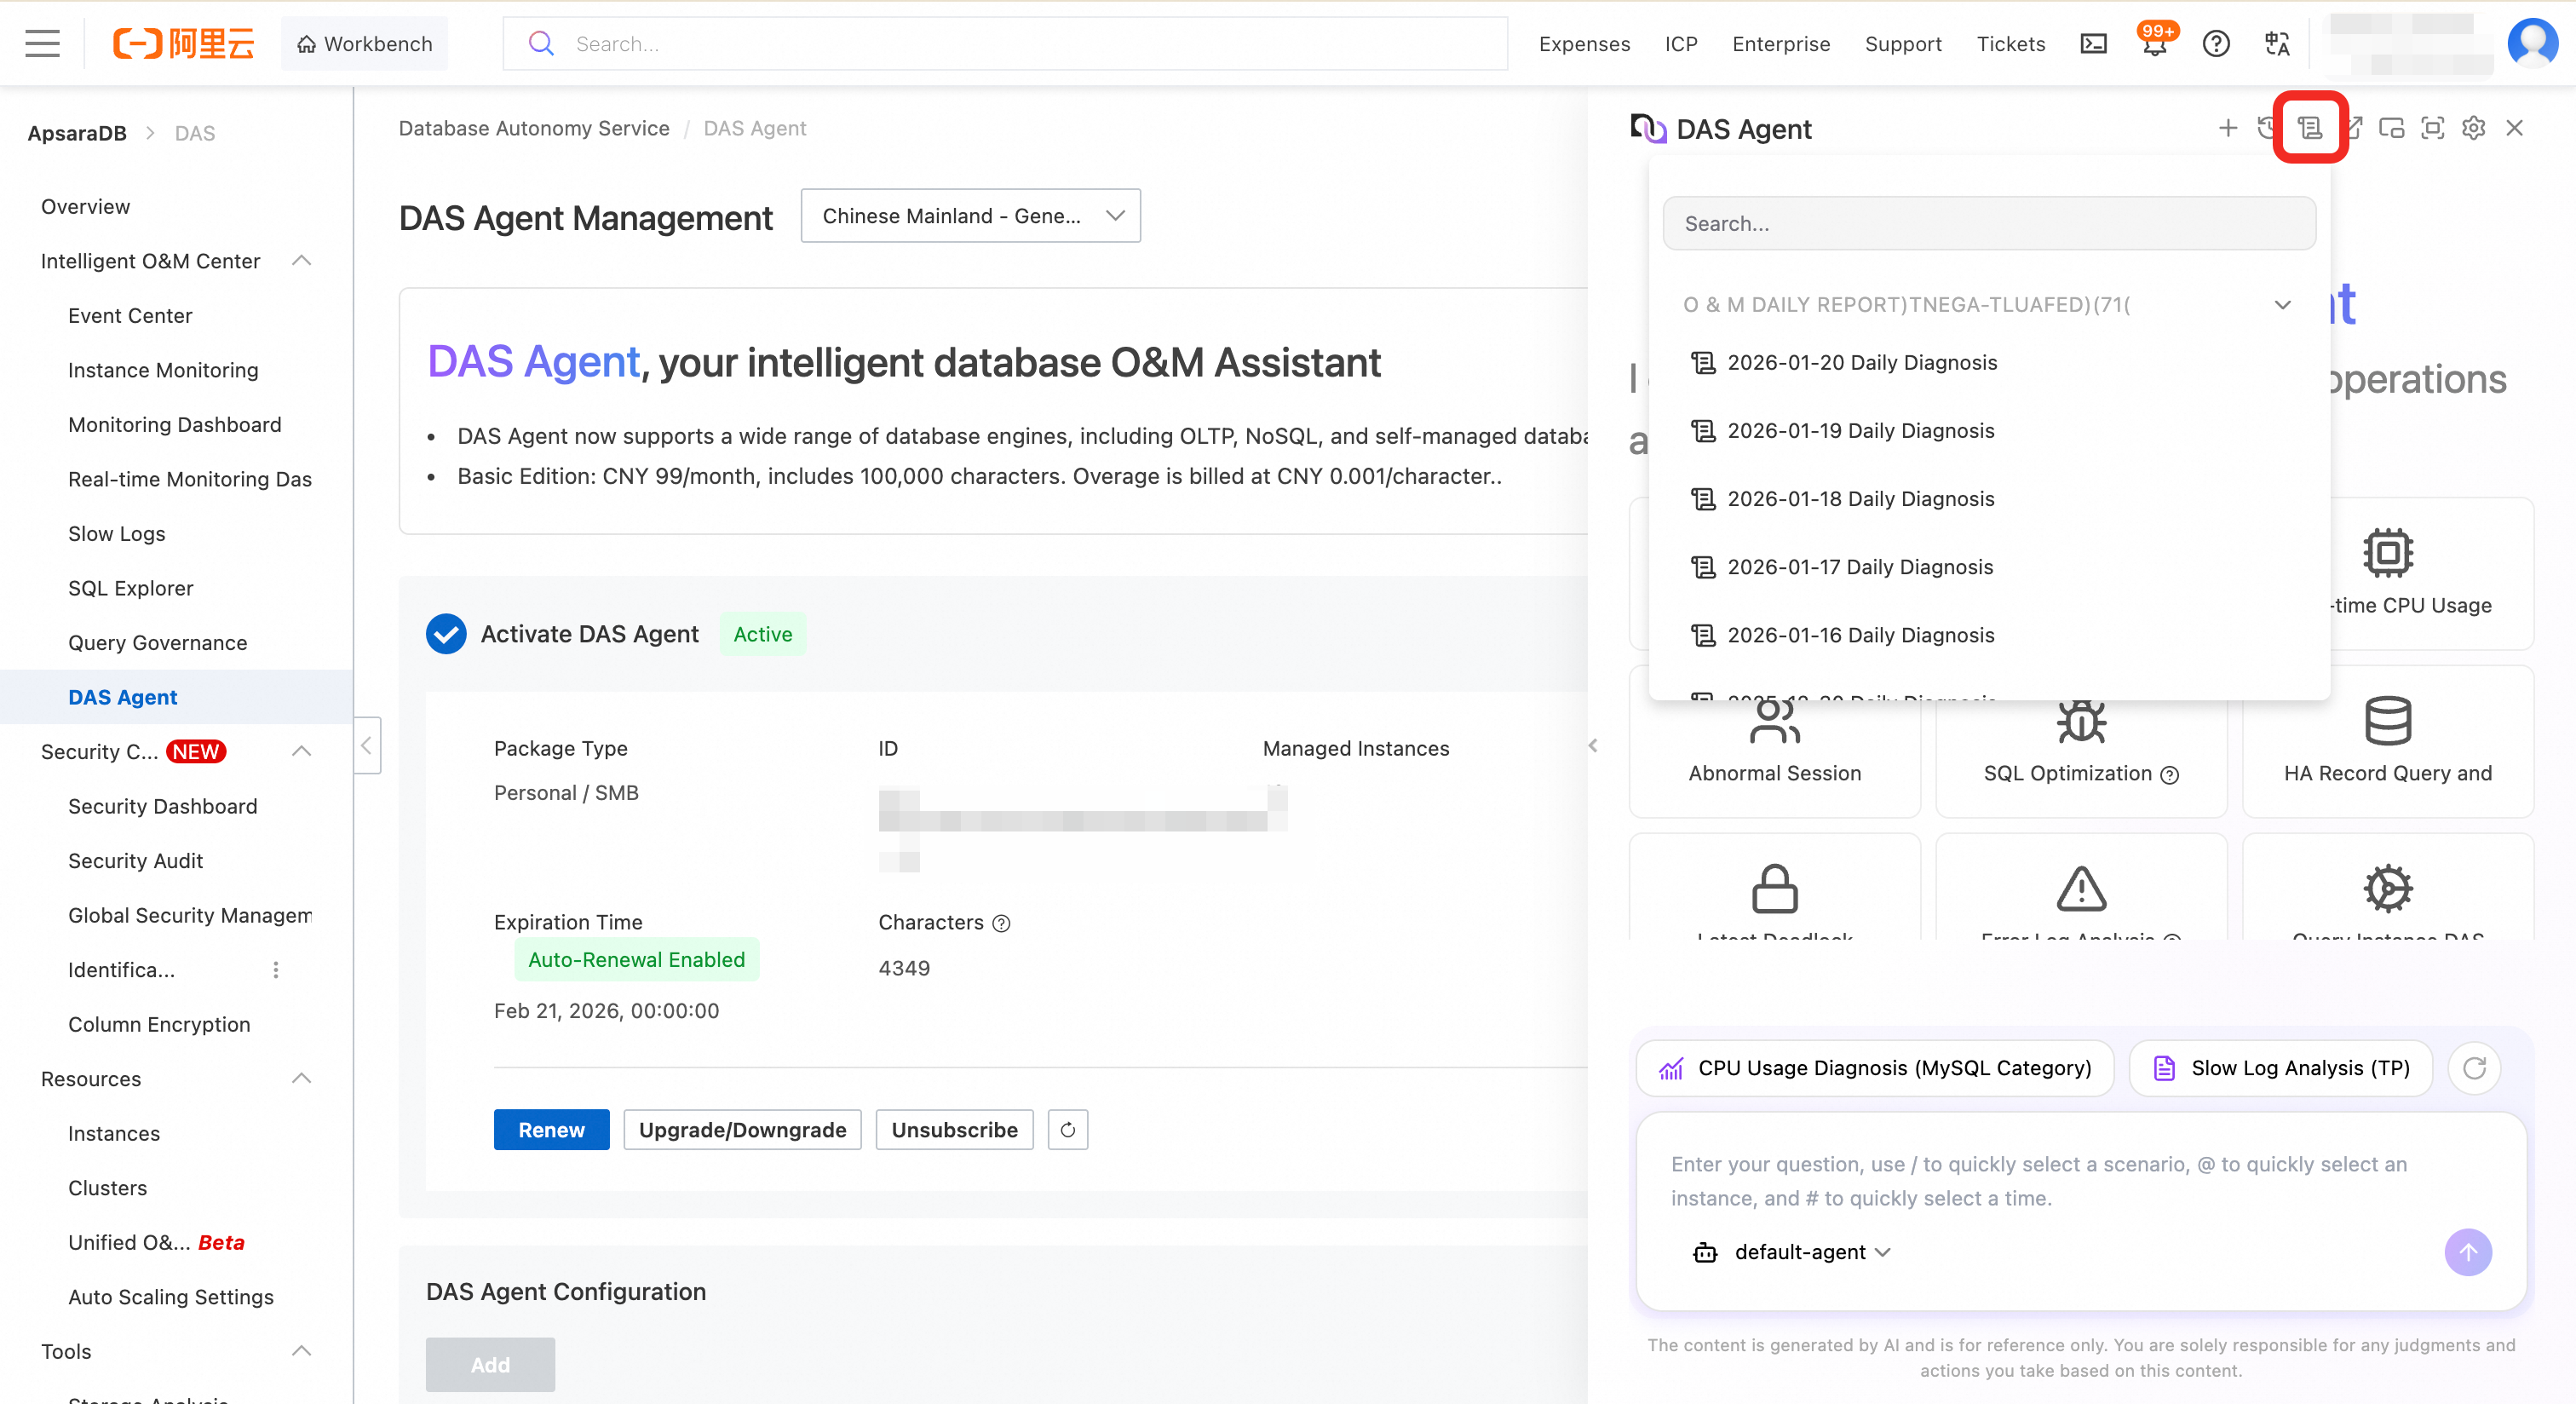
The Database O&M Daily Report feature, powered by DAS Agent, is available for database instances managed by the Enterprise Edition. Each day, the feature analyzes over 200 million tokens to generate a structured summary of key O&M indicators. This summary includes anomaly alerts, optimization recommendations for high-impact slow SQL, disk space trends, ineffective index results, and key resource metrics like CPU, memory, and I/O. The report provides an actionable overview that helps O&M teams understand database health, predict risks, and perform optimizations, ensuring system stability and supporting continuous improvement.
In the navigation pane on the left of the DAS console, choose .
Find the target daily report.
In the Actions column of the target daily report, click View Details.
You can also click the
 icon at the top of the DAS Agent page to view the report.