As your workload grows, the number of SQL requests increases, driving up database monitoring metrics. Since many requests share similar characteristics, it is difficult to pinpoint problematic SQL requests individually by using the full SQL analysis feature. The abnormal SQL request identification feature of Database Autonomy Service (DAS) uses machine learning to cluster and filter SQL queries. This lets you pinpoint abnormal SQL requests quickly and accurately.
Prerequisites
-
The instance runs one of the following versions:
-
ApsaraDB RDS for MySQL 5.6, 5.7, or 8.0
-
ApsaraDB MyBase for MySQL 5.6, 5.7, or 8.0
-
-
The DAS autonomy service is enabled for the instance. For more information, see Autonomy Center.
-
DAS Enterprise Edition is enabled for the instance. For more information, see Enable Enterprise Edition.
Scenarios
Scenario: Your workload includes a large number of SQL templates. Regardless of how you sort them, it is difficult to quickly find abnormal SQL requests. On the SQL Performance Analysis page, you can view key metrics for each SQL template in the slow query list, such as average execution time, percentage, execution count, average rows scanned, and average rows returned, along with an execution trend chart. Look for abnormal SQL requests with a sudden increase in execution time on the trend chart, such as slow queries whose average execution time exceeds 4 seconds. Click Optimize in the corresponding row to diagnose and optimize the query.
Solution: The abnormal SQL request identification feature helps you quickly locate performance issues in two ways:
-
Approach 1: When your business handles a large volume of requests, DAS can classify SQL templates based on their request behavior. For example, if you have hundreds of pages of SQL templates and sorting does not help you identify the problematic ones, you can use the abnormal SQL request identification feature. DAS uses backend algorithms to identify similar behavioral patterns and cluster the SQL templates, which improves troubleshooting efficiency. The SQL request analysis page displays a table sorted by cpu_usage correlation. The table includes columns such as Aggregated chart (trend chart), Number of SQL templates, Average latency, Execution count ratio, Rows scanned, and Latency ratio.
-
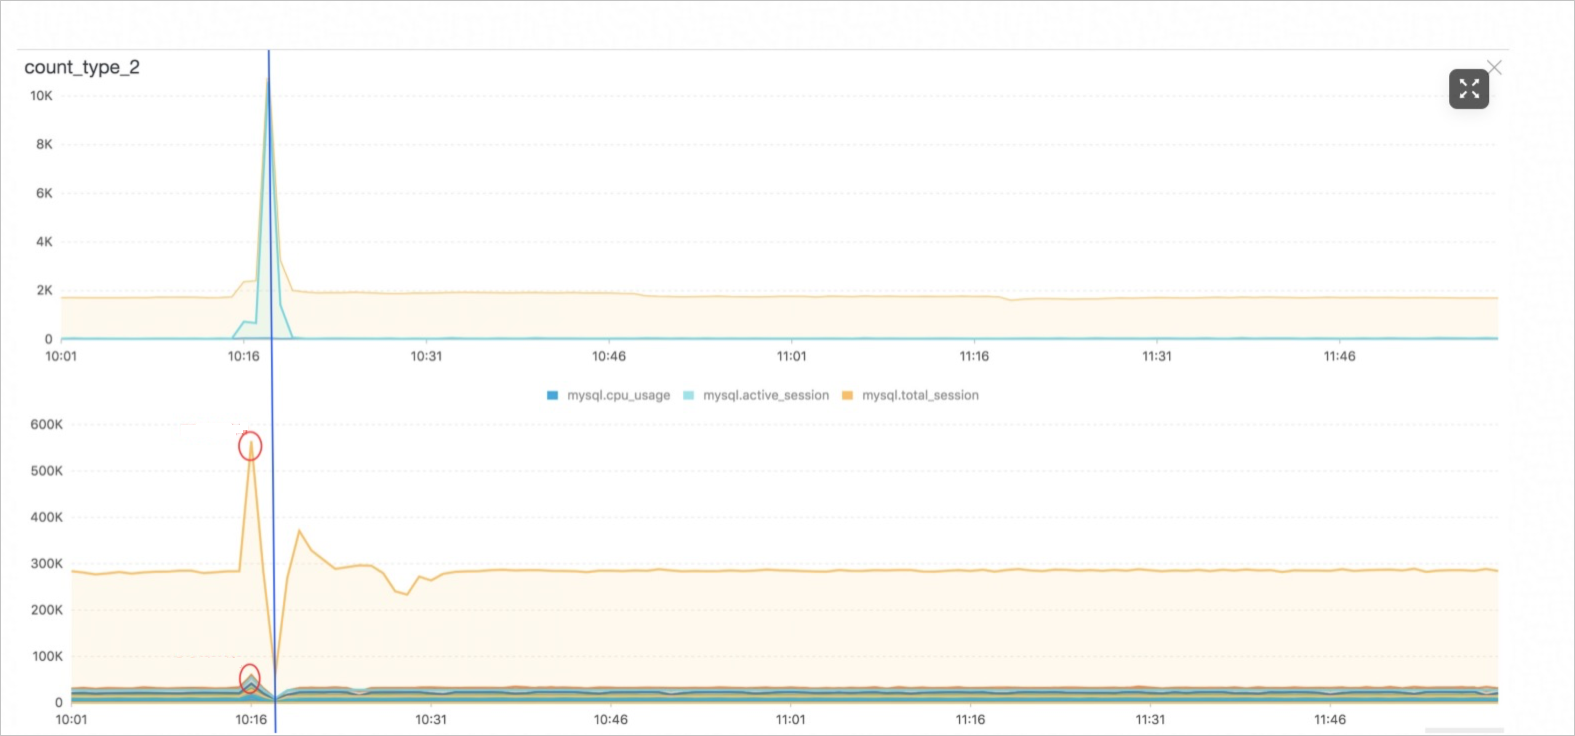
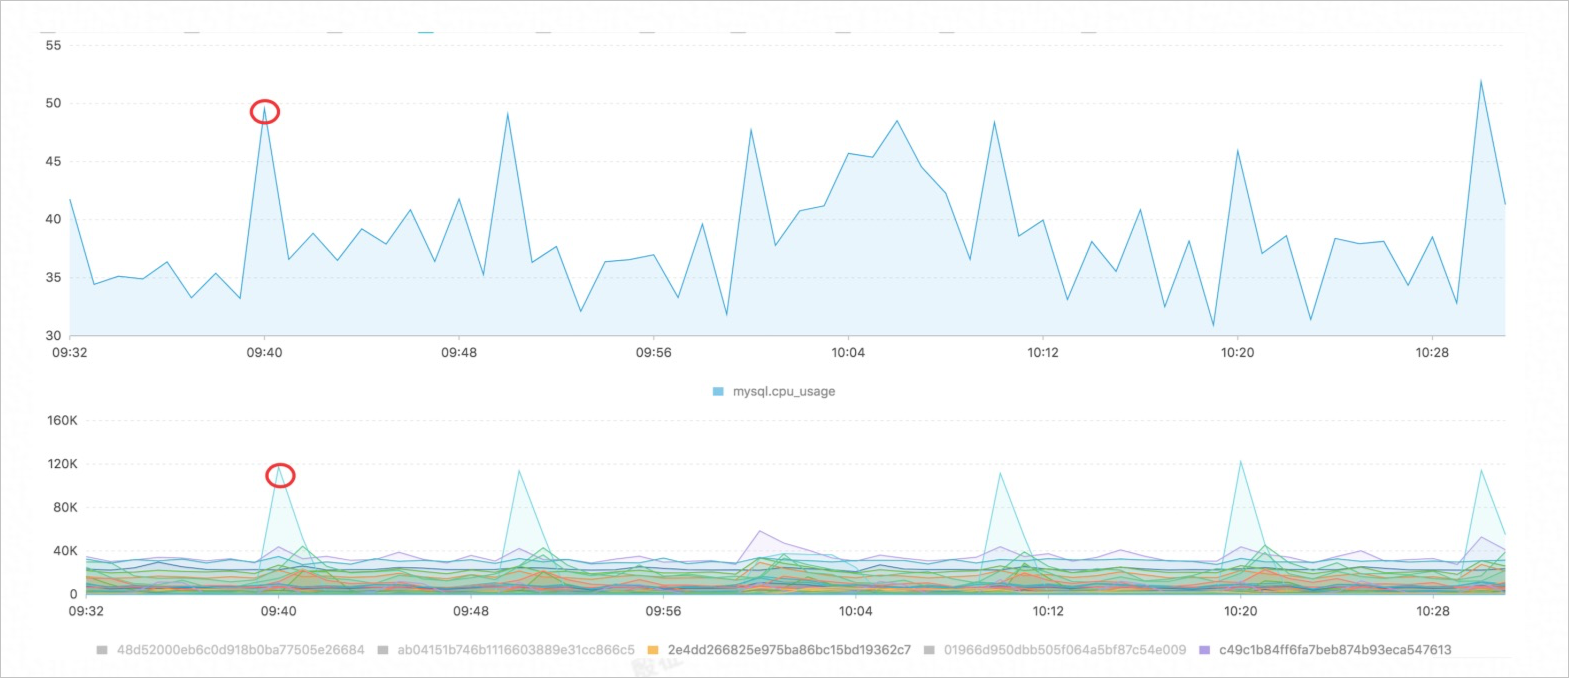
Approach 2: The abnormal SQL request identification feature helps you investigate issues by correlating SQL behavior with metric anomalies. The following chart shows the trend of an abnormal metric. In the chart, the peak times for CPU utilization and active sessions coincide with a sudden drop in requests for a specific SQL template category. This indicates that requests in this category are blocked during the active session spike.
Procedure
Log on to the DAS console.
In the navigation pane on the left, click .
Find the target instance and click the instance ID to open the instance details page.
In the navigation pane on the left, click Autonomy Center.
-
Select a time range to view events from that period.
For a time series exception detection event, for example, click Details.
-
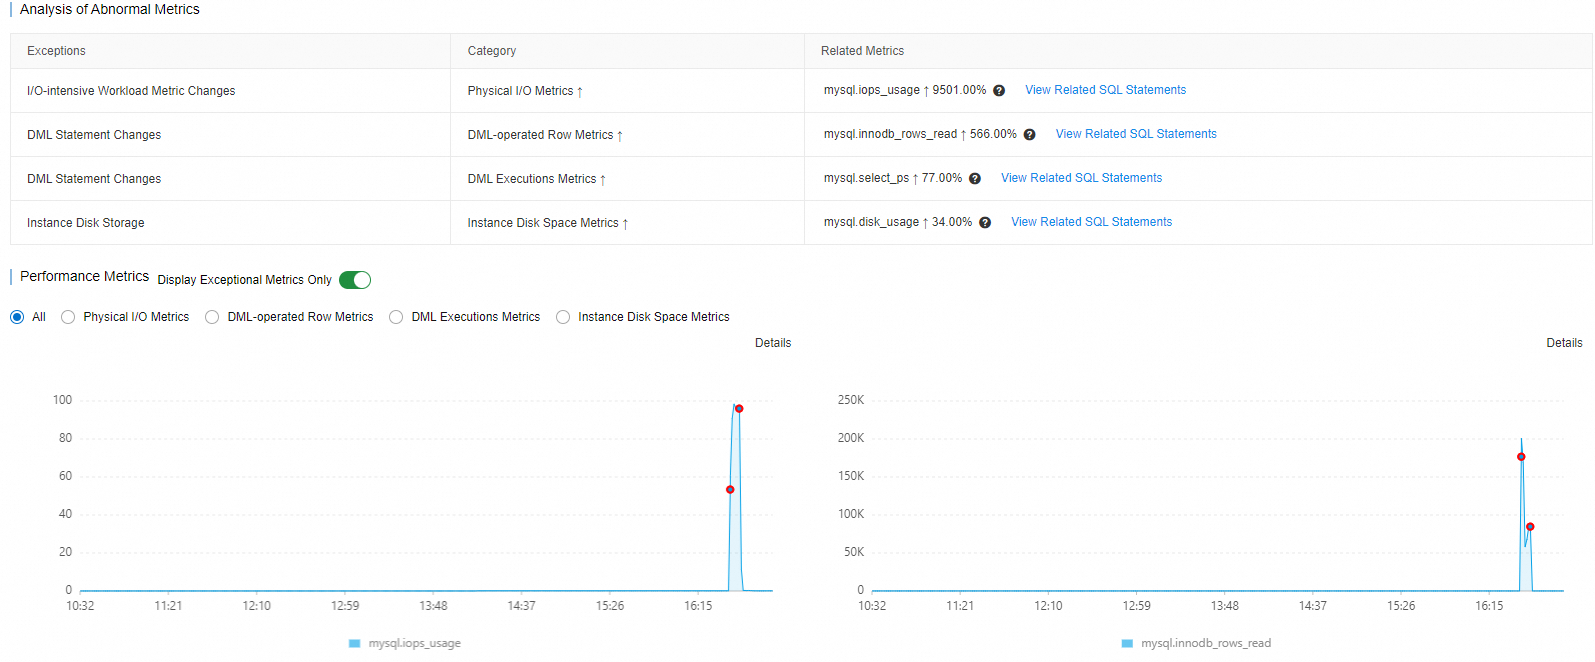
Click the Anomaly Snapshots tab. In the Analysis of Abnormal Metrics section, view the causes of the anomaly and the related metric changes.
-
In the Performance Metrics area, select different abnormal metric categories to view their distribution.
-
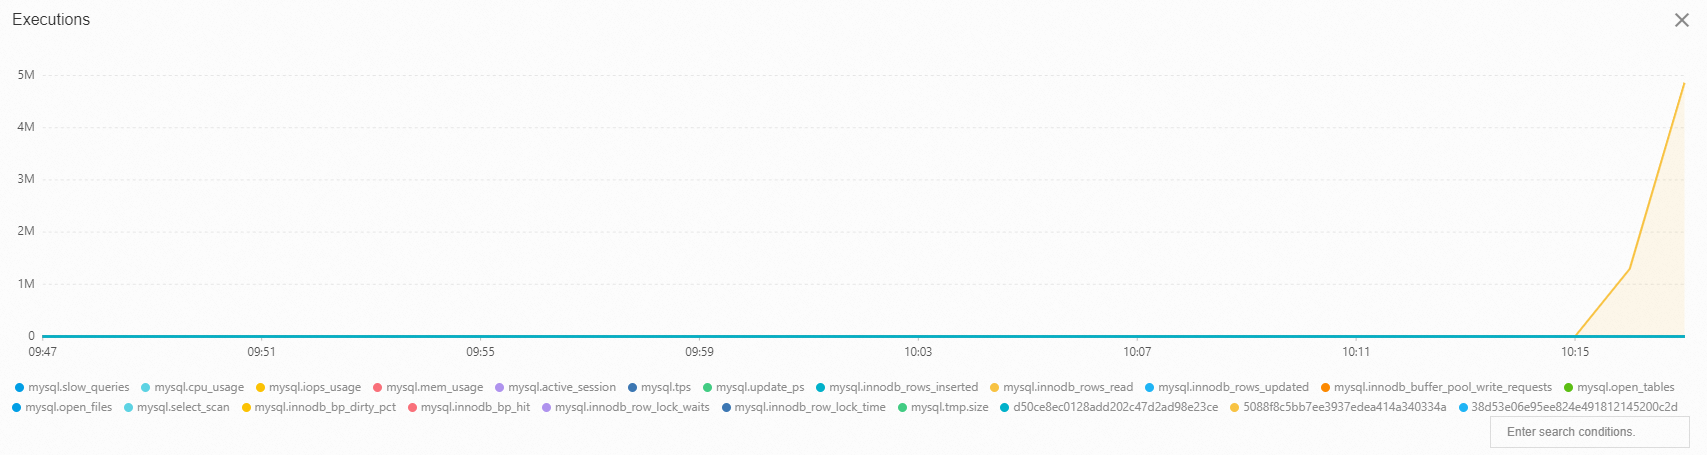
In the SQL Request Behavior Analysis area, select a metric and its associated metrics to analyze.
DAS analyzes data from the top 1,000 SQL templates, ranked by total execution time. Because this feature relies on the full SQL analysis data from DAS Enterprise Edition, the analysis typically takes 1 to 5 minutes, depending on the data volume and available compute time.
-
View the analysis results.
You can view the SQL metrics most correlated with the anomaly, along with the related SQL templates and their statistics.
NoteA correlation value closer to 1.00 indicates a stronger association with the anomaly.
-
Interpret the results
With abnormal SQL request identification, you can observe fluctuation trends for similar SQL templates.
-
Although this SQL request category shows a brief spike, its timing does not align with the metric spike. Therefore, this category is not considered the primary cause of the metric anomaly, as shown in the following figure. The abnormal SQL request identification results are displayed in a table that has two tabs: execution count and rows scanned. The table lists SQL templates by aggregated category, such as count_type_1 to count_type_4, and provides metrics such as Number of SQL templates, Average latency, Execution count ratio, CPU usage similarity, IOPS usage similarity, Rows scanned, and Latency ratio. You can click View to see more details.
-
The chart shows that the peak times for CPU utilization and active sessions coincide with a sudden drop in requests for an SQL template category. This indicates that SQL requests in this category are likely blocked when the number of active sessions spikes.