This topic describes how to inject ephemeral containers that run tcpdump into workloads deployed in Container Compute Service (ACS) and then use tcpdump to capture packets for troubleshooting.
Background information
tcpdump is commonly used to capture packets transmitted through ports and analyze them in real time. O&M engineers can use tcpdump to monitor and record network traffic and view the detailed information about the captured packets, such as the source address, destination address, and protocol. The information helps you troubleshoot network issues and diagnose network latency, packet loss, and abnormal connections.
To inject ephemeral containers into workloads deployed in an ACS cluster to capture packets, perform the following steps.

Procedure
The following example shows how to manually inject ephemeral containers that run tcpdump into a sample application and then use tcpdump to capture packets in the ephemeral containers.
Create a file named acs-tcpdump.yaml and add the following content to the file.
apiVersion: apps/v1
kind: Deployment
metadata:
  name: acs-tcpdump
  namespace: default
spec:
  replicas: 1
  selector:
    matchLabels:
      app: acs-tcpdump
  strategy:
    rollingUpdate:
      maxSurge: 25%
      maxUnavailable: 25%
    type: RollingUpdate
  template:
    metadata:
      labels:
        alibabacloud.com/compute-class: general-purpose
        alibabacloud.com/compute-qos: default
        app: acs-tcpdump
    spec:
      containers:
      - image: registry.openanolis.cn/openanolis/nginx:1.14.1-8.6
        imagePullPolicy: IfNotPresent
        name: tcpdump
        resources:
          limits:
            cpu: 500m
            memory: 1Gi
          requests:
            cpu: 500m
            memory: 1Gi
      dnsPolicy: ClusterFirst
      restartPolicy: Always
      schedulerName: default-scheduler
      securityContext: {}
      terminationGracePeriodSeconds: 30
Run the following command to deploy the application:
kubectl apply -f acs-tcpdump.yamlInject ephemeral containers into the application.
kubectl debug -n default acs-tcpdump-7d959xxxxx-xxxxx --image=registry-cn-hangzhou.ack.aliyuncs.com/ack-demo/acs-tcpdump-demo:alpha.v1 -c acs-tcpdump --container=debug-container --profile=netadminImportantIf setting profile to
netadmindoes not provide sufficient permissions to meet your requirement, you can change its value tosysadmin. To use the value ofsysadmin, you must enable the privileged mode for pods. Proceed with caution in a production environment. We recommend that you monitor and audit relevant operations after this mode is enabled.By default, the privileged mode is disabled for ACS clusters. To enable this mode, submit a ticket.
The image used by the ephemeral containers contains the following tools.
Tool
Purpose
Require the privilege mode
Trace-CMD
It is used to trace kernel functions. For more information, see trace-cmd.
Yes
perf
A system performance optimization tool of the Linux kernel. For more information, see perf.
Yes
SysAK
System Analysis Kit (SysAK) is an O&M toolset provided by OpenAnolis. It consists of tools for diagnostics, event monitoring and tracing, and system and service management.
Yes (partially)
Strace
A Linux user space tracker for diagnostics and debugging. It is used to monitor interactions between processes and kernels in user spaces, such as system calls, signal transfer, and process status changes. For more information, see strace.
Yes
tcpdump
A power packet capturing tool used to capture and analyze network traffic. It can be run at the CLI and provides detailed packet information to help you diagnose network issues, monitor network traffic, and analyze network security.
Yes
IProute2
A network configuration and management CLI. It is used to replace the net-tools toolset, which consists of ifconfig, route, and netstat.
Yes
Nmap-ncat
A tool contained in the nmap project, which is usually known as ncat. It is a powerful network tool used to read data from and write data to network connections. It is an optimized version of netcat.
Yes
It is used to query the injection status of ephemeral containers.
kubectl describe pod acs-tcpdump-7d959xxxxx-xxxxx | grep Containers: -A 10Expected results:
Containers:
  tcpdump:
    Container ID:   containerd://71da93ea68ec02a2bcd468b7835ecd12d8180d4a05ac80d77ff4dcab61aea701
    Image:          registry.openanolis.cn/openanolis/nginx:1.14.1-8.6
    Image ID:       registry.openanolis.cn/openanolis/nginx@sha256:bb8fe1e8d4353f29768340bdcbe2bfbc105081d550d259fc11d07d2abe53b5d1
    Port:           <none>
    Host Port:      <none>
    State:          Running
      Started:      Thu, 13 Feb 2025 10:23:33 +0800
    Ready:          True
    Restart Count:  0
--
Ephemeral Containers:
  debug-container:
    Container ID:   containerd://5a26877432ab93a6a056b48d34e6c888a4f98c0662627728cf8d8ee4486f3342
    Image:          registry-cn-hangzhou.ack.aliyuncs.com/ack-demo/acs-tcpdump-demo:alpha.v1
    Image ID:       registry-cn-hangzhou.ack.aliyuncs.com/ack-demo/acs-tcpdump-demo@sha256:64ee96ff1b0e000dc5ca0711685e09fe3a08e62a9c9bb1f354682b82f35bddee
    Port:           <none>
    Host Port:      <none>
    State:          Running
      Started:      Thu, 13 Feb 2025 10:24:38 +0800
    Ready:          False
    Restart Count:  0
The output indicates that
debug-containeris injected.Capture packets.
Log on to the ephemeral container.
kubectl exec -it acs-tcpdump-7d959xxxxx-xxxxx -c debug-container -- bashRun the tcpdump command to capture packets sent from all TCP ports to port 80.
tcpdump -i eth0 'tcp port 80'Expected results:
dropped privs to tcpdump
tcpdump: verbose output suppressed, use -v or -vv for full protocol decode
listening on eth0, link-type EN10MB (Ethernet), capture size 262144 bytes
03:09:10.752193 IP acs-tcpdump-7d959bxxxxx-xxxxx.35656 > 100.xxx.xxx.209.http: Flags [S], seq 202950596, win 64240, options [mss 1460,sackOK,TS val 3648381756 ecr 0,nop,wscale 7], length 0
03:09:10.753944 IP 100.xxx.xxx.209.http > acs-tcpdump-7d959bxxxxx-xxxxx.35656: Flags [S.], seq 270454912, ack 202950597, win 29200, options [mss 1440,nop,nop,sackOK,nop,wscale 9], length 0
03:09:10.753966 IP acs-tcpdump-7d959bxxxxx-xxxxx.35656 > 100.xxx.xxx.209.http: Flags [.], ack 1, win 502, length 0
03:09:10.754020 IP acs-tcpdump-7d959bxxxxx-xxxxx.35656 > 100.xxx.xxx.209.http: Flags [P.], seq 1:614, ack 1, win 502, length 613: HTTP: POST /logstores/kernel-logs/shards/lb HTTP/1.1
03:09:10.755776 IP 100.xxx.xxx.209.http > acs-tcpdump-7d959bxxxxx-xxxxx.35656: Flags [.], ack 614, win 60, length 0
03:09:10.755825 IP 100.xxx.xxx.209.http > acs-tcpdump-7d959bxxxxx-xxxxx.35656: Flags [P.], seq 1:26, ack 614, win 60, length 25: HTTP: HTTP/1.1 100 Continue
03:09:10.755829 IP acs-tcpdump-7d959bxxxxx-xxxxx.35656 > 100.xxx.xxx.209.http: Flags [.], ack 26, win 502, length 0
03:09:10.755867 IP acs-tcpdump-7d959bxxxxx-xxxxx.35656 > 100.xxx.xxx.209.http: Flags [P.], seq 614:1654, ack 26, win 502, length 1040: HTTP
03:09:10.758773 IP 100.xxx.xxx.209.http > acs-tcpdump-7d959bxxxxx-xxxxx.35656: Flags [P.], seq 26:243, ack 1654, win 66, length 217: HTTP: HTTP/1.1 200 OK
03:09:10.758786 IP acs-tcpdump-7d959bxxxxx-xxxxx.35656 > 100.xxx.xxx.209.http: Flags [.], ack 243, win 501, length 0
03:09:10.758854 IP acs-tcpdump-7d959bxxxxx-xxxxx.50624 > 100.xxx.xxx.112.http: Flags [F.], seq 318721902, ack 4047870907, win 501, length 0
03:09:10.763400 IP 100.xxx.xxx.112.http > acs-tcpdump-7d959bxxxxx-xxxxx.50624: Flags [F.], seq 1, ack 1, win 83, length 0
03:09:10.763413 IP acs-tcpdump-7d959bxxxxx-xxxxx.50624 > 100.xxx.xxx.112.http: Flags [.], ack 2, win 501, length 0
03:09:11.219397 IP acs-tcpdump-7d959bxxxxx-xxxxx.50638 > 100.xxx.xxx.112.http: Flags [P.], seq 2989834529:2989835691, ack 1755317949, win 501, length 1162: HTTP: POST /logstores/memory-metrics/shards/lb HTTP/1.1
03:09:11.219451 IP acs-tcpdump-7d959bxxxxx-xxxxx.50644 > 100.xxx.xxx.112.http: Flags [P.], seq 1733121609:1733122681, ack 40604405, win 501, length 1072: HTTP: POST /logstores/disk-metrics/shards/lb HTTP/1.1
The ephemeral container contains the OSSUtil tool. You can specify the
-w packets.pcapparameter of tcpdump to generate packets and then use OSSUtil to upload the captured packets to OSS. This way, you can download the packet files from OSS and analyze them on your local machine.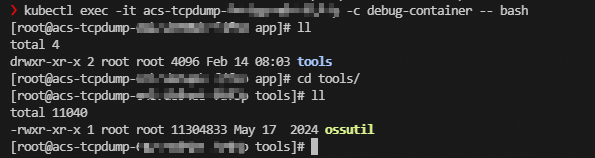 Note
NoteIn this example, the ephemeral container contains a counter that counts down
3600seconds. After packet capturing is verified, you can wait to automatically exit the ephemeral container or manually delete the corresponding pod. Perform this operation during off-peak hours in case your businesses are interrupted.
References
The following code block shows the content of the Dockerfile of the ephemeral container.
FROM alibaba-cloud-linux-3-registry.cn-hangzhou.cr.aliyuncs.com/alinux3/alinux3:latest

# Update system software.
RUN dnf update --security -y && dnf upgrade --security -y && dnf clean all && rm -rf /var/cache/dnf/ && rm -rf /core.*
# Install the required network tools.
RUN yum install net-tools iputils tcpdump wget iproute bind-utils nmap-ncat procps-ng -y && yum update -y
# Install the required kernel analysis and trace tools.
RUN yum install perf sysak strace trace-cmd -y && yum clean all && rm -rf /var/cache/yum/

# Install tools for debugging Kubernetes.
# osscmd
COPY tools/ossutil64 /home/app/tools/ossutil

# Specify the working directory.
WORKDIR /home/app

ENTRYPOINT ["/bin/bash","-c","sleep 3600"]