Relying on simple traffic allocation, traditional load balancing for large language model (LLM) inference services in a Kubernetes cluster is often inadequate for handling their complex requests and dynamic traffic loads. This topic explains how to use the Gateway with Inference Extension component to configure inference service extensions for intelligent routing and efficient traffic management.
Background
Large language model (LLM)
A Large Language Model (LLM) is a neural network language model with hundreds of millions or more parameters, such as GPT, Qwen, and Llama. These models are trained on massive and diverse datasets that include vast amounts of web text, professional books, and code. They are typically used for generative text tasks, such as text completion and dialogue.
When building LLM-based applications, you can generate text in two ways:
You can use external LLM API services from platforms such as OpenAI, Alibaba Cloud Model Studio, or Moonshot.
You can also build an LLM inference service by using open-source or self-developed large models and an inference framework such as vLLM, and deploy it in a Kubernetes cluster. This approach is ideal when you want full control over the LLM inference service or require highly customized inference capabilities.
vLLM
vLLM is an efficient, easy-to-use, and popular framework for building LLM inference services that supports a variety of common large language models, including Qwen. With optimization techniques such as PagedAttention, continuous batching, and model quantization, vLLM provides high inference performance for large language models.
KV cache
Procedure
The following diagram illustrates the workflow.

-
On the inference-gateway, port 8080 uses a standard HTTP route to forward requests to the backend inference service. Port 8081 routes requests through the LLM Route extension, which in turn forwards them to the same service.
-
Within an HTTP route, you use an
InferencePoolresource to declare a group of LLM inference service workloads and anInferenceModelresource to specify the traffic distribution policy for a model in thatInferencePool. This configuration routes requests from port 8081 of the inference-gateway to the specified LLM inference service workloads by using a load balancing algorithm that is enhanced for inference services.
Prerequisites
You have an ACK managed cluster with a GPU node pool. You can also install the ACK Virtual Node component in the ACK managed cluster to use ACS GPU computing power.
Procedure
Step 1: Deploy sample inference service
-
Create a file named vllm-service.yaml with the following content.
NoteFor this image, we recommend using A10 cards in ACK clusters and L20 (GN8IS) cards in Alibaba Cloud Container Compute Service.
Additionally, because LLM images are large, we recommend pushing them to Container Registry and pulling them using an internal address. Pulling an image directly from the public network can be slow, as the speed is limited by the cluster's elastic IP address (EIP) bandwidth.
-
Deploy the sample inference service.
kubectl apply -f vllm-service.yaml
Step 2: Install the Gateway with Inference Extension component
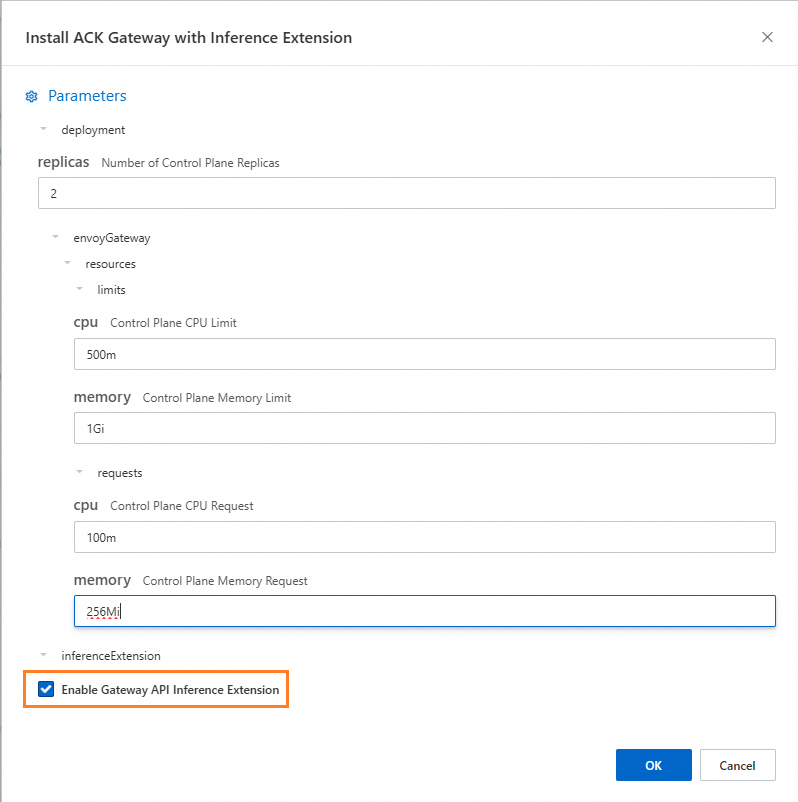
or Install the Gateway with Inference Extension component, and make sure Enable Gateway API Inference Extension (Requires a deployed inference service) is selected.
Step 3: Deploy inference routing
This step creates the InferencePool and InferenceModel resources.
-
Create the
inference-pool.yamlfile.apiVersion: inference.networking.x-k8s.io/v1alpha2 kind: InferencePool metadata: name: vllm-qwen-pool spec: targetPortNumber: 8000 selector: app: qwen extensionRef: name: inference-gateway-ext-proc --- apiVersion: inference.networking.x-k8s.io/v1alpha2 kind: InferenceModel metadata: name: inferencemodel-qwen spec: modelName: /model/qwen criticality: Critical poolRef: group: inference.networking.x-k8s.io kind: InferencePool name: vllm-qwen-pool targetModels: - name: /model/qwen weight: 100 -
Deploy the inference routing.
kubectl apply -f inference-pool.yaml
Step 4: Deploy and verify the gateway
In this step, you create a gateway that listens on ports 8080 and 8081.
-
Create a file named
inference-gateway.yaml.apiVersion: gateway.networking.k8s.io/v1 kind: GatewayClass metadata: name: qwen-inference-gateway-class spec: controllerName: gateway.envoyproxy.io/gatewayclass-controller --- apiVersion: gateway.networking.k8s.io/v1 kind: Gateway metadata: name: qwen-inference-gateway spec: gatewayClassName: qwen-inference-gateway-class listeners: - name: http protocol: HTTP port: 8080 - name: llm-gw protocol: HTTP port: 8081 --- apiVersion: gateway.networking.k8s.io/v1 kind: HTTPRoute metadata: name: qwen-backend spec: parentRefs: - name: qwen-inference-gateway sectionName: llm-gw rules: - backendRefs: - group: inference.networking.x-k8s.io kind: InferencePool name: vllm-qwen-pool matches: - path: type: PathPrefix value: / --- apiVersion: gateway.networking.k8s.io/v1 kind: HTTPRoute metadata: name: qwen-backend-no-inference spec: parentRefs: - group: gateway.networking.k8s.io kind: Gateway name: qwen-inference-gateway sectionName: http rules: - backendRefs: - group: "" kind: Service name: qwen port: 8000 weight: 1 matches: - path: type: PathPrefix value: / --- apiVersion: gateway.envoyproxy.io/v1alpha1 kind: BackendTrafficPolicy metadata: name: backend-timeout spec: timeout: http: requestTimeout: 1h targetRef: group: gateway.networking.k8s.io kind: Gateway name: qwen-inference-gateway -
Deploy the gateway.
kubectl apply -f inference-gateway.yamlThis configuration creates a namespace named
envoy-gateway-systemand a service namedenvoy-default-inference-gateway-645xxxxxin the cluster. -
Get the public IP address of the gateway.
export GATEWAY_HOST=$(kubectl get gateway/qwen-inference-gateway -o jsonpath='{.status.addresses[0].value}') -
Verify that the gateway routes requests to the inference service using standard HTTP routing on port 8080.
curl -X POST ${GATEWAY_HOST}:8080/v1/chat/completions -H 'Content-Type: application/json' -d '{
    "model": "/model/qwen",
    "max_completion_tokens": 100,
    "temperature": 0,
    "messages": [
      {
        "role": "user",
        "content": "Write as if you were a critic: San Francisco"
      }
    ]
}'
Expected output:
{"id":"chatcmpl-aa6438e2-d65b-4211-afb8-ae8e76e7a692","object":"chat.completion","created":1747191180,"model":"/model/qwen","choices":[{"index":0,"message":{"role":"assistant","reasoning_content":null,"content":"San Francisco, a city that has long been a beacon of innovation, culture, and diversity, continues to captivate the world with its unique charm and character. As a critic, I find myself both enamored and occasionally perplexed by the city's multifaceted personality.\n\nSan Francisco's architecture is a testament to its rich history and progressive spirit. The iconic cable cars, Victorian houses, and the Golden Gate Bridge are not just tourist attractions but symbols of the city's enduring appeal. However, the","tool_calls":[]},"logprobs":null,"finish_reason":"length","stop_reason":null}],"usage":{"prompt_tokens":39,"total_tokens":139,"completion_tokens":100,"prompt_tokens_details":null},"prompt_logprobs":null} -
Verify that the gateway routes requests to the inference service using the inference service extension on port 8081.
curl -X POST ${GATEWAY_HOST}:8081/v1/chat/completions -H 'Content-Type: application/json' -d '{
    "model": "/model/qwen",
    "max_completion_tokens": 100,
    "temperature": 0,
    "messages": [
      {
        "role": "user",
        "content": "Write as if you were a critic: Los Angeles"
      }
    ]
}'
Expected output:
{"id":"chatcmpl-cc4fcd0a-6a66-4684-8dc9-284d4eb77bb7","object":"chat.completion","created":1747191969,"model":"/model/qwen","choices":[{"index":0,"message":{"role":"assistant","reasoning_content":null,"content":"Los Angeles, the sprawling metropolis often referred to as \"L.A.,\" is a city that defies easy description. It is a place where dreams are made and broken, where the sun never sets, and where the line between reality and fantasy is as blurred as the smog that often hangs over its valleys. As a critic, I find myself both captivated and perplexed by this city that is as much a state of mind as it is a physical place.\n\nOn one hand, Los","tool_calls":[]},"logprobs":null,"finish_reason":"length","stop_reason":null}],"usage":{"prompt_tokens":39,"total_tokens":139,"completion_tokens":100,"prompt_tokens_details":null},"prompt_logprobs":null}
(Optional) Step 5: Configure observability metrics and dashboard
You must enable and configure Managed Service for Prometheus for your cluster, which may incur additional fees.
-
You can add Prometheus annotations to the vLLM service pod to enable metric collection. A Prometheus instance can then use its default service discovery mechanism to scrape vLLM service metrics and monitor the service's internal state.
...
annotations:
  prometheus.io/path: /metrics # The HTTP path where metrics are exposed.
  prometheus.io/port: "8000" # The port for exposing metrics, which is the listening port of the vLLM server.
  prometheus.io/scrape: "true" # Whether to scrape metrics from the current pod.
...
The following table describes some of the monitoring metrics provided by the vLLM service:
Metric
Description
vllm:gpu_cache_usage_perc
The percentage of the GPU cache used by vLLM. When vLLM starts, it preemptively allocates as much GPU video memory as possible for the KV cache. For a vLLM server, lower utilization means the GPU has enough space for new requests.
vllm:request_queue_time_seconds_sum
The total time requests spend in the waiting queue. After an LLM inference request arrives at the vLLM server, it might not be processed immediately. Instead, it must wait to be scheduled by the vLLM scheduler for prefill and decode.
vllm:num_requests_running
vllm:num_requests_waiting
vllm:num_requests_swapped
The number of requests currently running, waiting, or swapped to memory. You can use these metrics to assess the current request load on the vLLM service.
vllm:avg_generation_throughput_toks_per_s
vllm:avg_prompt_throughput_toks_per_s
The number of tokens consumed per second during the prefill stage and the number of tokens generated per second during the decode stage.
vllm:time_to_first_token_seconds_bucket
The latency between sending a request to the vLLM service and receiving the first token. Commonly known as Time to First Token (TTFT), this metric measures the time between a client sending a request and receiving the first part of the response. TTFT is a critical indicator of the LLM user experience.
You can set up alert rules based on these metrics to monitor the vLLM service and detect anomalies in real time.
-
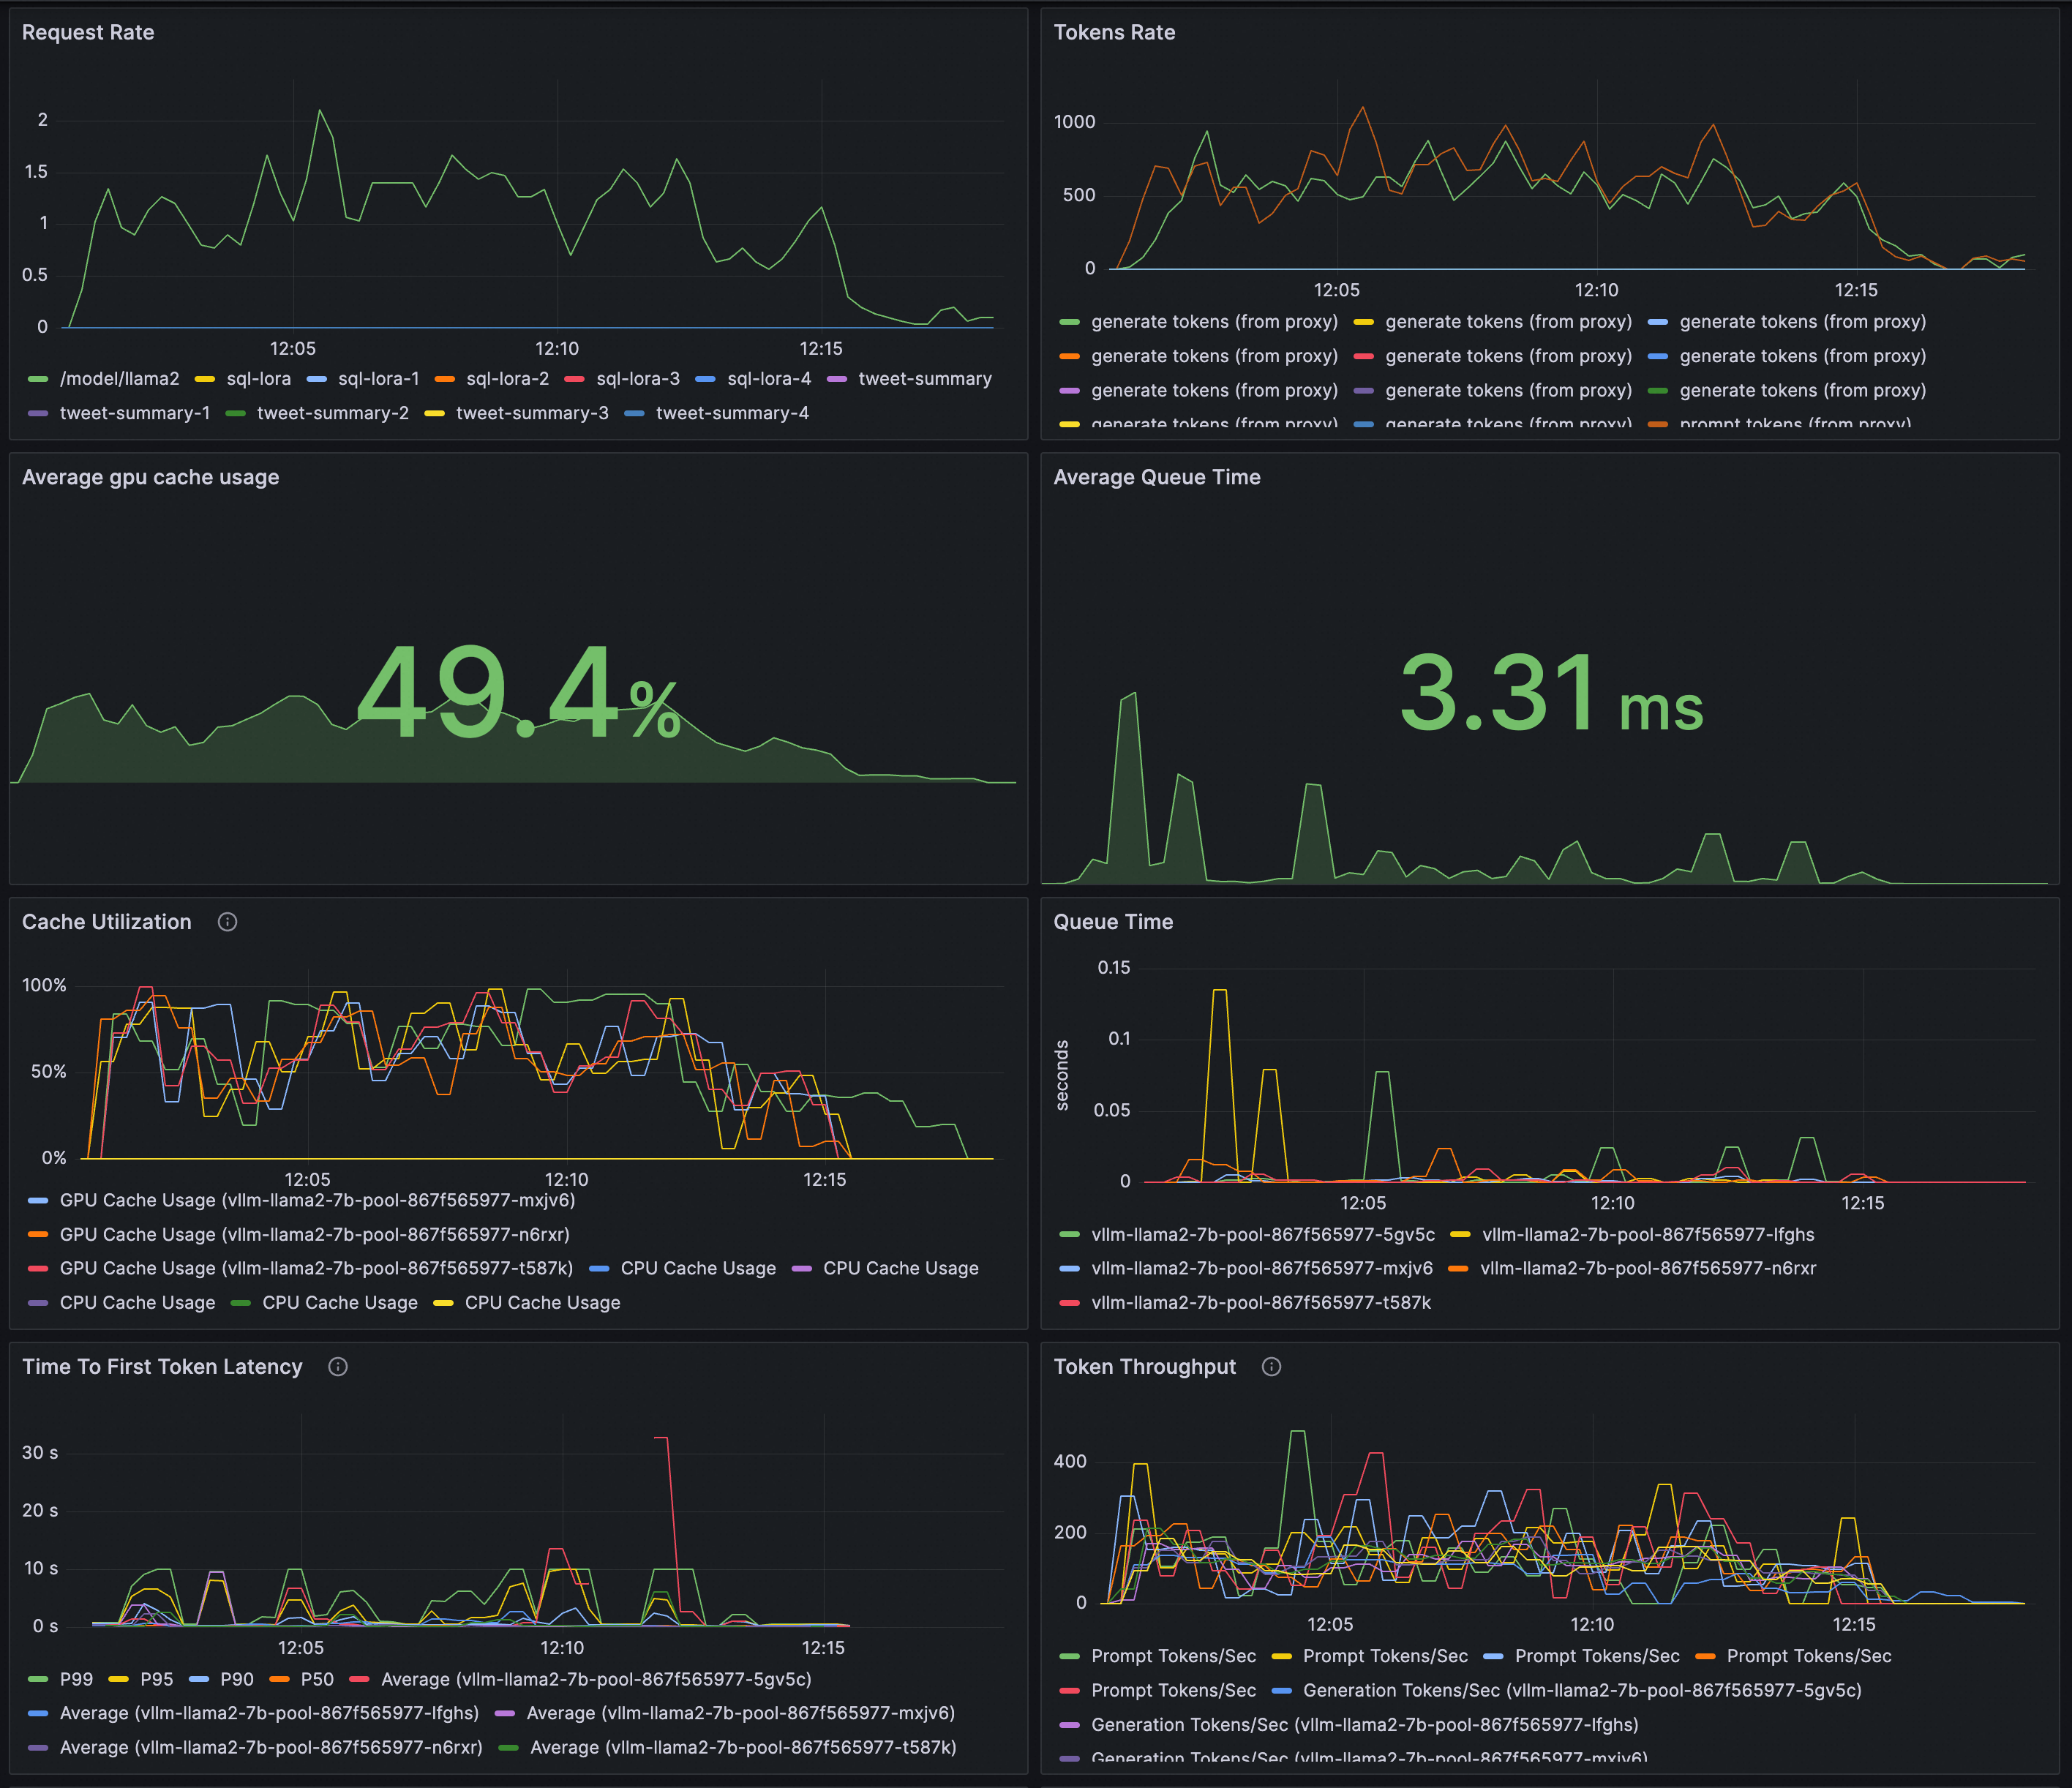
Configure a Grafana dashboard for real-time monitoring of the LLM inference service. You can use this dashboard to:
-
Monitor the request rate and total token throughput of the LLM service.
-
Monitor the internal state of the inference workload.
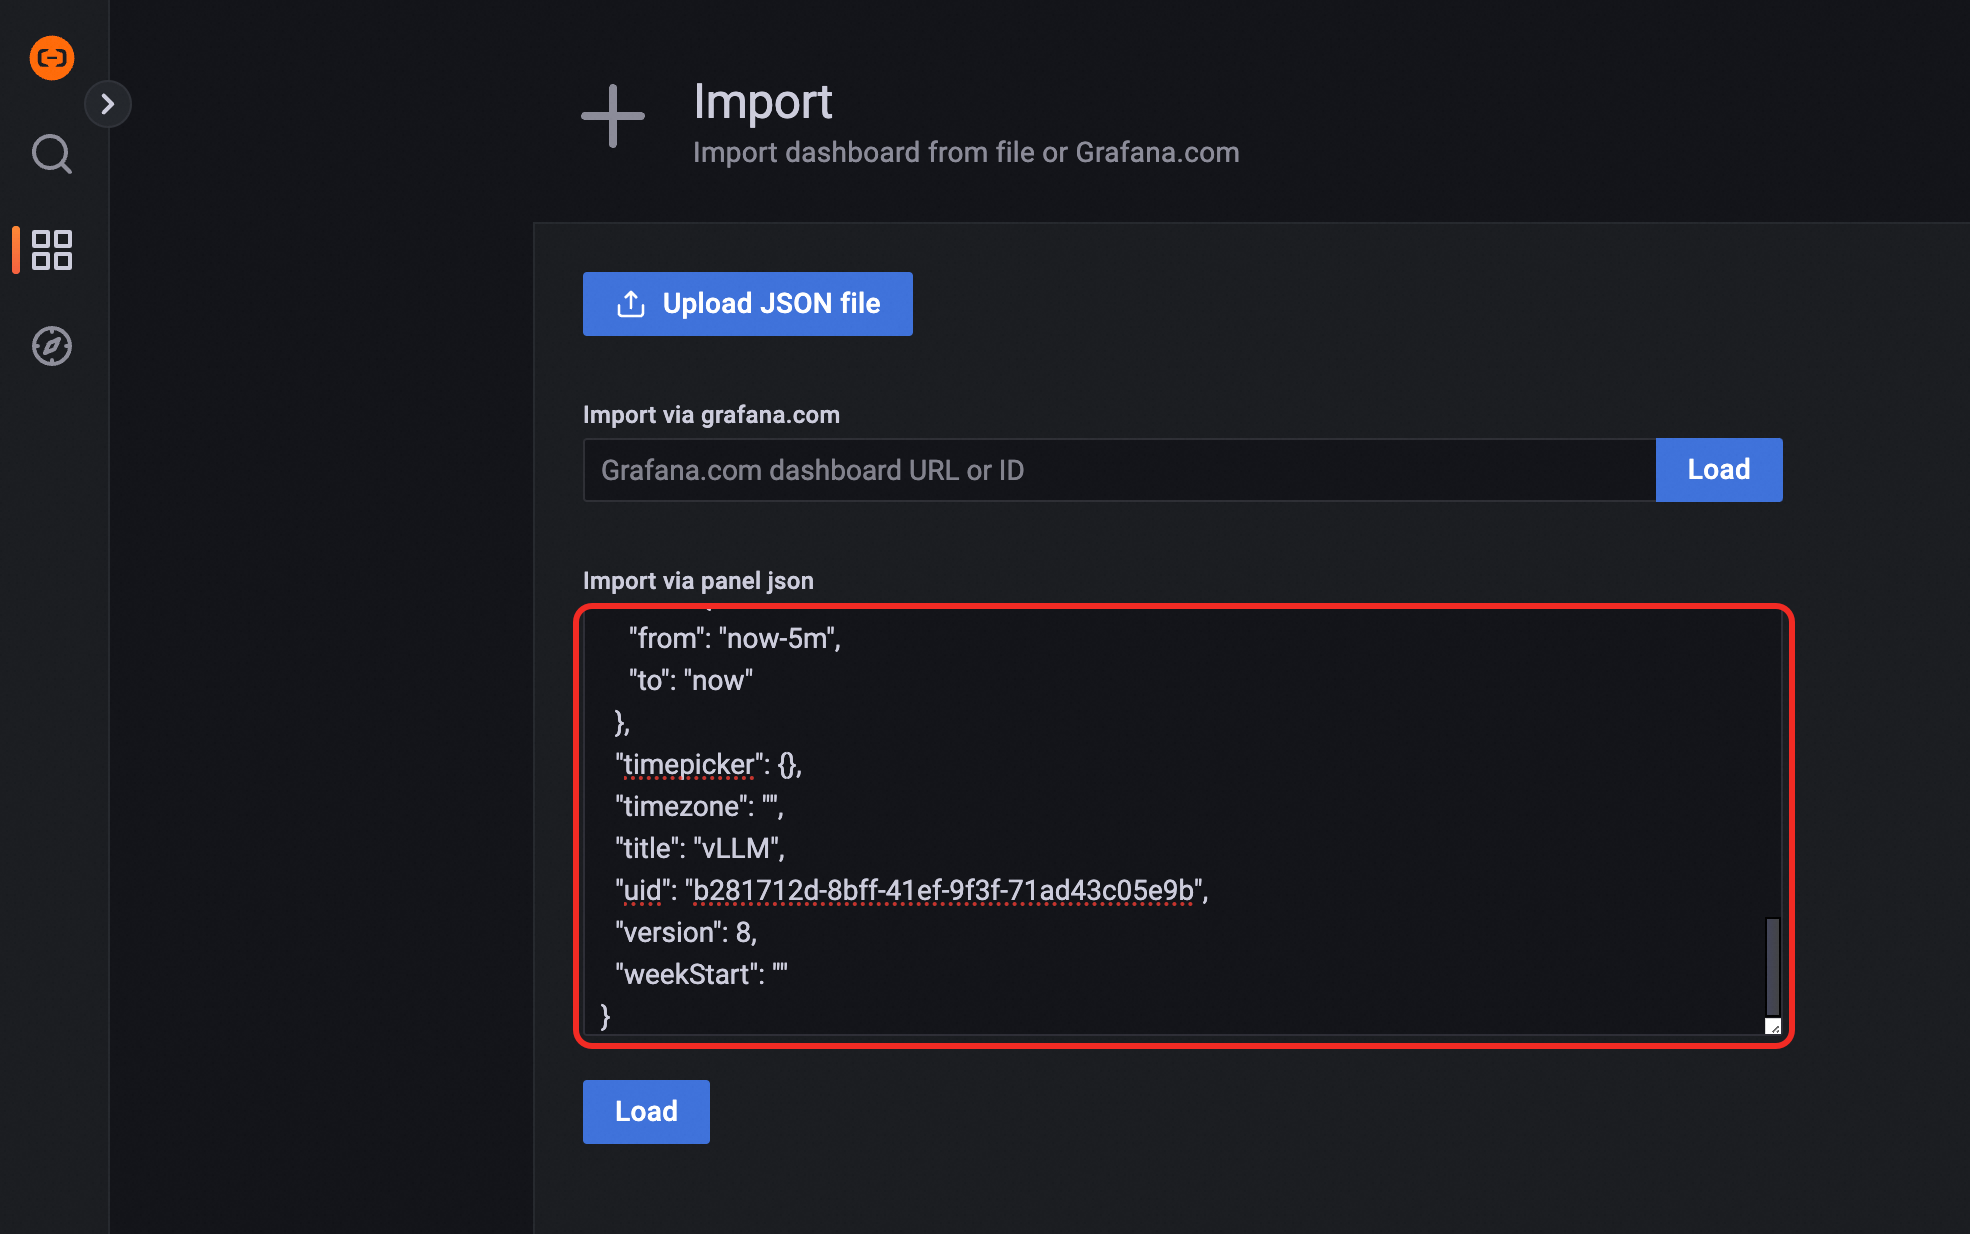
Ensure that the Prometheus instance used as the data source for Grafana has collected the vLLM monitoring metrics. To create the dashboard, import the following JSON content into Grafana.
Preview:
-
-
In an ACK cluster, use vllm benchmark to stress test the inference service and compare the load balancing of an HTTP Route and an LLM Route.
-
Deploy the benchmark workload.
kubectl apply -f- <<EOF apiVersion: apps/v1 kind: Deployment metadata: labels: app: vllm-benchmark name: vllm-benchmark namespace: default spec: progressDeadlineSeconds: 600 replicas: 1 revisionHistoryLimit: 10 selector: matchLabels: app: vllm-benchmark strategy: rollingUpdate: maxSurge: 25% maxUnavailable: 25% type: RollingUpdate template: metadata: creationTimestamp: null labels: app: vllm-benchmark spec: containers: - command: - sh - -c - sleep inf image: registry-cn-hangzhou.ack.aliyuncs.com/dev/llm-benchmark:random-and-qa imagePullPolicy: IfNotPresent name: vllm-benchmark resources: {} terminationMessagePath: /dev/termination-log terminationMessagePolicy: File dnsPolicy: ClusterFirst restartPolicy: Always schedulerName: default-scheduler securityContext: {} terminationGracePeriodSeconds: 30 EOF -
Start the stress test.
-
Get the internal IP address of the Gateway.
export GW_IP=$(kubectl get svc -n envoy-gateway-system -l gateway.envoyproxy.io/owning-gateway-namespace=default,gateway.envoyproxy.io/owning-gateway-name=qwen-inference-gateway -o jsonpath='{.items[0].spec.clusterIP}') -
Run the stress test.
HTTP route
kubectl exec -it deploy/vllm-benchmark -- env GW_IP=${GW_IP} python3 /root/vllm/benchmarks/benchmark_serving.py \
--backend vllm \
--model /models/DeepSeek-R1-Distill-Qwen-7B \
--served-model-name /model/qwen \
--trust-remote-code \
--dataset-name random \
--random-prefix-len 10 \
--random-input-len 1550 \
--random-output-len 1800 \
--random-range-ratio 0.2 \
--num-prompts 3000 \
--max-concurrency 200 \
--host $GW_IP \
--port 8080 \
--endpoint /v1/completions \
--save-result \
2>&1 | tee benchmark_serving.txt
LLM route
kubectl exec -it deploy/vllm-benchmark -- env GW_IP=${GW_IP} python3 /root/vllm/benchmarks/benchmark_serving.py \
--backend vllm \
--model /models/DeepSeek-R1-Distill-Qwen-7B \
--served-model-name /model/qwen \
--trust-remote-code \
--dataset-name random \
--random-prefix-len 10 \
--random-input-len 1550 \
--random-output-len 1800 \
--random-range-ratio 0.2 \
--num-prompts 3000 \
--max-concurrency 200 \
--host $GW_IP \
--port 8081 \
--endpoint /v1/completions \
--save-result \
2>&1 | tee benchmark_serving.txt
-
After completing both tests, view the dashboard to compare the routing performance of the HTTP Route and the LLM Route.
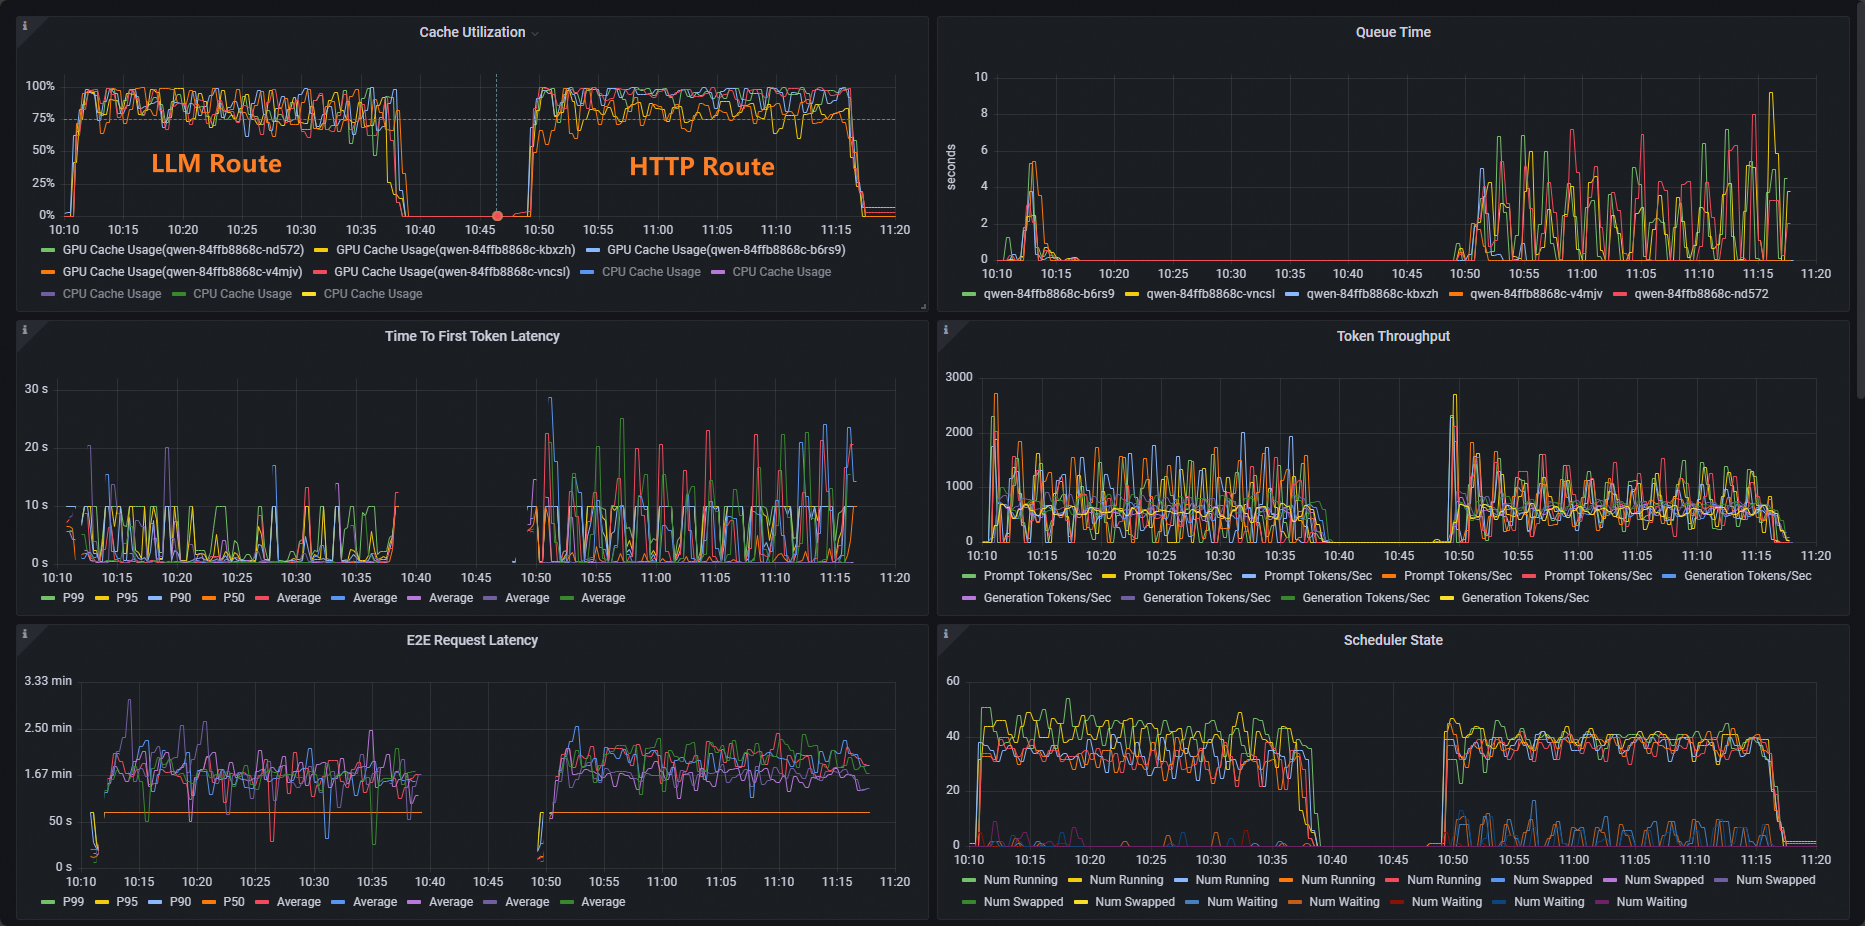
The dashboard shows that HTTP Route workloads have an uneven distribution of Cache Utilization, whereas LLM Route workloads have a normal distribution.
-
Related operations
supports different load balancing strategies for various inference service use cases. To configure the load balancing strategy for inference requests routed to pods in an InferencePool, add the inference.networking.x-k8s.io/routing-strategy annotation to the InferencePool resource.
The following example uses the app: vllm-app selector to select inference service pods and sets the load balancing strategy to the default, metrics-based strategy.
apiVersion: inference.networking.x-k8s.io/v1alpha2
kind: InferencePool
metadata:
  name: vllm-app-pool
  annotations:
    inference.networking.x-k8s.io/routing-strategy: "DEFAULT"
spec:
  targetPortNumber: 8000
  selector:
    app: vllm-app
  extensionRef:
    name: inference-gateway-ext-proc
The following load balancing strategies are supported:
|
Strategy |
Description |
|
DEFAULT |
A metrics-based load balancing strategy. This strategy evaluates the internal state of inference servers using multi-dimensional metrics, such as request queue length and GPU cache utilization. It then distributes traffic across multiple inference server workloads based on this state. |
|
PREFIX_CACHE |
A load balancing strategy that uses request prefix matching. This strategy attempts to route requests that share a common prefix to the same inference server pod. This strategy is ideal for scenarios with a high volume of requests that share a prefix, especially when the inference server has auto prefix caching enabled. Typical use cases include:
|