By default, Horizontal Pod Autoscaler (HPA) supports only auto scaling based on CPU utilization and memory usage. This cannot meet O&M requirements. Managed Service for Prometheus is a fully managed monitoring service interfaced with the open source Prometheus ecosystem. Managed Service for Prometheus monitors a wide array of components and provides multiple predefined dashboards. This topic describes how to convert Managed Service for Prometheus metrics to metrics that are supported by HPA. This enables HPA to scale applications based on these metrics.
Prerequisites
The Managed Service for Prometheus component is installed. For more information, see Use Managed Service for Prometheus to monitor ACS clusters.
Procedure
Deploy ack-alibaba-cloud-metrics-adapter
Log on to the ACS console. In the left-side navigation pane, click Clusters.
On the Clusters page, find the cluster that you want to manage and click its ID. In the left-side navigation pane of the cluster details page, choose .
On the Helm page, click Deploy in the upper-left corner.
In the Deploy panel, search for ack-alibaba-cloud-metrics-adapter in the Chart section, and then click Next.
On the Parameters page, select a chart version, configure the required parameters, and click OK.
On the Helm page, you can find that ack-alibaba-cloud-metrics-adapter is deployed in the cluster.
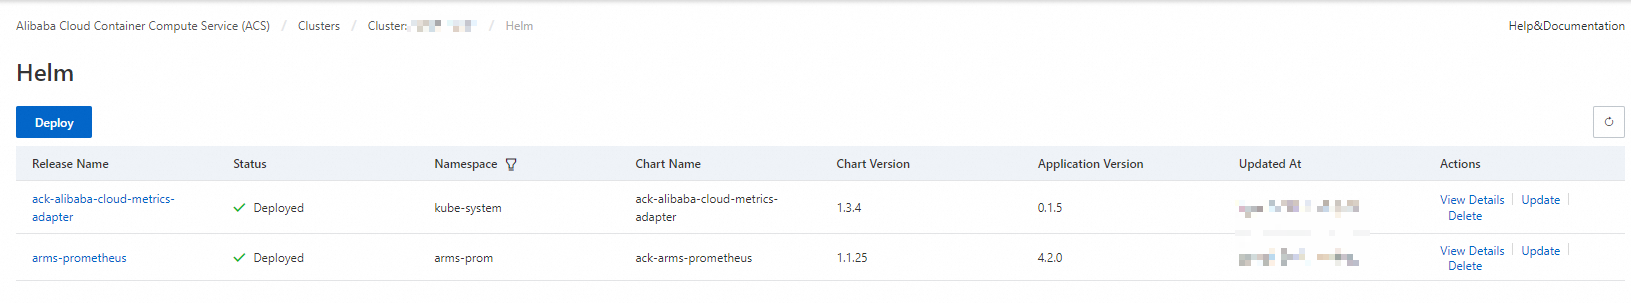
On the Helm page, find ack-alibaba-cloud-metrics-adapter in the Release Name column and click Update in the Actions column.
Replace the parameters in the template with the following content and click OK.
  ......
  prometheus:
  	enabled: true
    # Specify the endpoint of Managed Service for Prometheus.
    url: https://cn-beijing.arms.aliyuncs.com:9443/api/v1/prometheus/xxxx/xxxx/xxxx/cn-beijing
  	# If token-based authentication is enabled for Managed Service for Prometheus, configure the Authorization field of the prometheusHeader parameter.
    prometheusHeader:
    	Authorization: xxxxxxx
    adapter:
      rules:
        custom:
        # Add a conversion rule. Make sure that the labels of the Managed Service for Prometheus metrics are the same as the labels that are specified in the conversion rule. If the labels are different, modify the labels of the Managed Service for Prometheus metrics.
        - seriesQuery: http_requests_total{namespace!="",pod!=""}
          resources:
            overrides:
              # The resource field specifies an API resource of Kubernetes. You can run the kubectl api-resources -o wide command to view Kubernetes API resources.
              # The key field specifies the LabelName of the Prometheus Service metric. Make sure that the Prometheus Service metric uses the specified LabelName.
              namespace: {resource: "namespace"}
              pod: {resource: "pod"}
          name:
            matches: ^(.*)_total
            as: ${1}_per_second
          metricsQuery: sum(rate(<<.Series>>{<<.LabelMatchers>>}[2m])) by (<<.GroupBy>>)
        default: false
    enabled: true    # Set the enabled field to true to enable the Prometheus adapter.
    ......
Parameter
Description
AlibabaCloudMetricsAdapter.prometheus.urlThe endpoint of Managed Service for Prometheus.
For more information about how to obtain the endpoint, see the Obtain the endpoint of the Prometheus API section of this topic.
AlibabaCloudMetricsAdapter.prometheus.prometheusHeader.AuthorizationThe token.
For more information about how to obtain the token, see the Obtain the endpoint of the Prometheus API section of this topic.
AlibabaCloudMetricsAdapter.prometheus.adapter.rules.customModify this parameter based on the following YAML template.
AlibabaCloudMetricsAdapter.prometheus.adapter.rules.defaultSpecifies whether to create predefined metrics. By default, the predefined metrics are created. We recommend that you use the default value
false.NoteFor more information about the configuration file of ack-alibaba-cloud-adapter, see the Configuration file of ack-alibaba-cloud-adapter section of this topic.
Deploy sample applications
Log on to the ACS console. In the left-side navigation pane, click Clusters.
On the Clusters page, find the cluster that you want to manage and click its ID. In the left-side navigation pane of the cluster details page, choose .
In the upper-right corner of the Deployments page, click Create from YAML.
On the Create page, copy the following YAML template to the code editor and click Create to create an application named sample-app and a Service.
NoteThe application pod is used to expose the http_requests_total metric, which indicates the number of requests.
Create a ServiceMonitor
Log on to the ARMS console.
In the left-side navigation pane, click Integration Center. On the page that appears, enter Custom Metric Collection in the search box and click Custom Metric Collection.
On the Start Integration tab, select Kubernetes Environment, and then select an Alibaba Cloud Container Compute Service (ACS) cluster.
Configure the parameters in the Configuration Information section, and then click OK. The following table describes the parameters.
Parameter
Example
Name
sample-app
Service Discovery Method
ServiceMonitor
Namespace
default
Port Name
http
Metric Collection Path
/metrics
Collection Interval (seconds)
30
Label Matching
app
sample-app
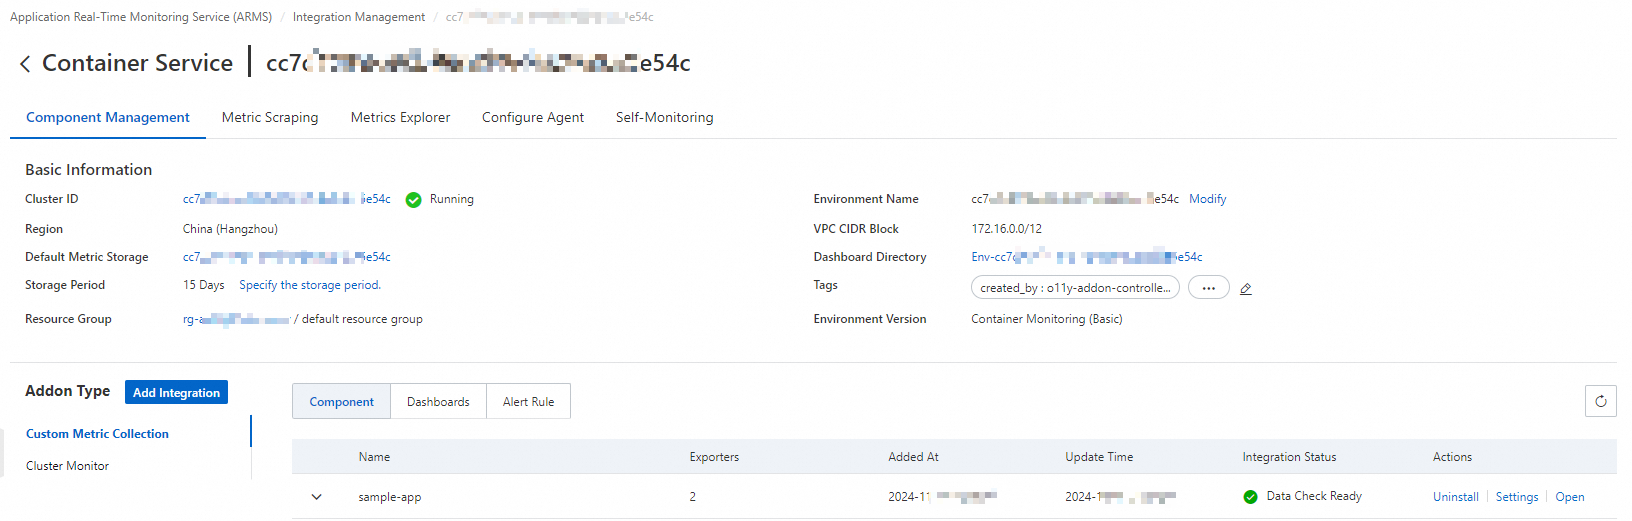
Wait until the Integration Status Check is complete. If the message The component has been integrated and being monitored appears, the integration is complete.
Click Integration Management to check the monitoring status. The following figure shows the results.
Configuration file of ack-alibaba-cloud-adapter
In the preceding example, the http_requests_total metric that is exposed by the sample-app pod is converted to the http_requests_per_second metric for HPA. The following code block shows the configurations of ack-alibaba-cloud-adapter that is used in the example:
- seriesQuery: http_requests_total{namespace!="",pod!=""}
  resources:
    overrides:
      namespace: {resource: "namespace"}
      pod: {resource: "pod"}
  name:
    matches: ^(.*)_total
    as: ${1}_per_second
  metricsQuery: sum(rate(<<.Series>>{<<.LabelMatchers>>}[2m])) by (<<.GroupBy>>)
Parameter | Description |
| The Prometheus Query Language (PromQL) query data. |
| Aggregates the PromQL query data in |
| Labels in the PromQL query data, which are matched against resource objects. The resource objects are API resources in the cluster, such as pods and namespaces. You can run the |
| Uses a regular expression to convert the name of the Prometheus metric to a name that is easy to identify. In this example, the metric name is converted from |
Discovery: discovers Prometheus metrics that can be used by ack-alibaba-cloud-adapter.
Specify the Prometheus metric that you want to convert. You can use seriesFilters to filter metrics. You can use seriesQuery to search metrics by label, as shown in the following code block:
seriesQuery: http_requests_total{namespace!="",pod!=""} seriesFilters: - isNot: "^container_.*_seconds_total"NoteseriesFilters is optional. You can use seriesFilters to filter metrics.
is: matches metrics that contain <regex>.
isNot: matches metrics that do not contain <regex>.
Association: associates the metrics with Kubernetes resources, such as pods and namespaces.
Map the labels of Prometheus metrics to Kubernetes resources. The labels of the
http_requests_totalmetric includenamespace!=""andpod!="".- seriesQuery: http_requests_total{namespace!="",pod!=""} resources: overrides: namespace: {resource: "namespace"} pod: {resource: "pod"}Naming: defines the names of the metrics that can be used by the HPA after conversion.
Name the HPA metrics that are converted from Prometheus metrics. The names of the Prometheus metrics remain unchanged. You do not need to configure the naming settings if you directly use Prometheus metrics.
NoteYou can run the
kubectl get --raw "/apis/custom.metrics.k8s.io/v1beta1"command to query the metrics that are supported by HPA.- seriesQuery: http_requests_total{namespace!="",pod!=""} resources: overrides: namespace: {resource: "namespace"} pod: {resource: "pod"} name: matches: "^(.*)_total" as: "${1}_per_second"Querying: defines the template of the requests that are sent to the Managed Service for Prometheus API.
The template of requests that are sent to the Managed Service for Prometheus API. ack-alibaba-cloud-adapter passes parameters in the HPA to the request template, sends a request to the Managed Service for Prometheus API based on the template, and then sends the returned parameter values to the HPA for auto scaling.
- seriesQuery: http_requests_total{namespace!="",pod!=""} resources: overrides: namespace: {resource: "namespace"} pod: {resource: "pod"} name: matches: ^(.*)_total as: ${1}_per_second metricsQuery: sum(rate(<<.Series>>{<<.LabelMatchers>>}[2m])) by (<<.GroupBy>>)
Obtain the endpoint of the Prometheus API
Managed Service for Prometheus
Log on to the ARMS console.
In the left-side navigation pane, choose .
In the upper-left corner of the Managed Service for Prometheus page, select the region where your ACS cluster is deployed and click the name of the corresponding Prometheus instance to go to the instance details page.
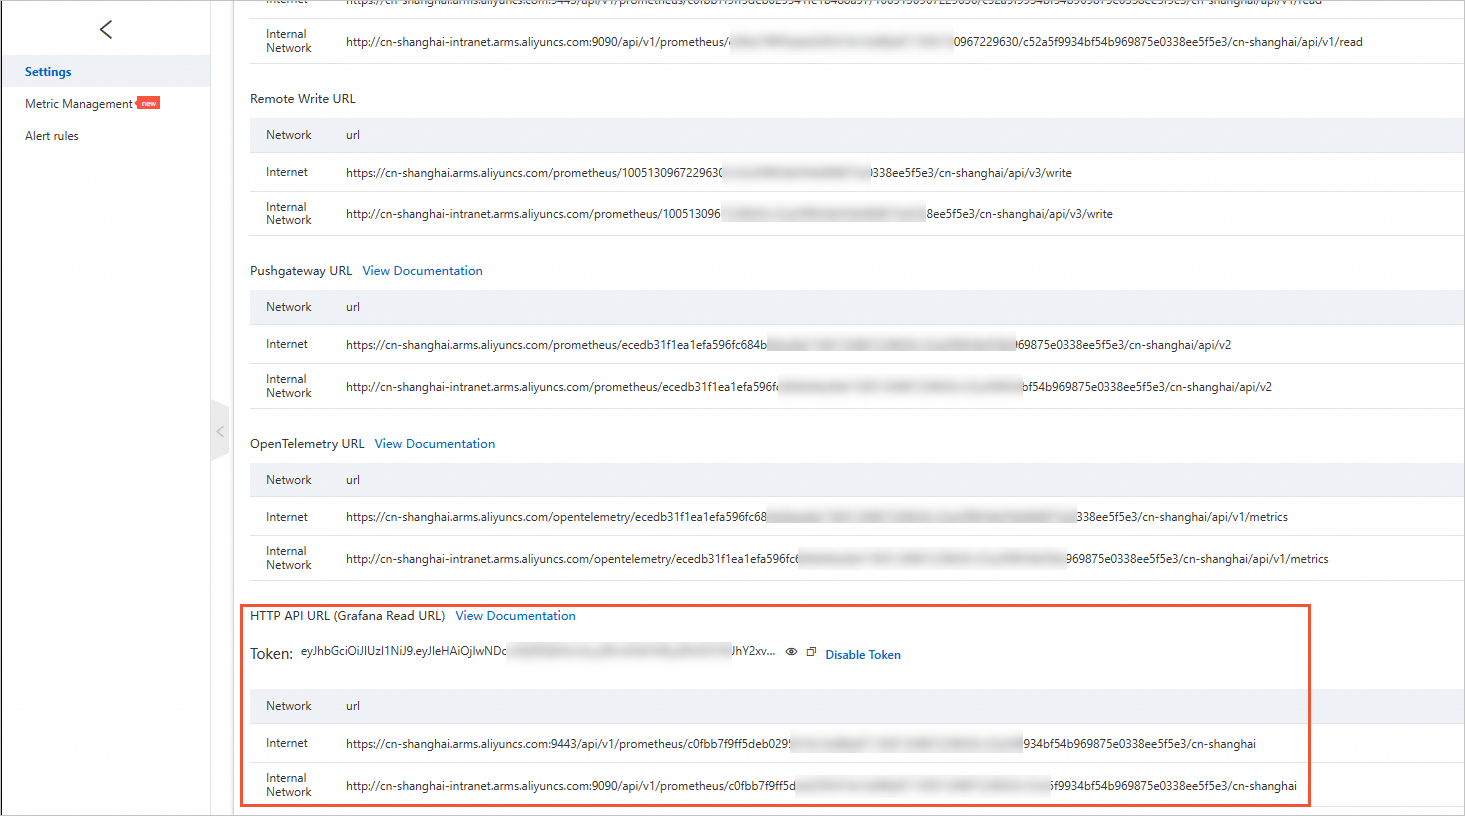
In the left-side navigation pane, click Settings. On the page that appears, click the Settings tab.
On the Settings tab, record the HTTP API endpoint and token. This endpoint is used to import monitoring data to Grafana.
We recommend that you call the Managed Service for Prometheus API over an internal network. You can call the API over the Internet if no internal network is available.
Open-source Prometheus
Deploy Managed Service for Prometheus.
Log on to the ACS console. In the left-side navigation pane, click Clusters.
On the Clusters page, find the cluster that you want to manage and click its ID. In the left-side navigation pane of the cluster details page, choose .
In the upper-left corner of the Helm page, click Deploy.
In the Deploy panel, search for ack-prometheus-operator in the Chart section, and click Next.
On the Parameters page, configure the parameters and click OK.
Check the deployment result.
Run the following command to map Prometheus in the cluster to local port 9090:
kubectl port-forward svc/ack-prometheus-operator-prometheus 9090:9090 -n monitoringEnter localhost:9090 in the address bar of a browser to visit the Prometheus page.
In the top navigation bar, choose to view all data collection tasks.
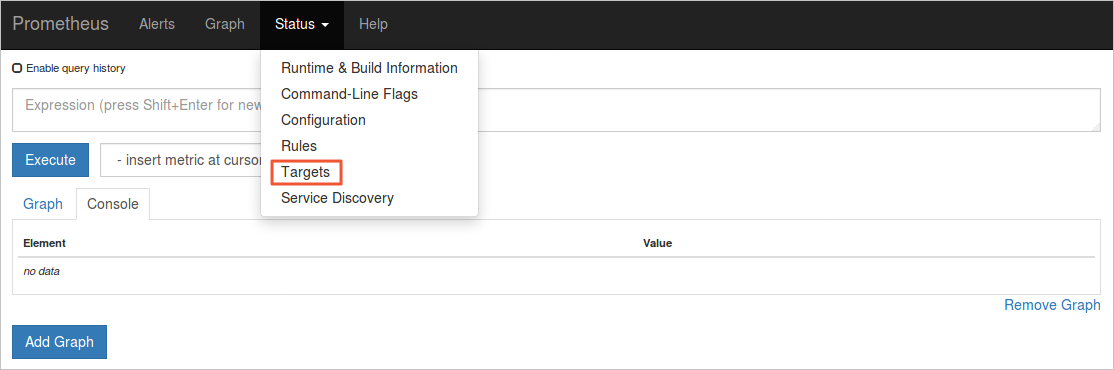 Tasks in the UP state are running as expected.
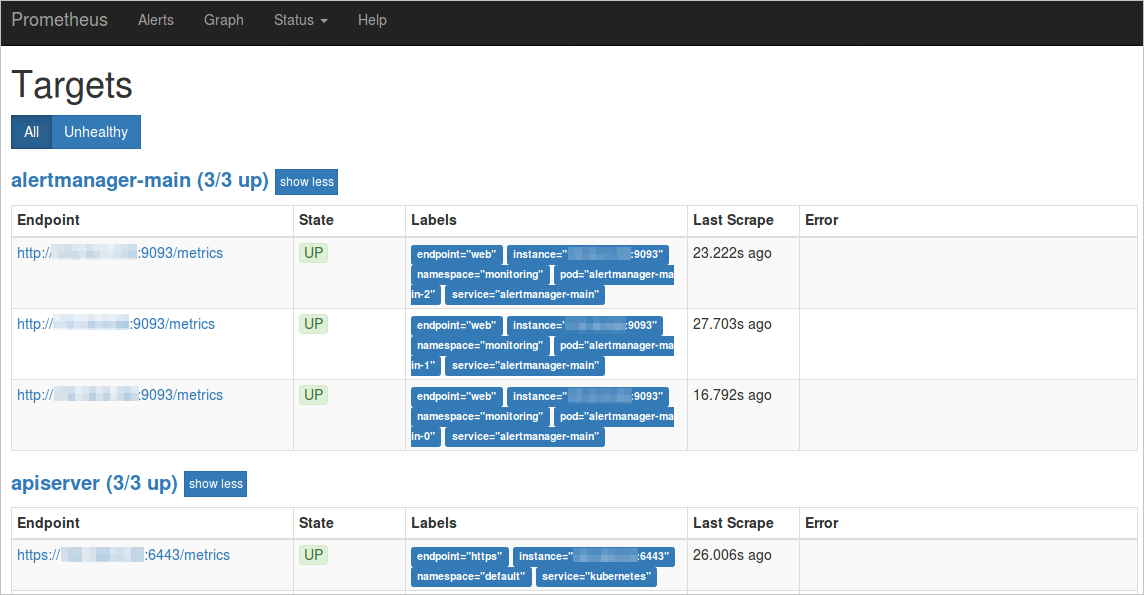
Check service and namespace in the Labels column.
The following sample code shows the endpoint of open source Prometheus if ServiceName is ack-prometheus-operator-prometheus and ServiceNamespace is monitoring:
http://ack-prometheus-operator-prometheus.monitoring.svc.cluster.local:9090