Alibaba Cloud Container Compute Service (ACS) supports Advanced Horizontal Pod Autoscaler (AHPA). AHPA analyzes historical data from Prometheus to predict future resource demand and dynamically adjusts the number of pod replicas. This ensures resources are scaled out and prefetched before traffic peaks, improving system responsiveness and stability. During predicted traffic troughs, AHPA also scales in resources to save costs.
Background information
The AHPA controller integrates with Managed Service for Prometheus to obtain and process historical metrics data for your application. This data forms the basis for predictive scaling decisions. Using machine learning algorithms, the AHPA controller forecasts the number of pod instances required in the next 24 hours, which is especially useful for handling workloads with cyclical patterns. By combining proactive and passive prediction strategies, the AHPA controller adjusts the number of pod instances to ensure resources are prefetched for upcoming traffic peaks. This approach enhances application responsiveness and performance while helping you manage costs and maintain service stability. For more information about AHPA, see AHPA overview.
Prerequisites
-
You have created an ACS cluster.
Managed Service for Prometheus is enabled. For more information, see Use Managed Service for Prometheus to monitor an ACS cluster.
Step 1: Install the AHPA controller
-
Log on to the ACS console. In the left navigation pane, click Clusters.
-
On the Clusters page, click the name of the target cluster. In the left navigation pane, click Add-ons.
On the Add-ons page, find the AHPA controller in the Others category and click Install.
Step 2: Configure Prometheus and integrate AHPA
Log on to the ARMS console.
-
In the left navigation pane, choose .
At the top of the Instances page, select the region where your Prometheus instance is deployed. Click the name of the target instance, which has the same name as your ACS cluster and an Instance Type of General. In the left-side navigation pane, click Settings. In the HTTP API Address (Grafana Read Address) section, record the values of the following parameters.
If a token is enabled, record the access token.
View and record the Internal Network endpoint (Prometheus URL).
Set the Prometheus query URL in the ACS cluster.
Create a file named application-intelligence.yaml with the following content.
prometheusUrl: The access endpoint of the ARMS Prometheus instance.token: The access token of the Prometheus instance.
apiVersion: v1 kind: ConfigMap metadata: name: application-intelligence namespace: kube-system data: prometheusUrl: "http://cn-hangzhou-intranet.arms.aliyuncs.com:9443/api/v1/prometheus/da9d7dece901db4c9fc7f5b9c40****/158120454317****/cc6df477a982145d986e3f79c985a****/cn-hangzhou" token: "eyJhxxxxx"NoteTo view the AHPA dashboard in Managed Service for Prometheus, you must also configure the following fields in this ConfigMap:
prometheus_writer_url: Set this to the remote write internal endpoint.prometheus_writer_ak: Set this to the AccessKey ID of your Alibaba Cloud account.prometheus_writer_sk: Set this to the AccessKey secret of your Alibaba Cloud account.
Run the following command to deploy application-intelligence.
kubectl apply -f application-intelligence.yaml
Integrate AHPA.
Log on to the ARMS console.
-
In the left navigation pane, choose .
In the top navigation bar, click Integrate Other Components. In the Integration Center, search for AHPA and click the AHPA card.
Integrate the AHPA component.
On the ACK AHPA page, choose Select Container Service Cluster > Select Cluster, and select the cluster that you want to integrate from the drop-down list.
Configure the parameters in the Configuration Information section based on the following table. Click OK.
Parameter
Description
Exporter name
A unique name for the AHPA exporter.
Metrics collection interval (seconds)
The interval at which monitoring data is collected.
After the Integration Status Check is complete, click Integration Management.
Step 3: Deploy a test service
The test services include fib-deployment, fib-svc, and fib-loader, a service that simulates request peaks and troughs, as well as an HPA resource to compare results with AHPA.
Create a file named demo.yaml with the following content.
Run the following command to deploy the test service.
kubectl apply -f demo.yaml
Step 4: Create an AHPA resource
Submit an AdvancedHorizontalPodAutoscaler resource to configure the scaling policy.
Create a file named ahpa-demo.yaml with the following content.
apiVersion: autoscaling.alibabacloud.com/v1beta1
kind: AdvancedHorizontalPodAutoscaler
metadata:
  name: ahpa-demo
spec:
  scaleStrategy: observer
  metrics:
  - type: Resource
    resource:
      name: cpu
      target:
        type: Utilization
        averageUtilization: 40
  scaleTargetRef:
    apiVersion: apps/v1
    kind: Deployment
    name: fib-deployment
  maxReplicas: 100
  minReplicas: 2
  stabilizationWindowSeconds: 300
  prediction:
    quantile: 95
    scaleUpForward: 180
  instanceBounds:
  - startTime: "2021-12-16 00:00:00"
    endTime: "2031-12-16 00:00:00"
    bounds:
    - cron: "* 0-8 ? * MON-FRI"
      maxReplicas: 15
      minReplicas: 4
    - cron: "* 9-15 ? * MON-FRI"
      maxReplicas: 15
      minReplicas: 10
    - cron: "* 16-23 ? * MON-FRI"
      maxReplicas: 20
      minReplicas: 15
The following table describes some of the parameters.
Parameter
Required
Description
scaleTargetRef
Yes
Specifies the target Deployment.
metrics
Yes
Configures the metrics for scaling. Supported metrics include CPU, GPU, memory, QPS, and RT.
target
Yes
The target threshold. For example,
averageUtilization: 40means the target CPU utilization is 40%.scaleStrategy
No
Specifies the scaling mode. The default value is
observer.auto: AHPA manages scaling.observer: Observes but does not perform actual scaling actions. You can use this mode to check whether AHPA works as expected.scalingUpOnly: Performs scale-out operations only.proactive: Enables only proactive prediction.reactive: Enables only passive prediction.
maxReplicas
Yes
The maximum number of replicas for scale-out.
minReplicas
Yes
The minimum number of replicas for scale-in.
stabilizationWindowSeconds
No
The cooldown period for scale-in. Default value: 300 seconds.
prediction.quantile
Yes
The prediction quantile. A higher value is more conservative because it increases the probability that the actual metric value stays below the target. Valid values: 0 to 100. Default value: 99. Recommended range: 90 to 99.
prediction. scaleUpForward
Yes
The time required for a new pod to become ready (the cold start time).
instanceBounds
No
The boundaries for the number of replicas within specific time ranges.
startTime: The start time.
endTime: The end time.
instanceBounds.bounds.cron
No
A cron expression that specifies a schedule. A cron expression consists of five space-separated fields. For example,
- cron: "* 0-8 ? * MON-FRI"specifies that the task runs from 00:00 to 08:59 every Monday to Friday.The following table describes the fields of a cron expression. For more information, see Cron expressions.
Field
Required
Allowed values
Allowed special characters
Minutes
Yes
0-59
* / , -
Hours
Yes
0-23
* / , -
Day of month
Yes
1-31
* / , – ?
Month
Yes
1-12 or JAN-DEC
* / , -
Day of week
No
0-6 or SUN-SAT
* / , – ?
NoteThe values of the Month and Day of week fields are not case-sensitive. For example,
SUN,Sun, andsunhave the same effect.If the Day of week field is not configured, the default value is
*.Special characters:
*: specifies all possible values./: specifies an increment.,: lists values.-: specifies a range.?: specifies no specific value.
Run the following command to create the AHPA scaling policy.
kubectl apply -f ahpa-demo.yaml
Step 5: View the prediction results
On the Integration Management page, navigate to the Container Service tab and click your cluster name. Select ACK AHPA from the Component Type drop-down list. Finally, go to the Dashboards tab and click ahpa-dashboard to view the monitoring data.
The AHPA dashboard provided by Managed Service for Prometheus includes data such as CPU utilization, pod count, and predicted pod count.
The CPU Utilization & Actual PODs chart shows the average CPU utilization and pod count for the current workload.
The Actual and Predicted CPU Usage chart shows the total CPU usage of the pods in the current workload compared to the predicted usage. If the predicted usage is higher than the actual usage, it indicates that the predicted CPU capacity is sufficient.
In the Pod Trend section, you can view the actual pod count, recommended pod count, and proactively predicted pod count.
Actual pod count: The number of pods that are currently running.
Recommended pod count: The final number of pods AHPA recommends, determined by combining proactive prediction, passive prediction, and the defined instance bounds.
Proactive prediction: The number of pods predicted based on cyclical patterns identified in historical data.
AHPA requires seven days of historical data to generate predictions. After you deploy the example, you must wait seven days to see prediction results. If you have an existing production workload, you can select its corresponding deployment directly in the AHPA dashboard.
This topic provides an example where the scaling mode is configured as observer mode (observer mode). This example compares the results with an HPA policy, which serves as a reference for the actual resources required by the application, to check whether the AHPA prediction results are as expected.
The following figure shows an example of the predictions on the AHPA Prometheus dashboard.
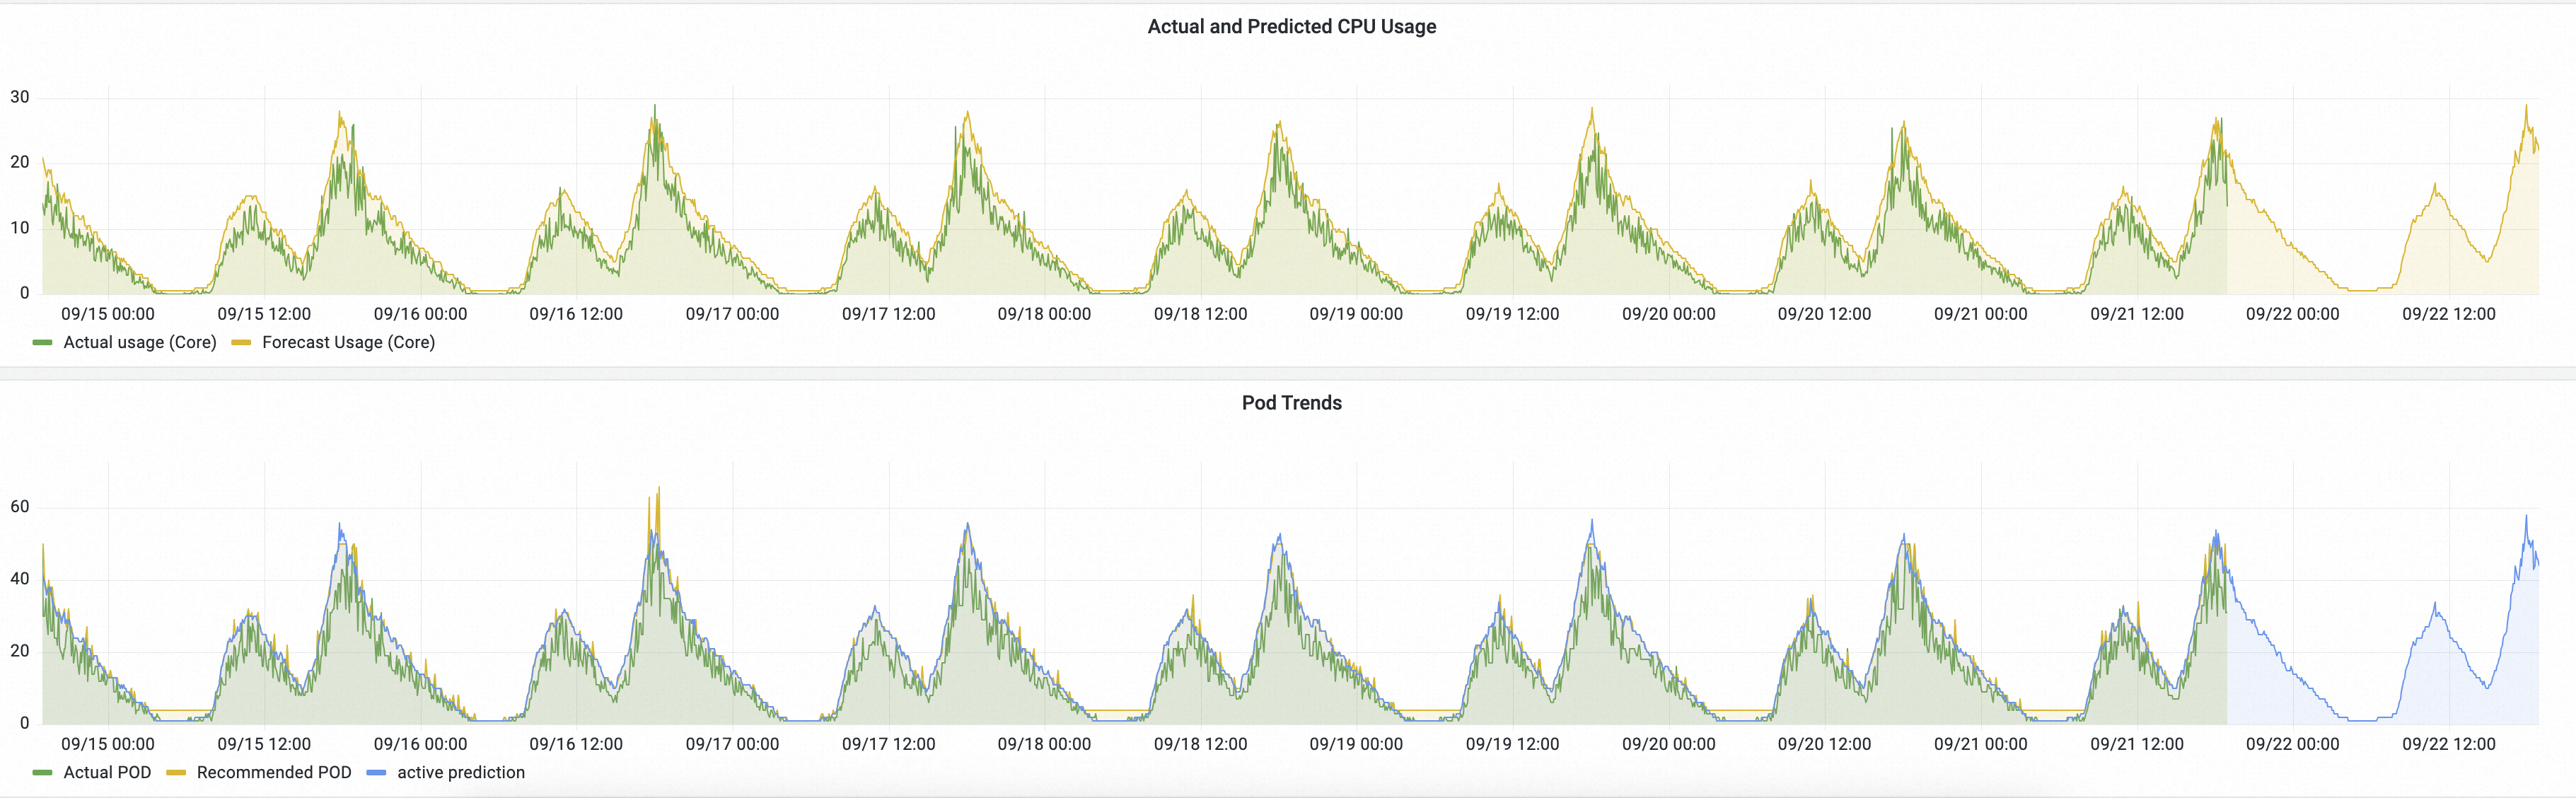
Description:
Actual and Predicted CPU Usage: The green line represents the actual CPU usage with HPA, and the yellow line represents the CPU usage predicted by AHPA.
If the yellow line is above the green line, the predicted CPU capacity is sufficient.
If the yellow line rises before the green line, the required resources were prepared in advance.
Pod Trend: The green line represents the actual number of pods scaled by HPA, and the yellow line represents the number of pods predicted by AHPA.
If the yellow line is below the green line, the predicted number of pods is smaller.
If the yellow line is smoother than the green line, it indicates that scaling with AHPA causes fewer fluctuations, which improves service stability.
The prediction results show that the predictive scaling trend is as expected. If the trend continues to meet your expectations after a period of observation, you can set scaleStrategy to auto to allow AHPA to manage scaling.
Key AHPA metrics
Metric | Description |
ahpa_proactive_pods | The number of pods based on proactive prediction. |
ahpa_reactive_pods | The number of pods based on passive prediction. |
ahpa_requested_pods | The recommended number of pods. |
ahpa_max_pods | The maximum number of pods. |
ahpa_min_pods | The minimum number of pods. |
ahpa_target_metric | The target threshold. |