The performance monitoring feature provides a real-time overview of your file system's performance, including metrics such as read/write IOPS and throughput. This topic describes how to view performance monitoring data for a Cloud Parallel File Storage (CPFS) file system.
Prerequisites
-
A file system has been created. For more information, see Create a file system.
-
CloudMonitor has been activated.
You can log on to the CloudMonitor product details page and follow the on-screen instructions to activate the service.
View data from the NAS console
-
Log on to the NAS console.
-
In the left-side navigation pane, choose Monitoring Audit > Performance Monitoring.
-
In the top navigation bar, select a region.
-
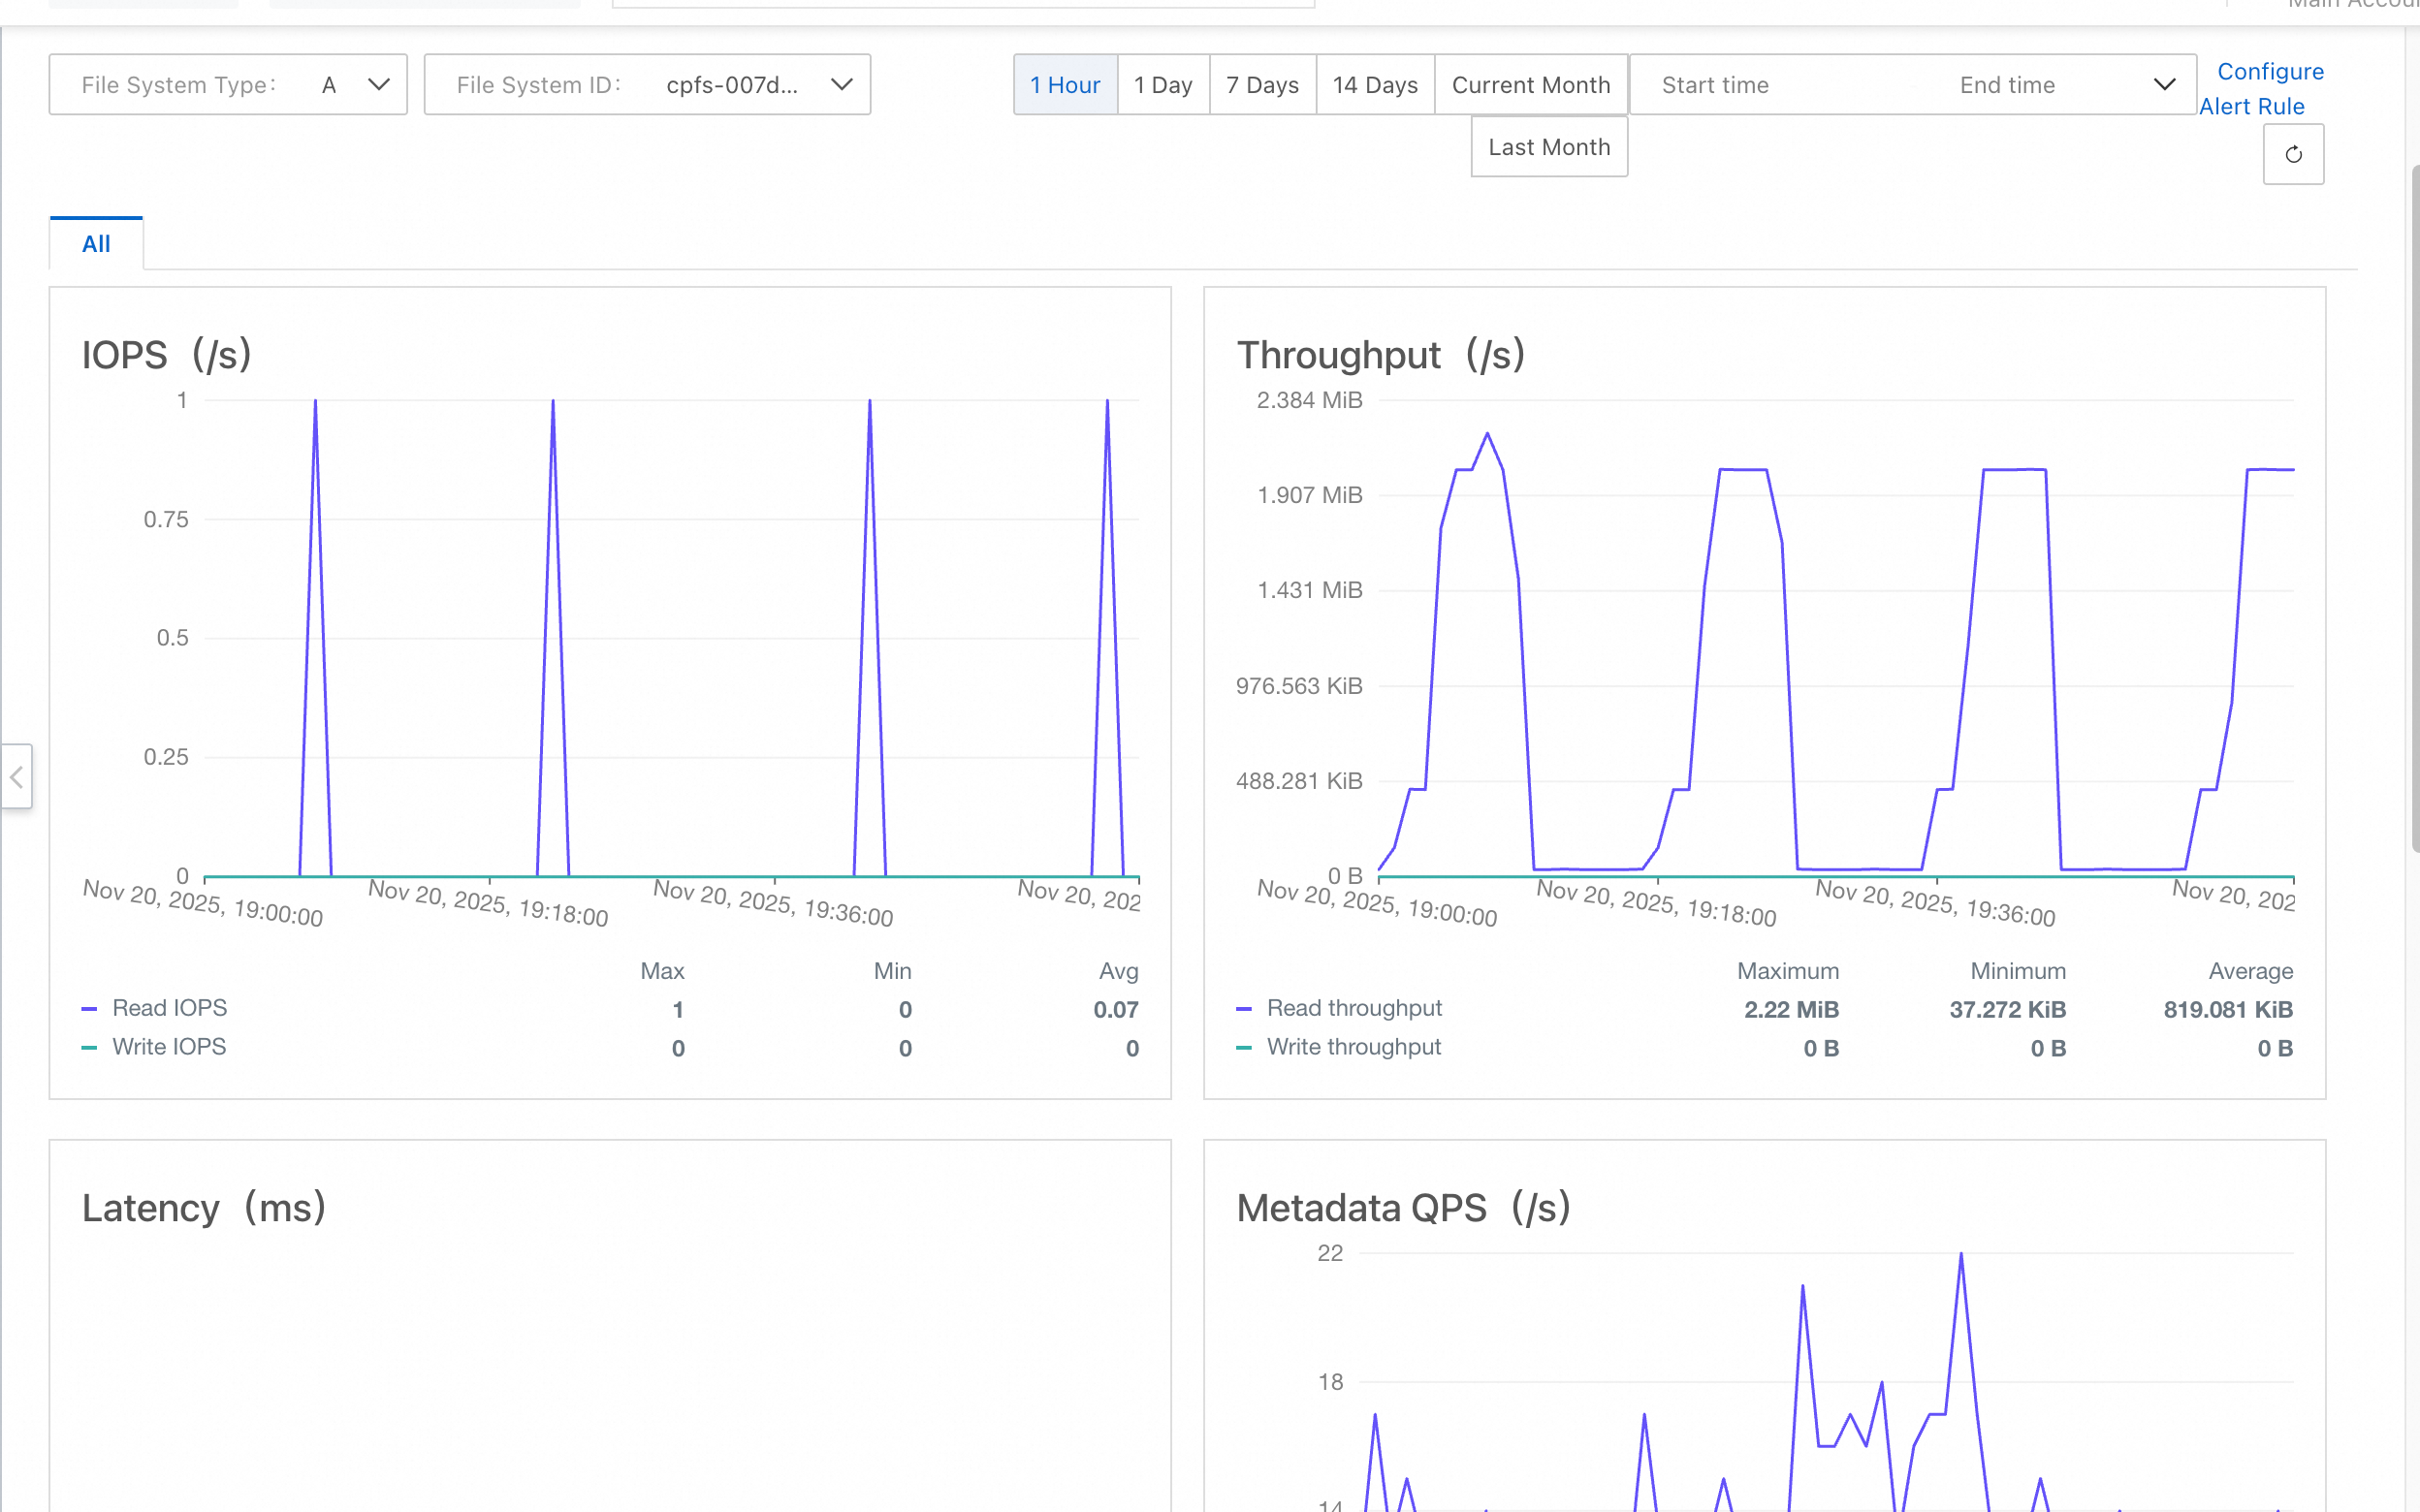
On the Performance Monitoring page, follow these steps to view the performance monitoring details for a specific file system.
-
From the File System Type drop-down list, select CPFS.
-
Select the ID of the file system from the File System ID drop-down list.
-
Select a time range, such as 1 Hour, 1 Day, 7 Days, 14 Days, Current Month, or Last Month, or specify a custom time range. The time range cannot exceed 30 days.
The Performance Monitoring page displays charts for four main metric categories: IOPS, throughput, latency, and metadata QPS.
If you access the file system using the NFS protocol, the page also displays performance monitoring charts for NFS.
 Note
Note-
The No Data message on a chart indicates that the file system has not received requests from a client or that the corresponding service is not enabled.
-
To generate write throughput data, you can run the
fiocommand on the client where the CPFS file system is mounted. For example, assume that the CPFS file system is mounted to the /mnt directory. For more information about file system performance testing, see Performance testing.fio -direct=1 -ioengine=libaio -iodepth=1 -rw=write -bs=1m -size=1G -numjobs=256 -runtime=600 -time_based=1 -group_reporting -directory="/mnt" -name=Seq_Write_Testing
-
-
View data from the CloudMonitor console
-
Log on to the CloudMonitor console.
-
In the left-side navigation pane, choose .
-
On the Cloud Service Monitoring page, enter CPFS in the search box, and then click CPFS.
-
On the CPFS page, select a region. Then, find the target file system and click Monitoring Charts in the Actions column.
-
On the Monitoring Charts page, click the File System Monitoring tab to view the file system's performance monitoring details.
View data using CloudMonitor APIs
You can also query CPFS monitoring data by calling CloudMonitor APIs. Key API operations include:
-
DescribeMetricMetaList: Queries the metadata of time-series metrics available in CloudMonitor.
-
DescribeMetricList: Queries the time-series monitoring data of a cloud service within a specified time range.
-
DescribeMetricLast: Queries the latest monitoring data of a specified object.
The following table describes the request parameters for CPFS.
|
Parameter |
Description |
|
Namespace |
The namespace of the cloud service. For CPFS, the value is acs_nas. |
|
MetricName |
The name of the metric. Valid values:
|
|
Dimensions |
The dimensions for querying the monitoring data of a specific resource. The value is a map. Format: Note
The Dimensions parameter must be a JSON string that represents the map object, and the key-value pairs must be in the specified order. |
Related operations
-
You can configure an alert rule to receive prompt notifications about abnormal data. This allows you to respond to exceptions and restore services quickly. For more information, see Configure a basic alert rule.
-
You can also create an application group for multiple file systems to manage alert rules and view monitoring data at the group level. This simplifies management and improves monitoring efficiency. For more information, see Create an application group.