The Alibaba Cloud Content Moderation console tracks API call volumes and moderation outcomes for images, videos, and text. Use the Statistics page to monitor daily usage, review violation rates, and export data for cost reconciliation or business reporting.
The Content Moderation console collects statistics on the Content Moderation API. You can query the number of times the API is called to moderate images, videos, and text in the previous year. You can also query the respective numbers of violations, suspected violations, and normal results in different moderation scenarios.
View statistics
Log on to the Alibaba Cloud Content Moderation console.
In the left-side navigation pane, choose Machine audit V1.0 > Statistics.
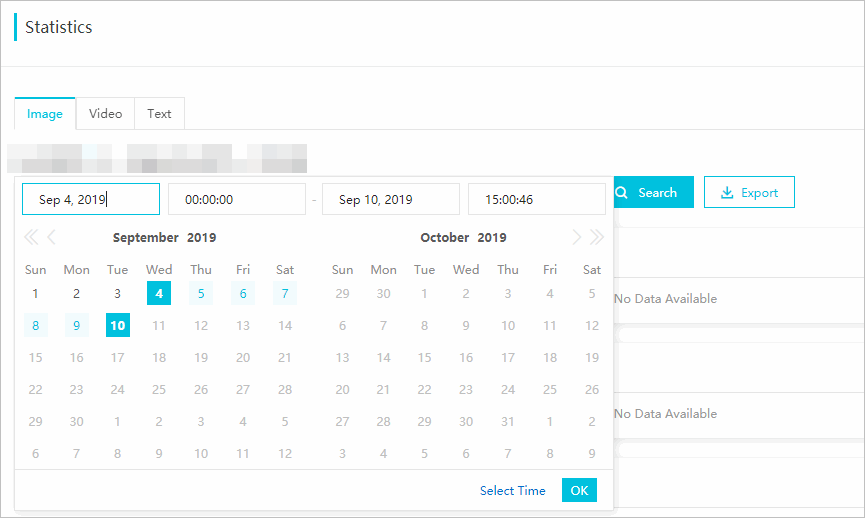
Click the Image, Video, or Text tab based on the type of the statistics to be queried.
On the Statistics page, click the Image, Video, or Text tab for the content type you want to query.
Specify a time range and click Search.
The Statistics page covers the last year of data. Each query can span a maximum of one month.
Review the charts on the page and export the reports in different moderation scenarios as needed.
Reports in the console
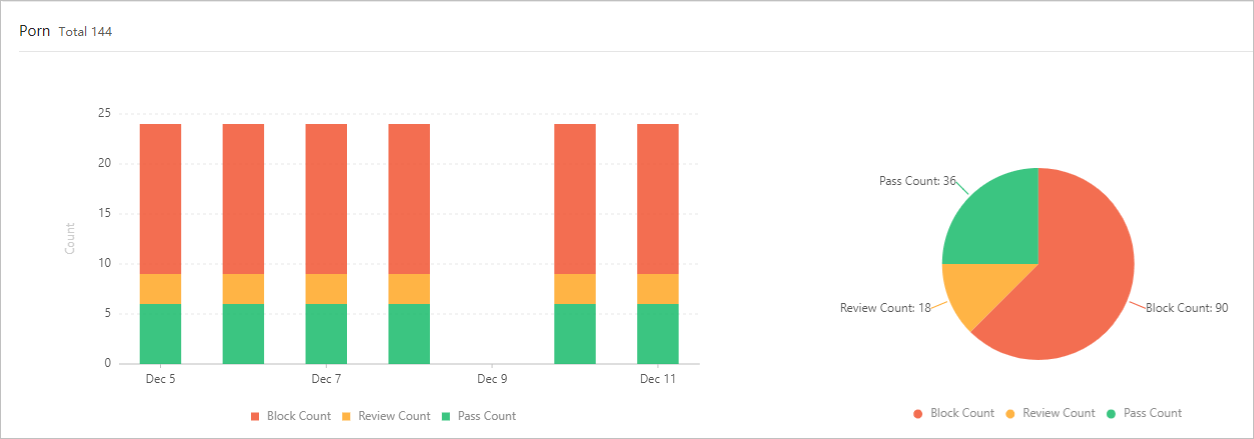
Charts on the Statistics page show daily call volume broken down by moderation result. The Porn scene is shown as an example — it displays the daily number of API calls where the scenes parameter value is porn, along with the breakdown of results.
Each chart uses the following legend:
| Legend | Description | Unit |
|---|---|---|
| Block Count | Requests where suggestion returned block (violation detected) | Images: number of images; Videos: number of captured frames or duration in minutes; Text: number of text entries |
| Review Count | Requests where suggestion returned review (suspected violation, requires human review) | Same as above |
| Pass Count | Requests where suggestion returned pass (no violation detected) | Same as above |
Video moderation counts differ from image and text counts. Video call volume is measured either as the number of captured frames or as video duration in minutes.
Exported reports
Export a report in Excel format to get per-scene daily statistics for the selected time range. Each exported file contains one row per day, with counts broken down by moderation result for images, videos, and text.
The following table describes the column headers in exported reports.
| Header | Description | Unit |
|---|---|---|
| day | Date of the API calls | — |
| totalImageCount | Total images moderated | Piece |
| blockImageCount | Images with violations | Piece |
| reviewImageCount | Images with suspected violations | Piece |
| passImageCount | Images with no violations | Piece |
| totalVideoCount | Total videos moderated | Piece |
| blockVideoCount | Videos with violations | Piece |
| reviewVideoCount | Videos with suspected violations | Piece |
| passVideoCount | Videos with no violations | Piece |
| innerFrameCount | Video frames captured by Content Moderation | Piece |
| outerFrameCount | Video frames submitted by users | Piece |
| totalTextCount | Total text entries moderated | Piece |
| blockTextCount | Text entries with violations | Piece |
| reviewTextCount | Text entries with suspected violations | Piece |
| passTextCount | Text entries with no violations | Piece |