After you enable Managed Service for Prometheus for your cluster, you can view the monitoring information of the storage resources in the cluster, on nodes, and in pods. You can also view the monitoring information about external storage resources that are mounted to the cluster as volumes. This allows you to view the usage information of the storage resources used by the cluster in real time. This topic describes the usage and monitoring methods of container storage and how to view the monitoring dashboard of each storage type.
Prerequisites
The Container Storage Interface (CSI) plug-in is installed in your cluster and the version of the CSI plug-in is 1.22.14-820d8870-aliyun or later.
When you update the CSI plug-in, you must update csi-plugin and csi-provisioner. For more information, see Update csi-plugin and csi-provisioner.
Managed Service for Prometheus is enabled for the cluster. For more information, see the Step 1: Enable Managed Service for Prometheus section of the "Use Managed Service for Prometheus" topic.
Usage and monitoring methods of container storage
Container storage that supports the monitoring feature
Container storage type
Underlying storage
Monitoring method
emptyDir
Directory of the node in which the pod resides
On the Prometheus Monitoring page, click Application Monitoring and then click the Pods tab. The ephemeral storage dashboard is displayed. For more information, see Ephemeral storage monitoring.
NoteemptyDir does not have separate storage monitoring metrics and can only be viewed as part of ephemeral storage in the ephemeral storage monitoring section of the pod dashboard.
Disk volumes
Alibaba Cloud disks
On the Prometheus Monitoring page, click Storage Monitoring, and then click the CSI Disk tab. The disk volume dashboard is displayed. For more information, see Disk volume monitoring.
File Storage NAS (NAS) volumes
NAS
On the Prometheus Monitoring page, click Storage Monitoring and then click the CSI NAS tab. The NAS volume dashboard is displayed. For more information, see NAS volume monitoring.
Object Storage Service (OSS) volumes
OSS
On the Prometheus Monitoring page, click Storage Monitoring and then click the CSI OSS tab. The OSS volume dashboard is displayed. For more information, see OSS volume monitoring.
Container storage that does not support the monitoring feature
Container storage type
Underlying storage
Why the monitoring feature is not supported
hostPath
File or directory of the node in which the pod resides
The hostPath volume is not counted as the ephemeral storage of pods and is not monitored by the kubelet.
Secrets and ConfigMaps
Secrets and ConfigMaps in the cluster
Secrets and ConfigMaps do not have robust storage monitoring requirements. Currently, the community does not have a monitoring design for such volumes.
View storage monitoring information in the console
Log on to the ACK console. In the left-side navigation pane, click Clusters.
On the Clusters page, find the cluster that you want to manage and click its name. In the left-side pane, choose .
Cluster dashboard
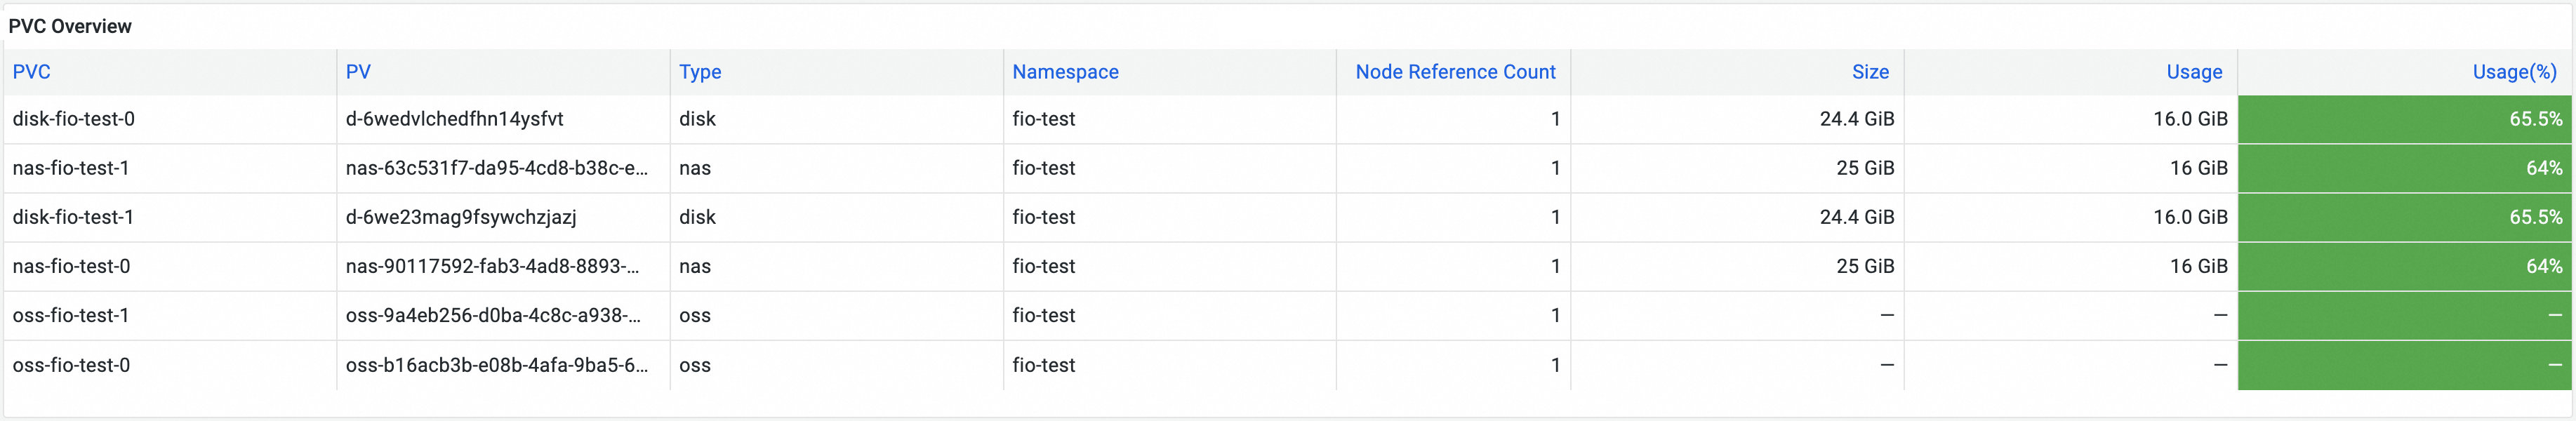
On the Prometheus Monitoring page, click Monitoring Overview and then click the Cluster Overview tab. The cluster dashboard is displayed.
The following figures show the information displayed on the cluster dashboard. The following table describes the metrics displayed on the cluster dashboard.
Metric | Description |
PVC Overview | Displays an overview of the volumes mounted to the cluster, including the persistent volume claim (PVC) name, persistent volume (PV) name, type, and namespace of each volume. In addition, you can view the number of nodes to which each volume is mounted and the total capacity, capacity usage, and capacity utilization of each volume. |
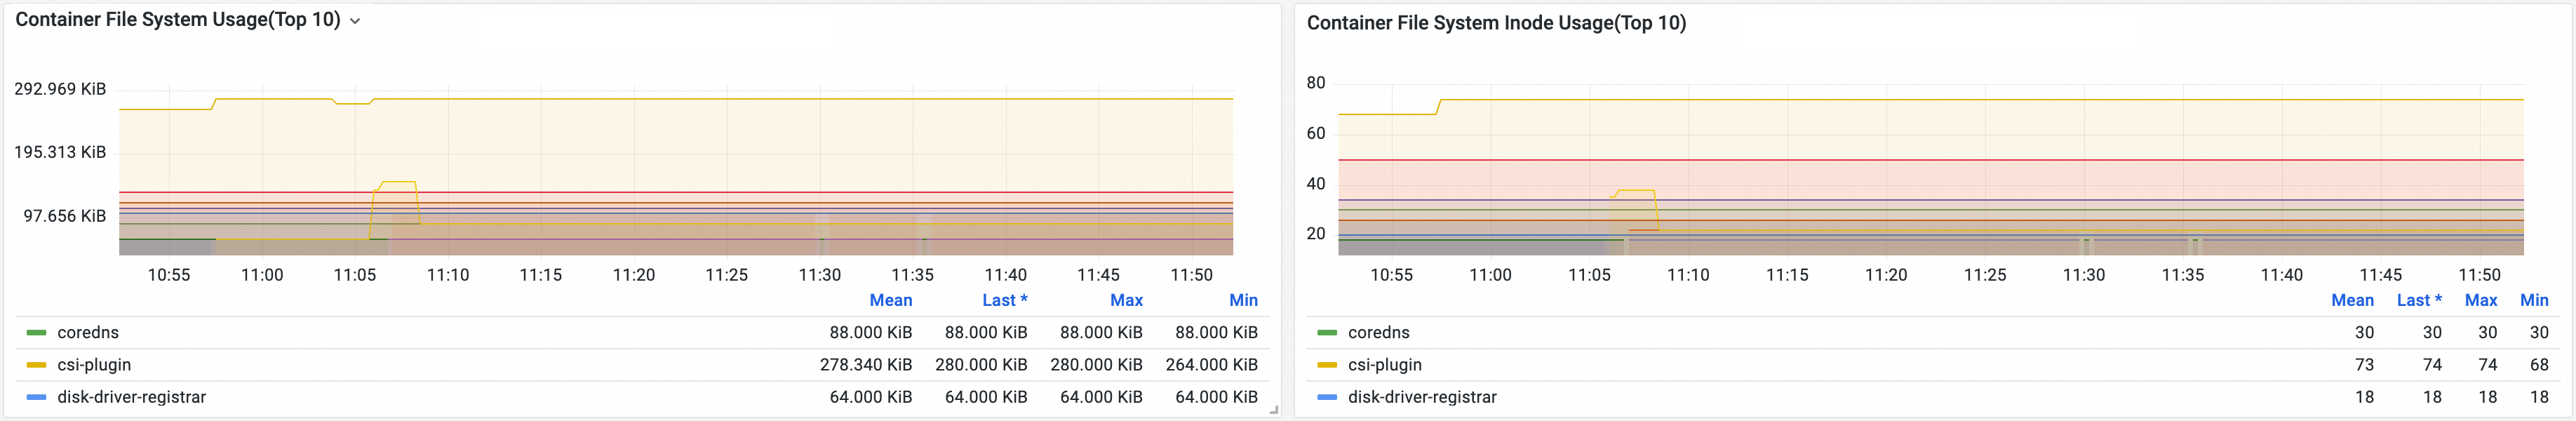
Container File System Usage(Top 10) | The top 10 containers with the highest root file system capacity usage. |
Container File System Inode Usage(Top 10) | The top 10 containers with the highest inode usage in the root file system. |
Node dashboard
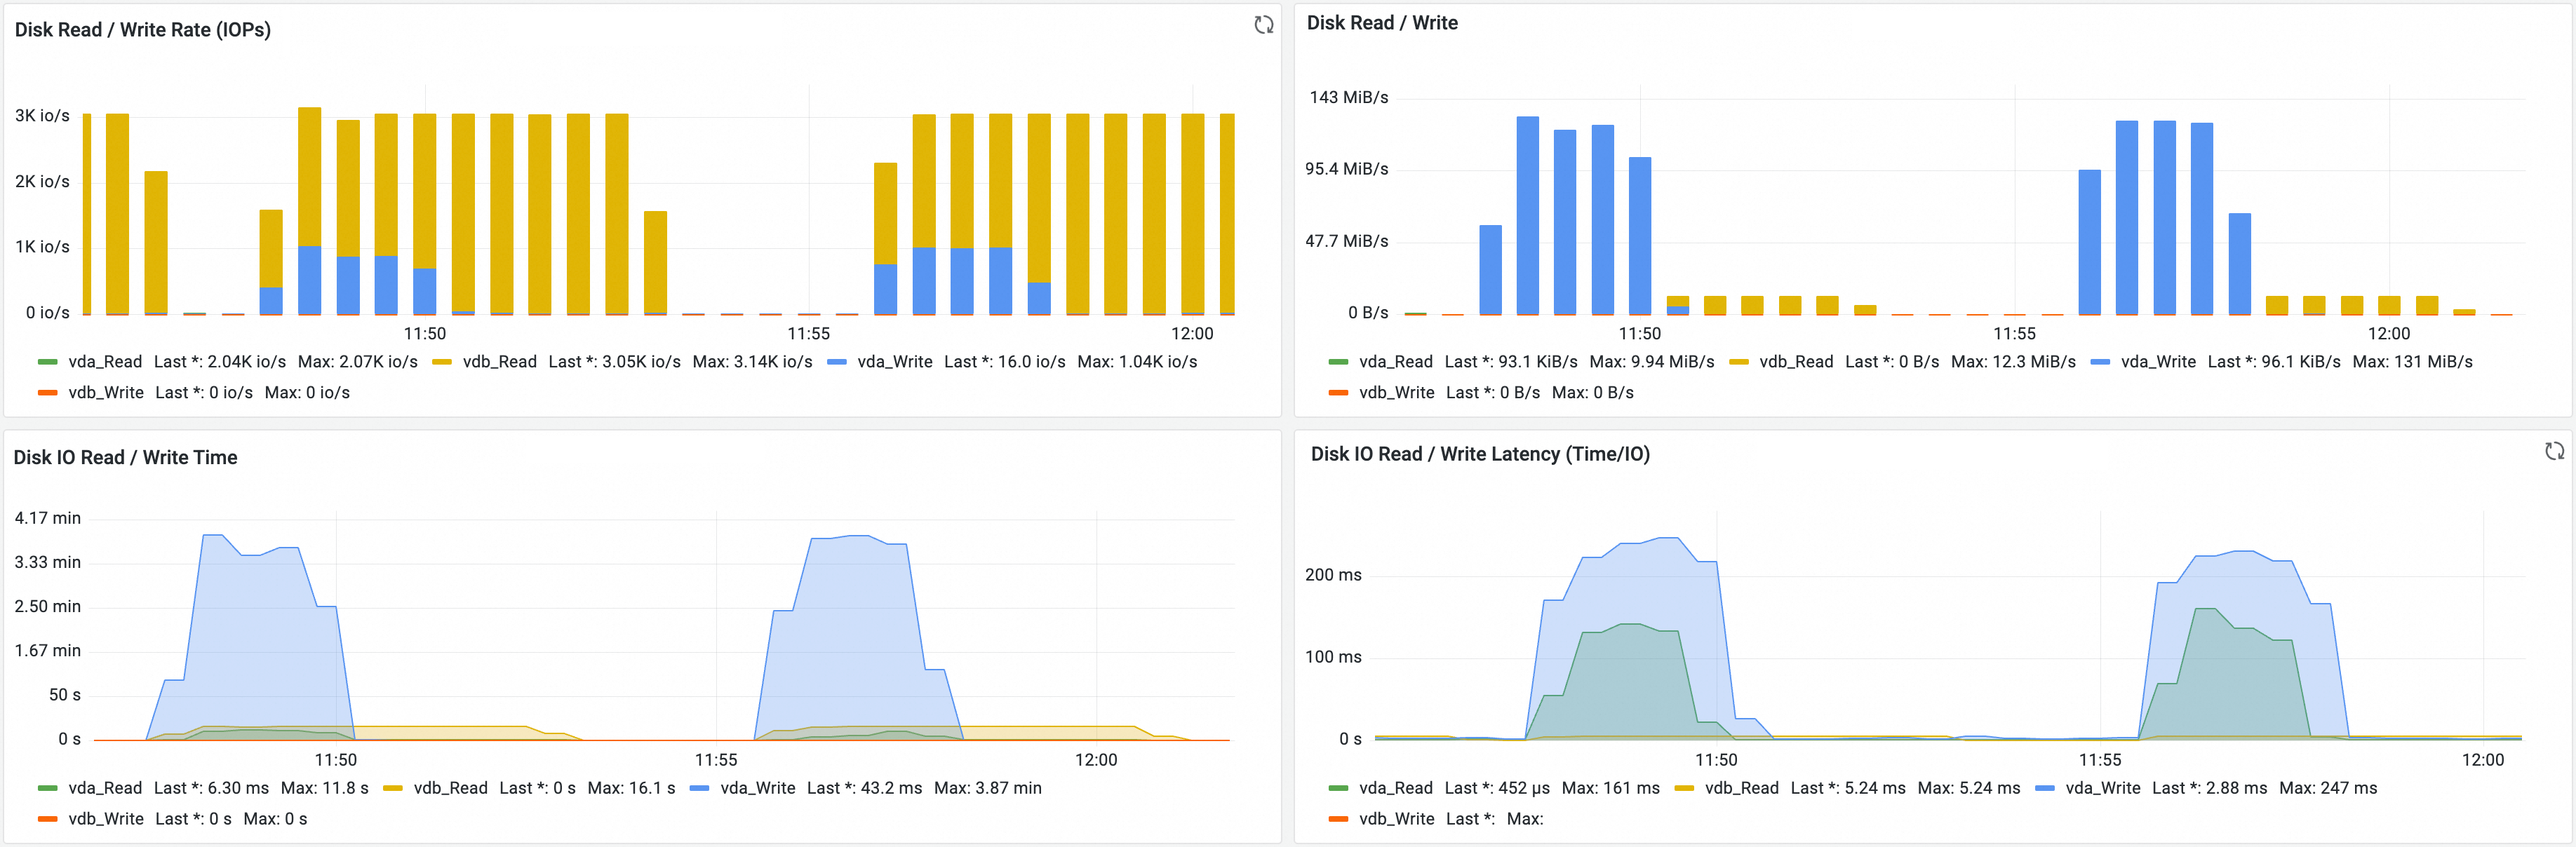
On the Prometheus Monitoring page, click Node Monitoring, and then click the Nodes tab. The node dashboard is displayed.
The node dashboard displays the monitoring information of disks and PVCs. The following figure shows the diagrams displayed on the node dashboard. The following table describes the metrics displayed on the node dashboard.
Disk monitoring
Metric | Description |
Disk Read / Write Rate (IOPs) | The IOPS of disk reads and writes. |
Disk Read / Write | The disk read and write speed. |
Disk IO Read / Write Time | The disk read and write time. |
Disk IO Read / Write Latency (Time/IO) | The latency of disk reads and writes. |
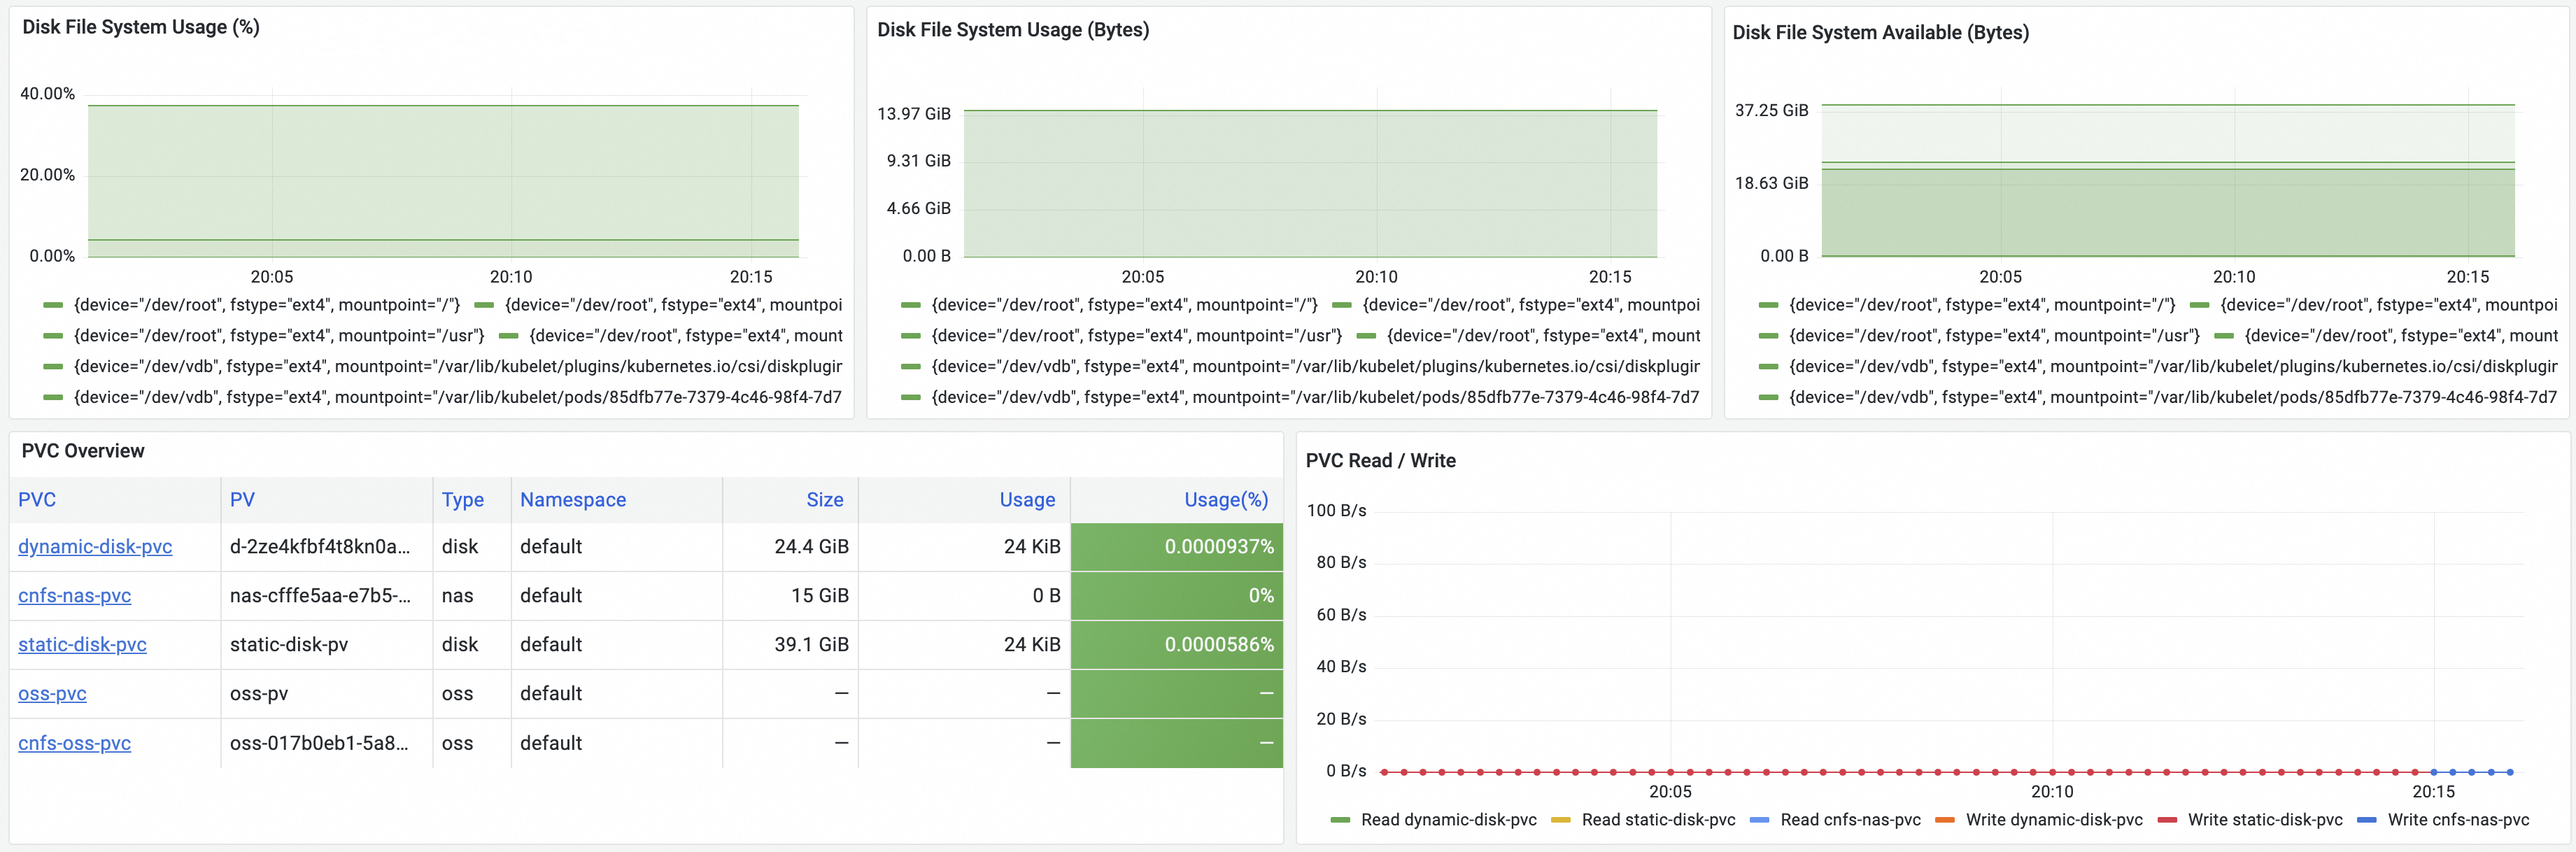
PVC monitoring
This section displays an overview of the PVCs mounted to the node and the real-time read and write speed of each PVC.
Metric | Description |
Disk File System Usage (%) | The disk capacity utilization. |
Disk File System Usage (Bytes) | The disk capacity usage. |
Disk File System Available (Bytes) | The available disk capacity. |
PVC Overview | Displays an overview of the volumes mounted to the cluster, including the PVC name, PV name, type, and namespace of each volume. In addition, you can view the number of nodes to which each volume is mounted and the total capacity, capacity usage, and capacity utilization of each volume. |
PVC Read / Write | The real-time read and write speed of each volume. |
Pod dashboard
On the Prometheus Monitoring page, click Application Monitoring, and then click the Pods tab. The pod dashboard is displayed.
The storage resources in a pod include the root file system and ephemeral storage. The following figure shows the diagrams displayed on the pod dashboard. The following table describes the metrics displayed on the pod dashboard.
Root file system monitoring
If your cluster runs Kubernetes 1.24 or later, the metrics on the pod dashboard depend on csi-plugin. You must ensure that CSI 1.28.3-eb95171-aliyun or later is used. If the CSI plug-in version is earlier than 1.28.3-eb95171-aliyun, no metric is displayed on the pod dashboard. For more information about the release notes for csi-plugin, see csi-plugin. For more information about how to update the CSI plug-in, see Update csi-plugin and csi-provisioner.
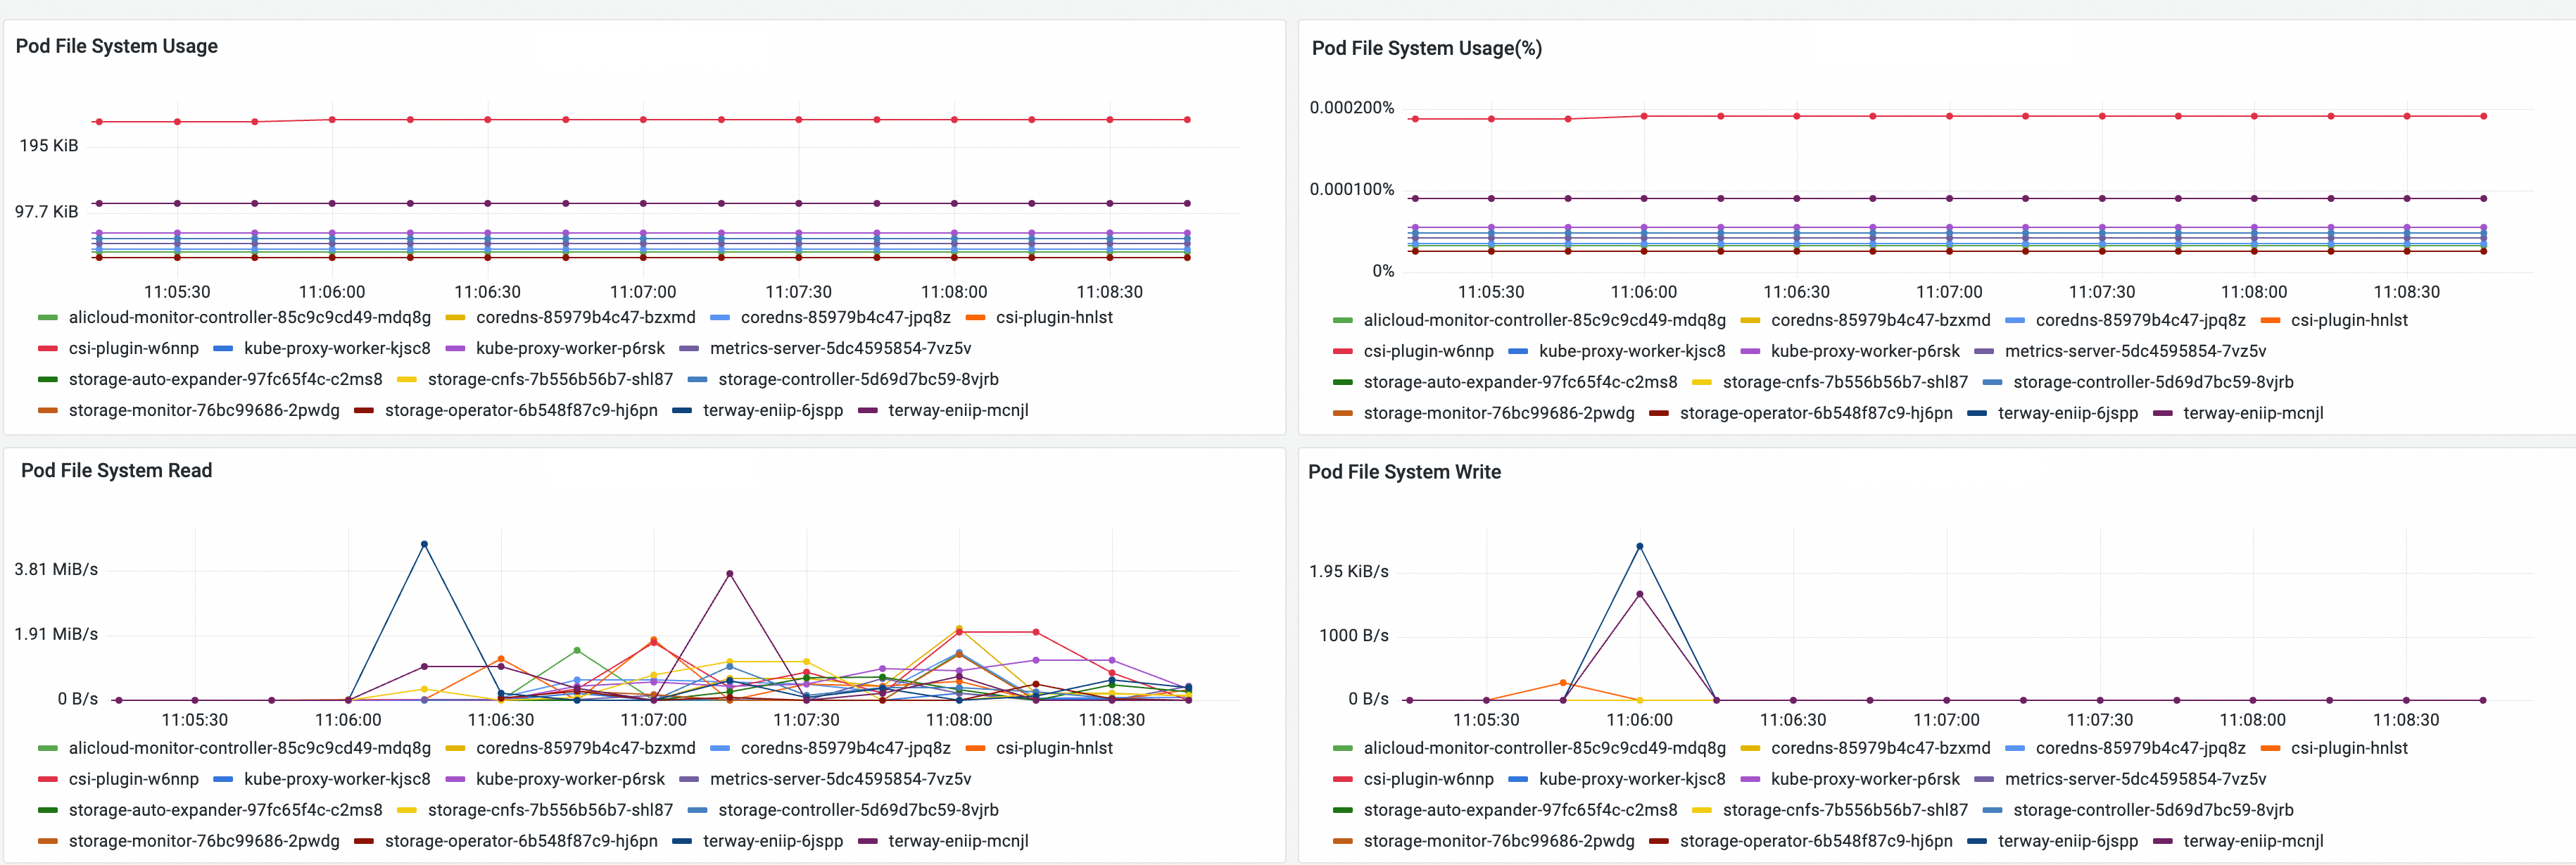
Metric | Description |
Pod File System Usage | The storage capacity usage of the root file system in the pod. |
Pod File System Usage(%) | The storage capacity utilization of the root file system in the pod. |
Pod File System Read | The real-time read speed of the root file system in the pod. |
Pod File System Write | The real-time write speed of the root file system in the pod. |
Ephemeral storage monitoring
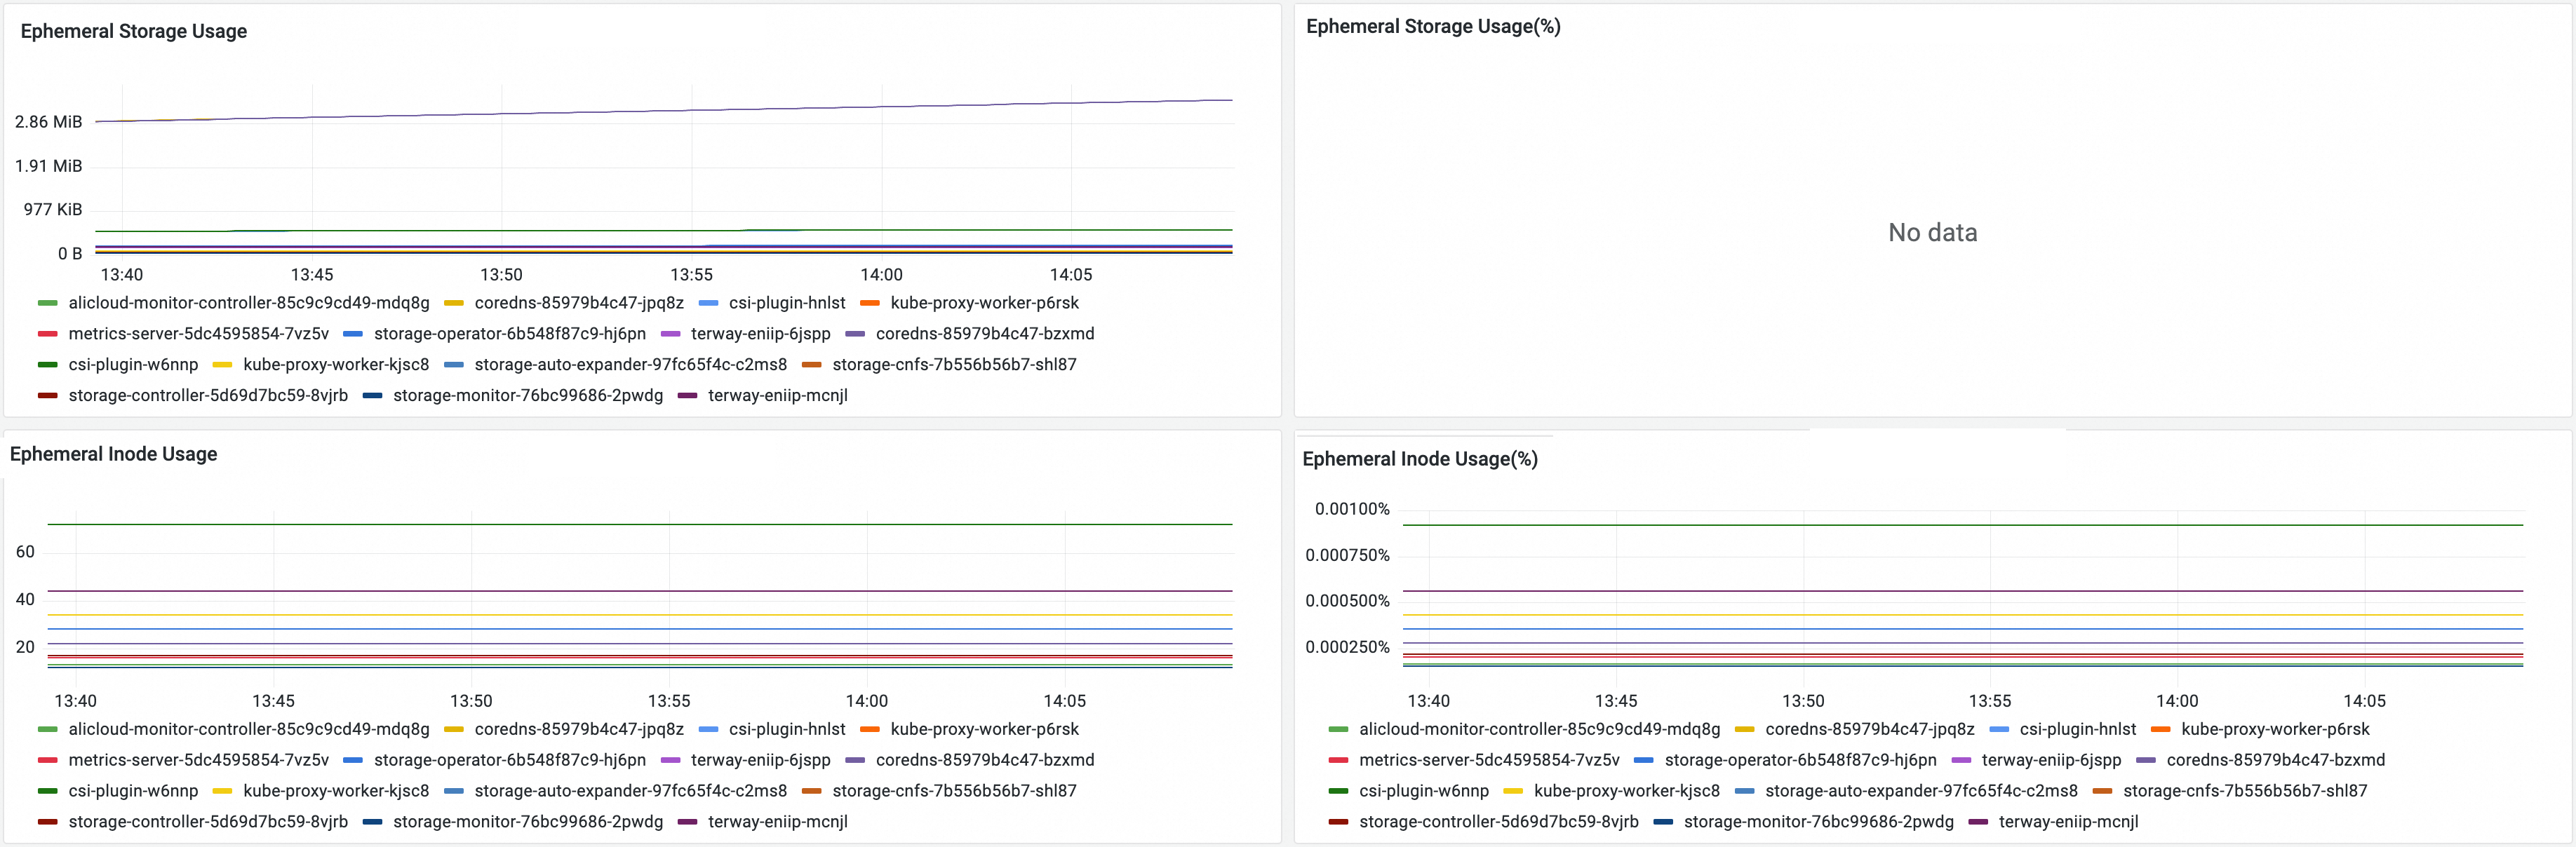
Metric | Description |
Ephemeral Storage Usage | The ephemeral storage usage of the pod. |
Ephemeral Storage Usage(%) | The ephemeral storage utilization of the pod. Note This metric is collected only if you specify the |
Ephemeral Inode Usage | The number of inodes used in the ephemeral storage of the pod. |
Ephemeral Storage Inode Usage(%) | The inode utilization in the ephemeral storage of the pod. |
Volume dashboard
If disk,NAS, or OSS volumes are mounted to the pods in your cluster, you can view information about the usage of the preceding volumes by using the following methods:
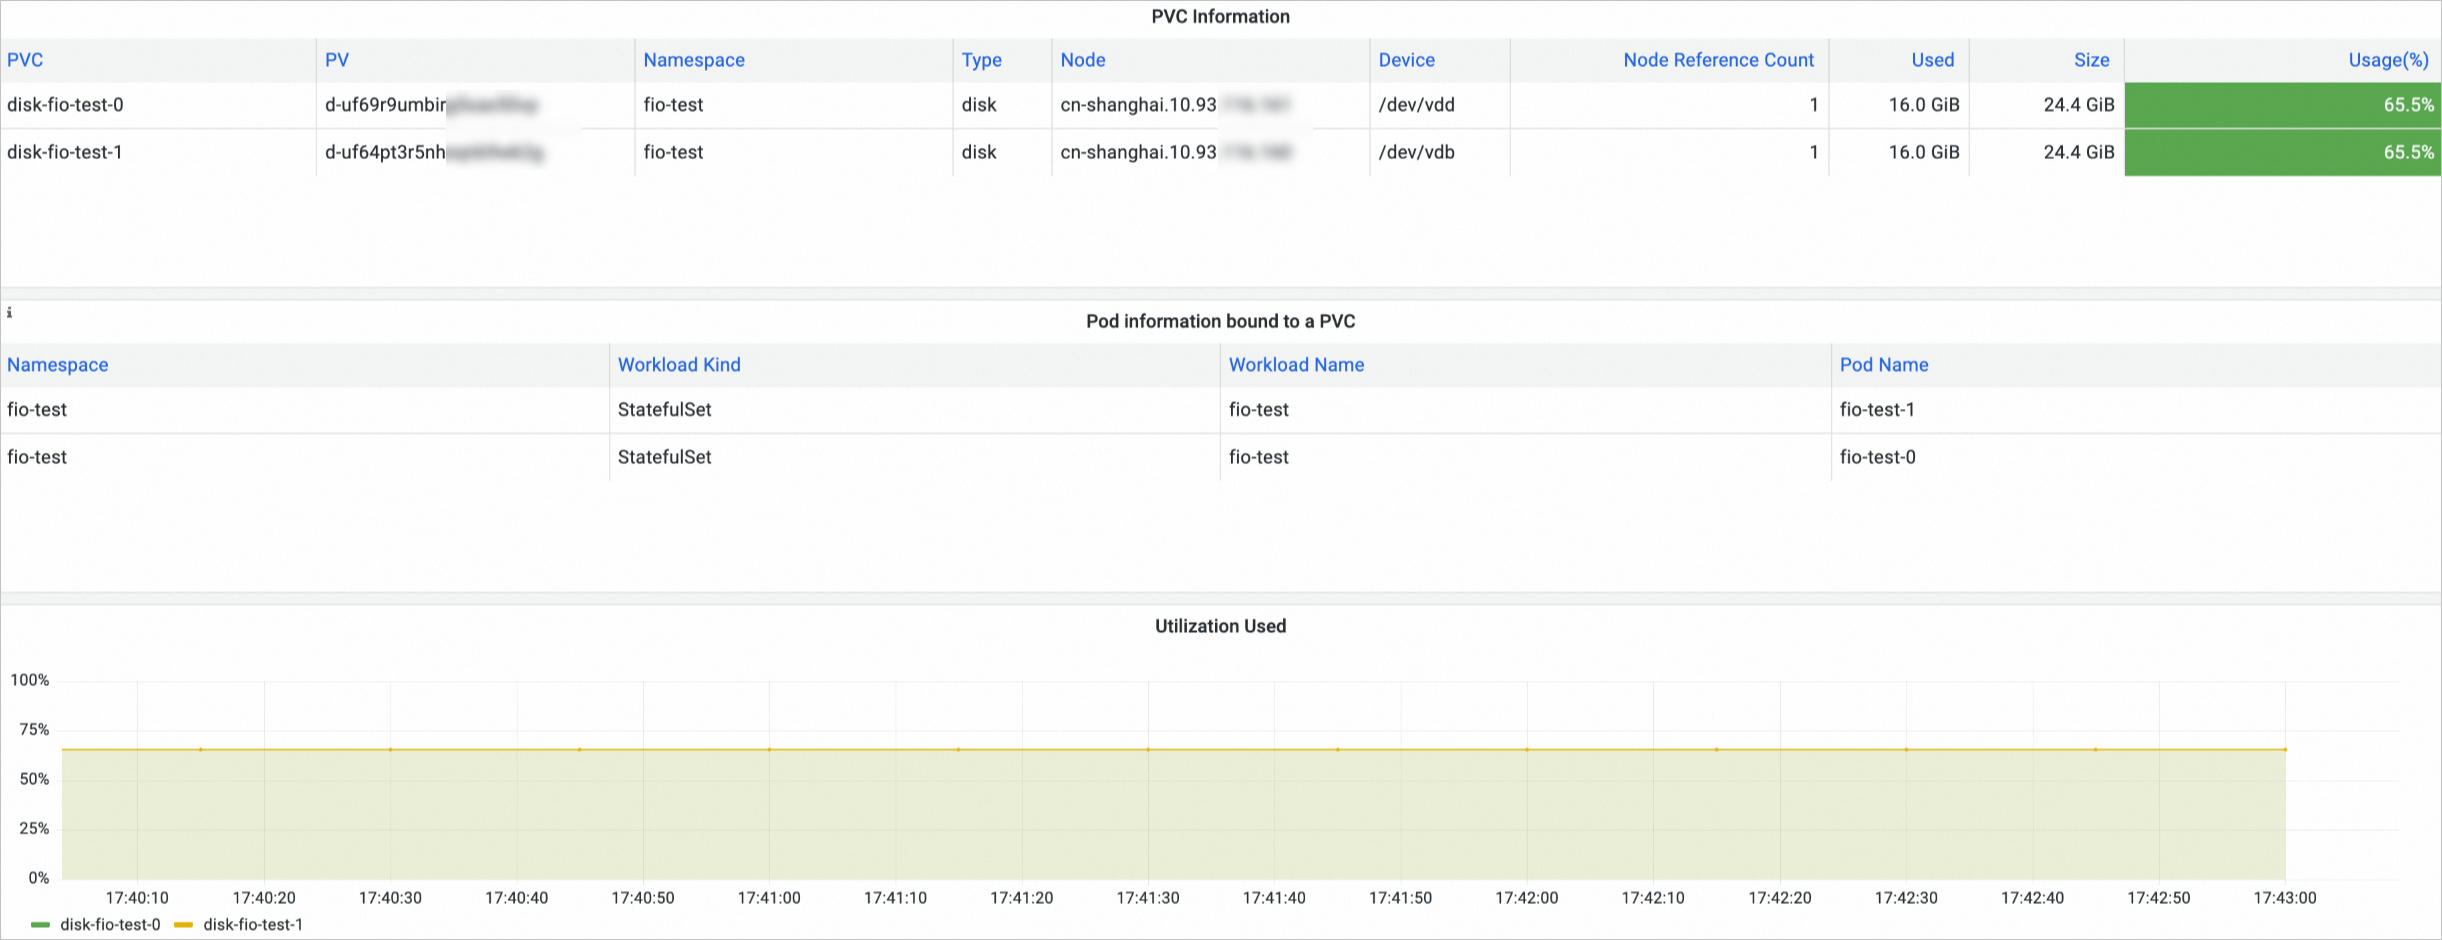
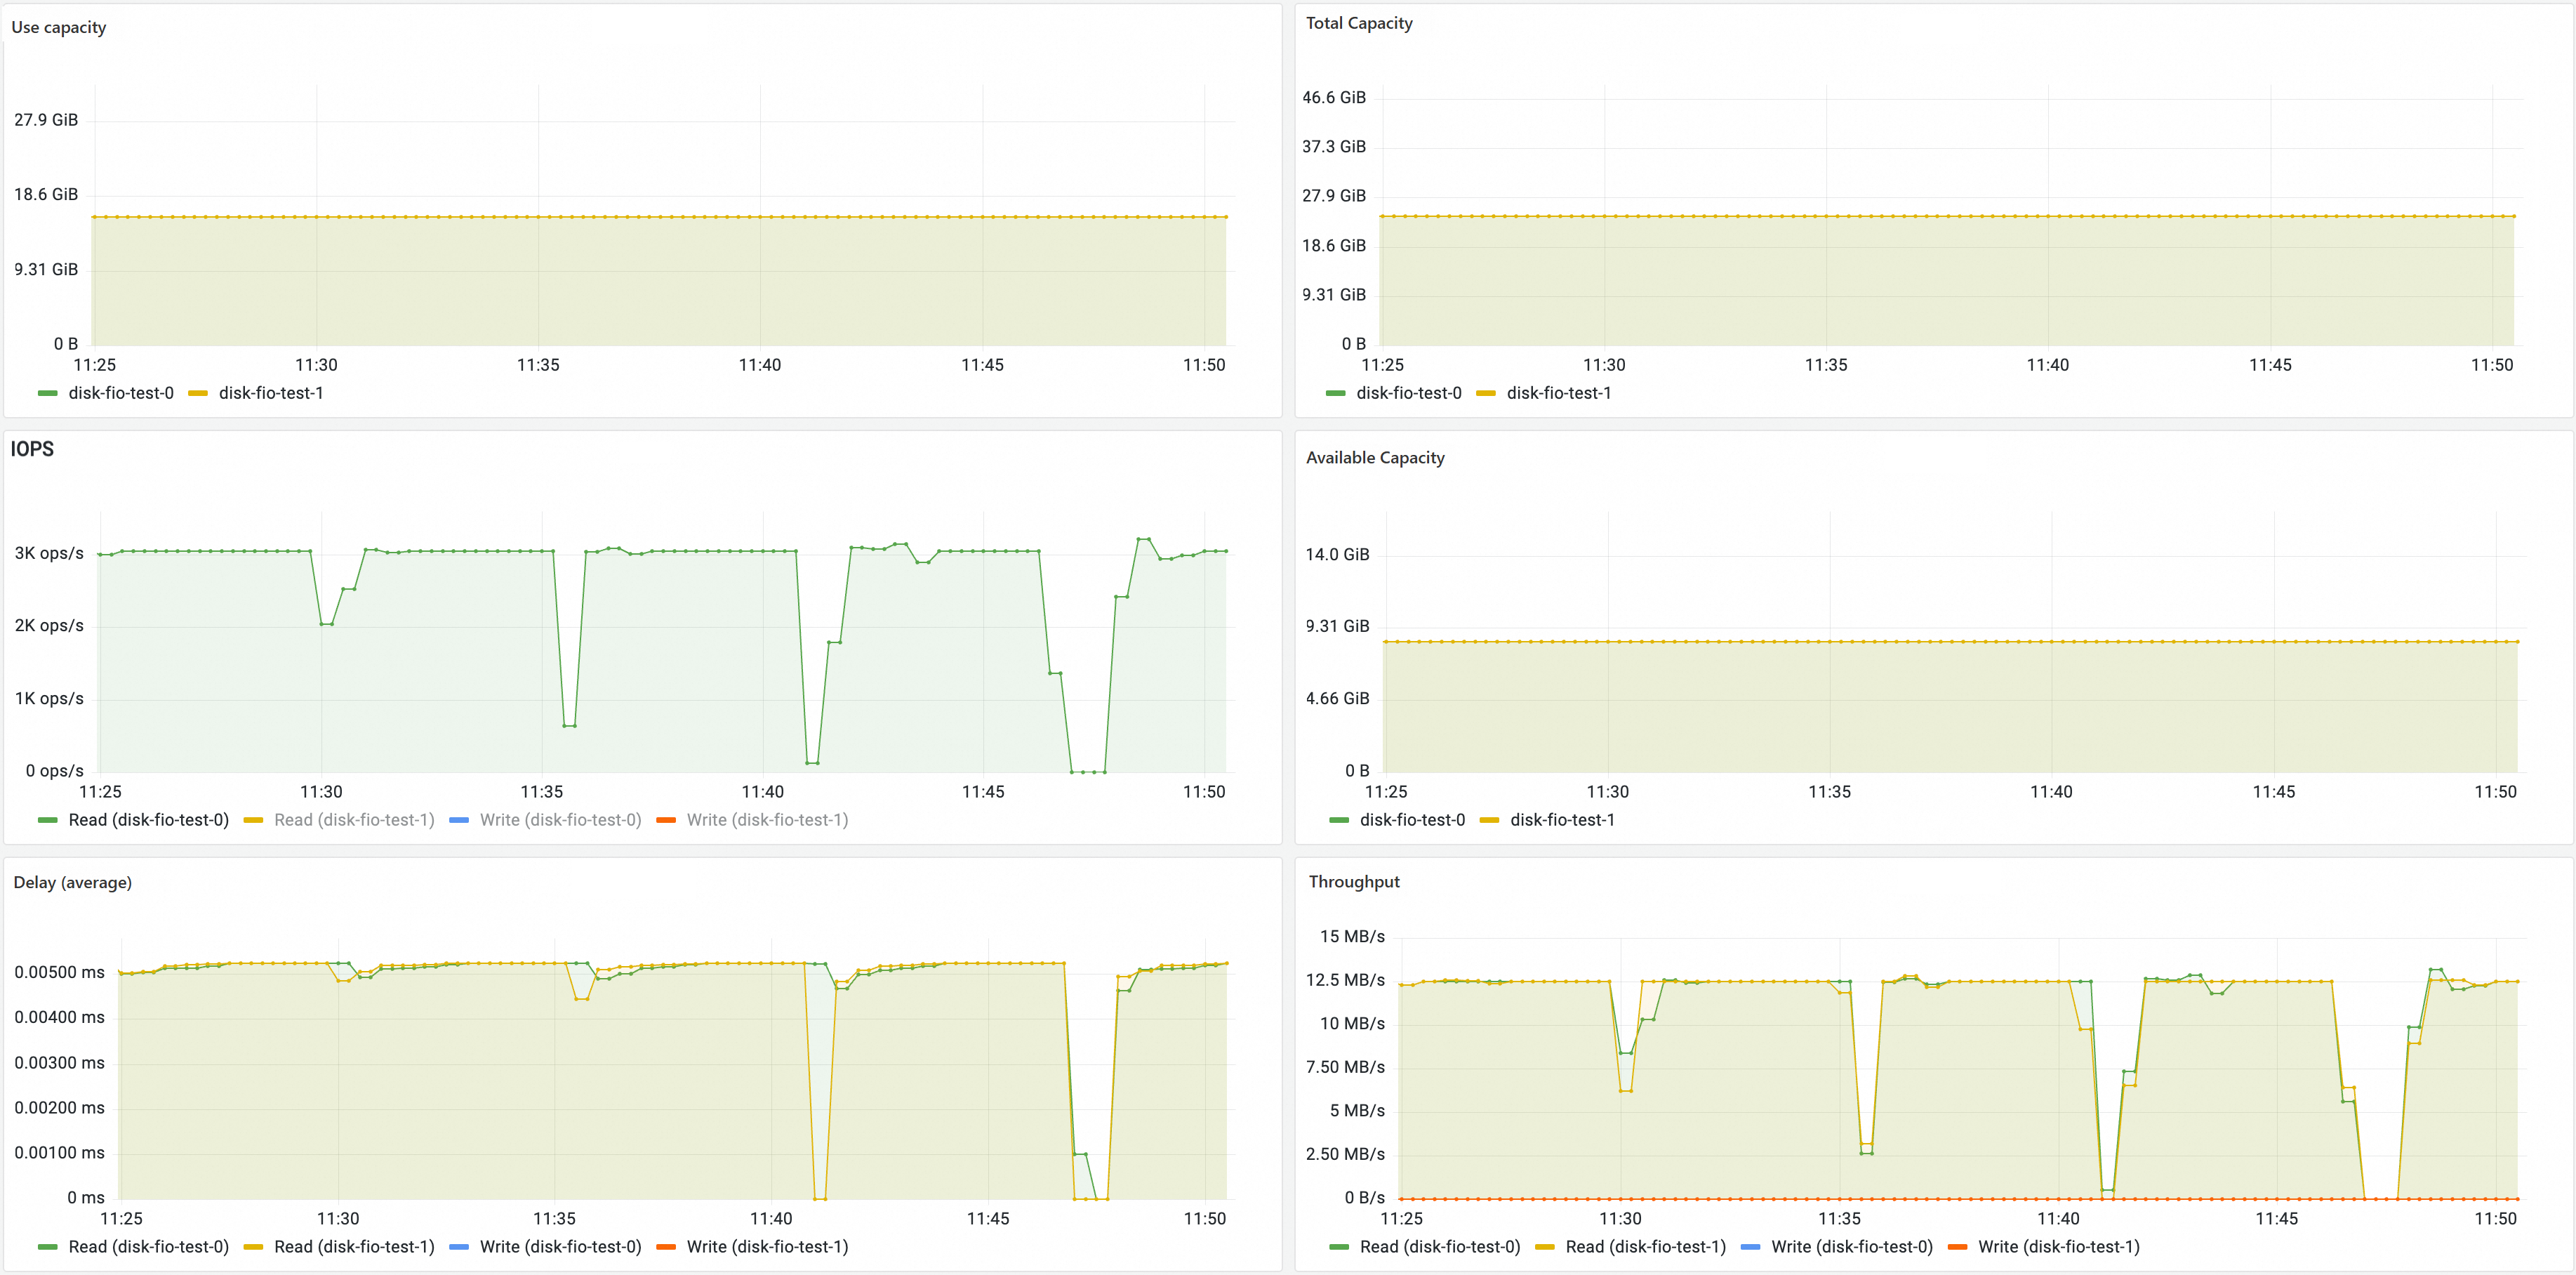
Disk volume monitoring
On the Prometheus Monitoring page, click Storage Monitoring and then click the CSI Disk tab. The disk volume dashboard is displayed. You can view information about the disk PVCs, the nodes to which disk volumes are mounted, and the disk volume usage in the disk volume dashboard.
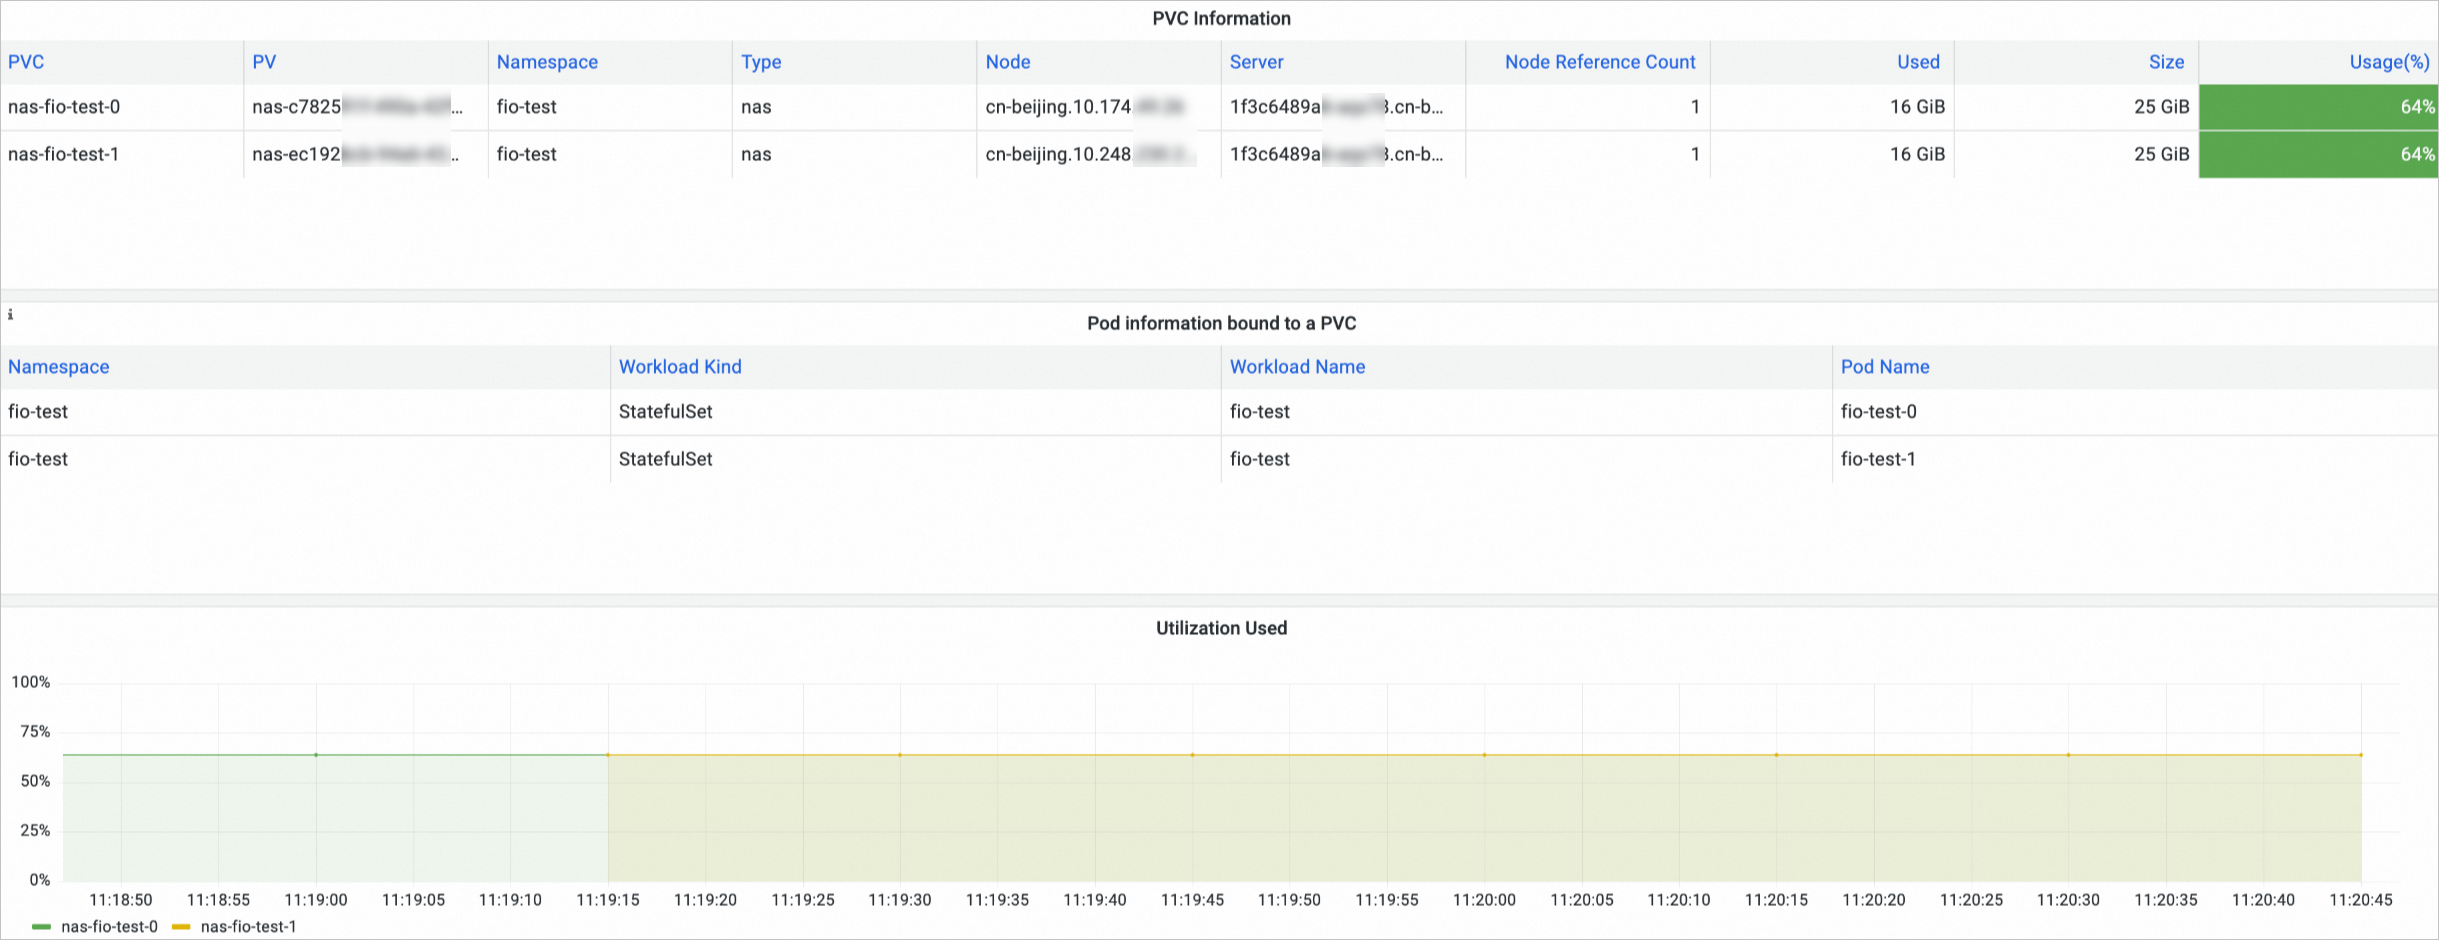
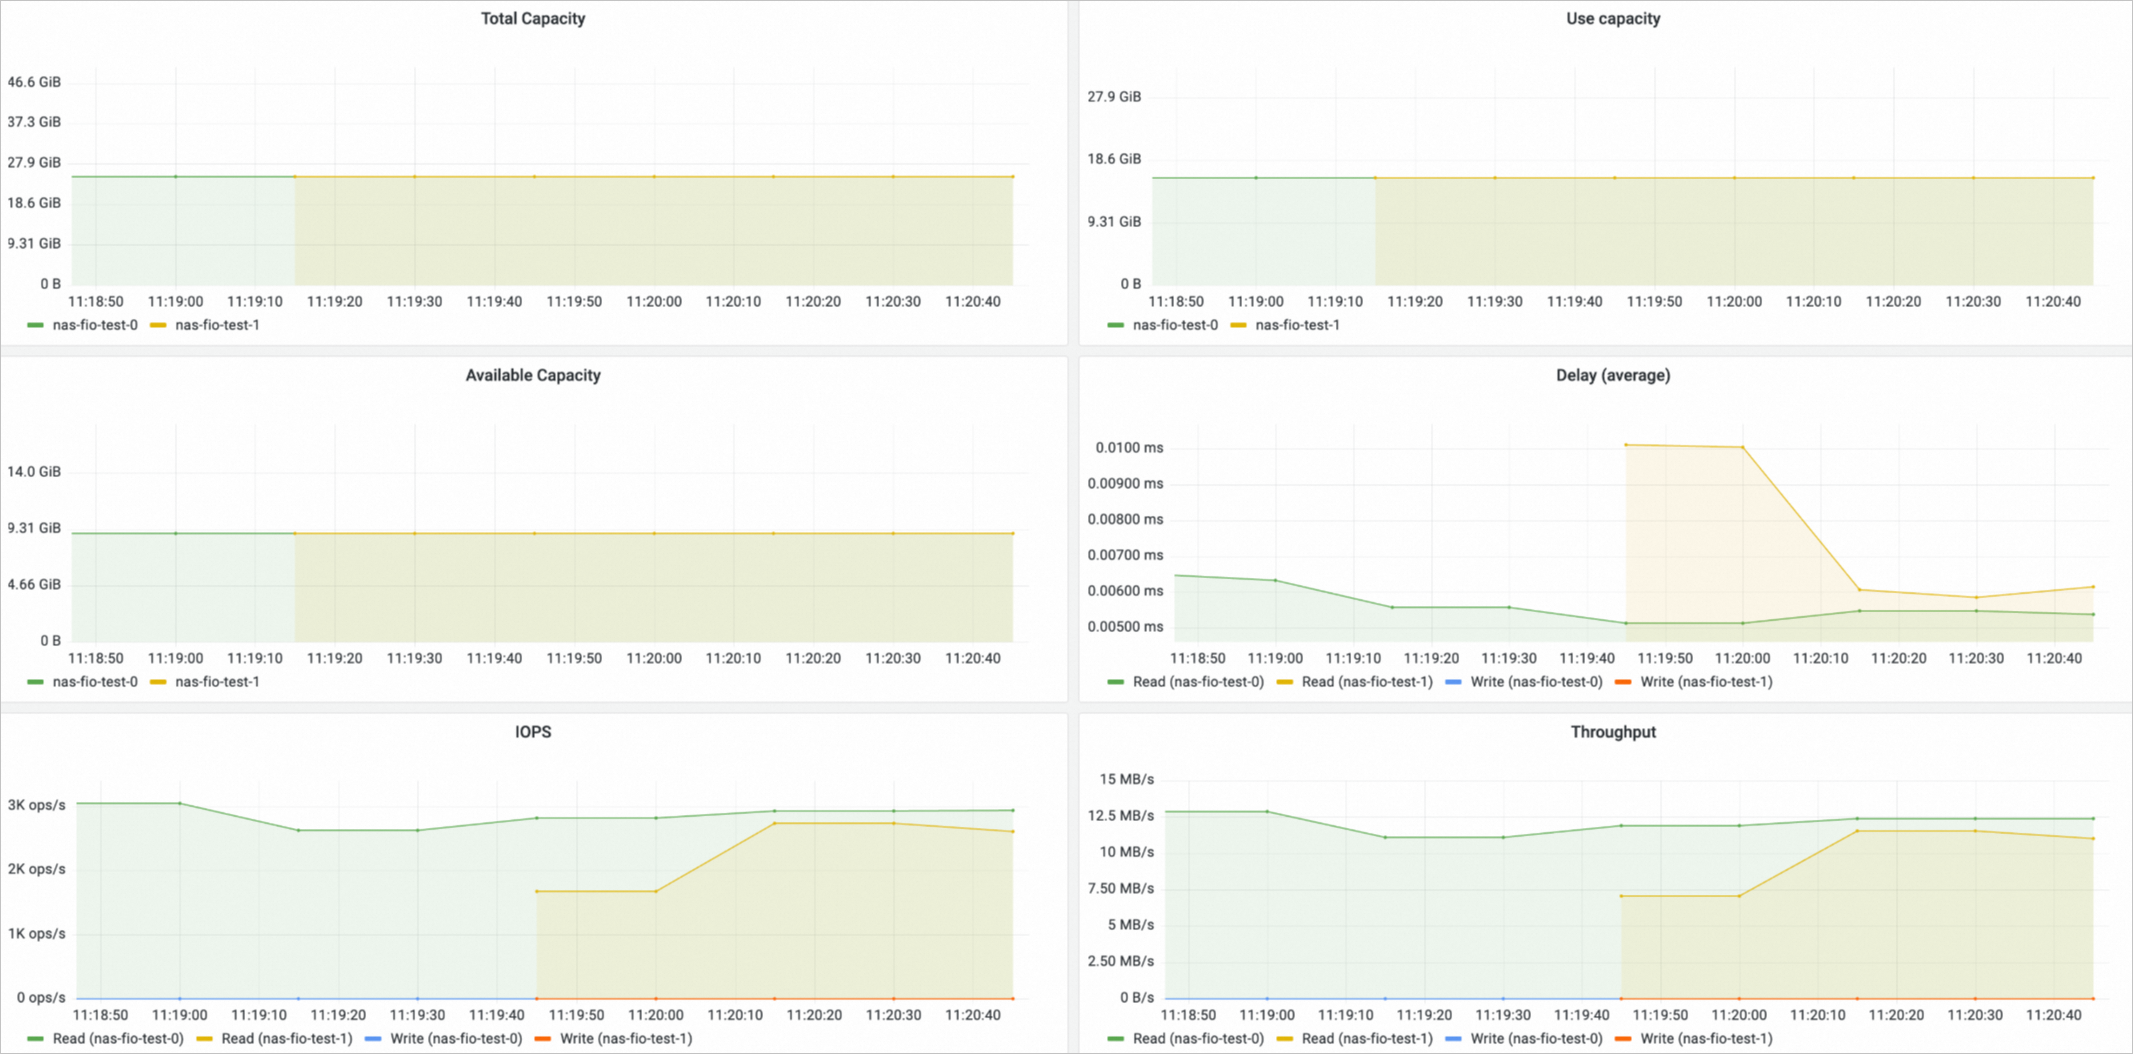
NAS volume monitoring
On the Prometheus Monitoring page, click Storage Monitoring and then click the CSI NAS tab. The NAS volume dashboard is displayed. You can view information about the NAS PVCs, the nodes to which NAS volumes are mounted, and the NAS volume usage in the NAS volume dashboard.
Only NAS volumes that are used by Container Network File System (CNFS) have data of the four metrics: utilization, total capacity, used capacity, and available capacity.
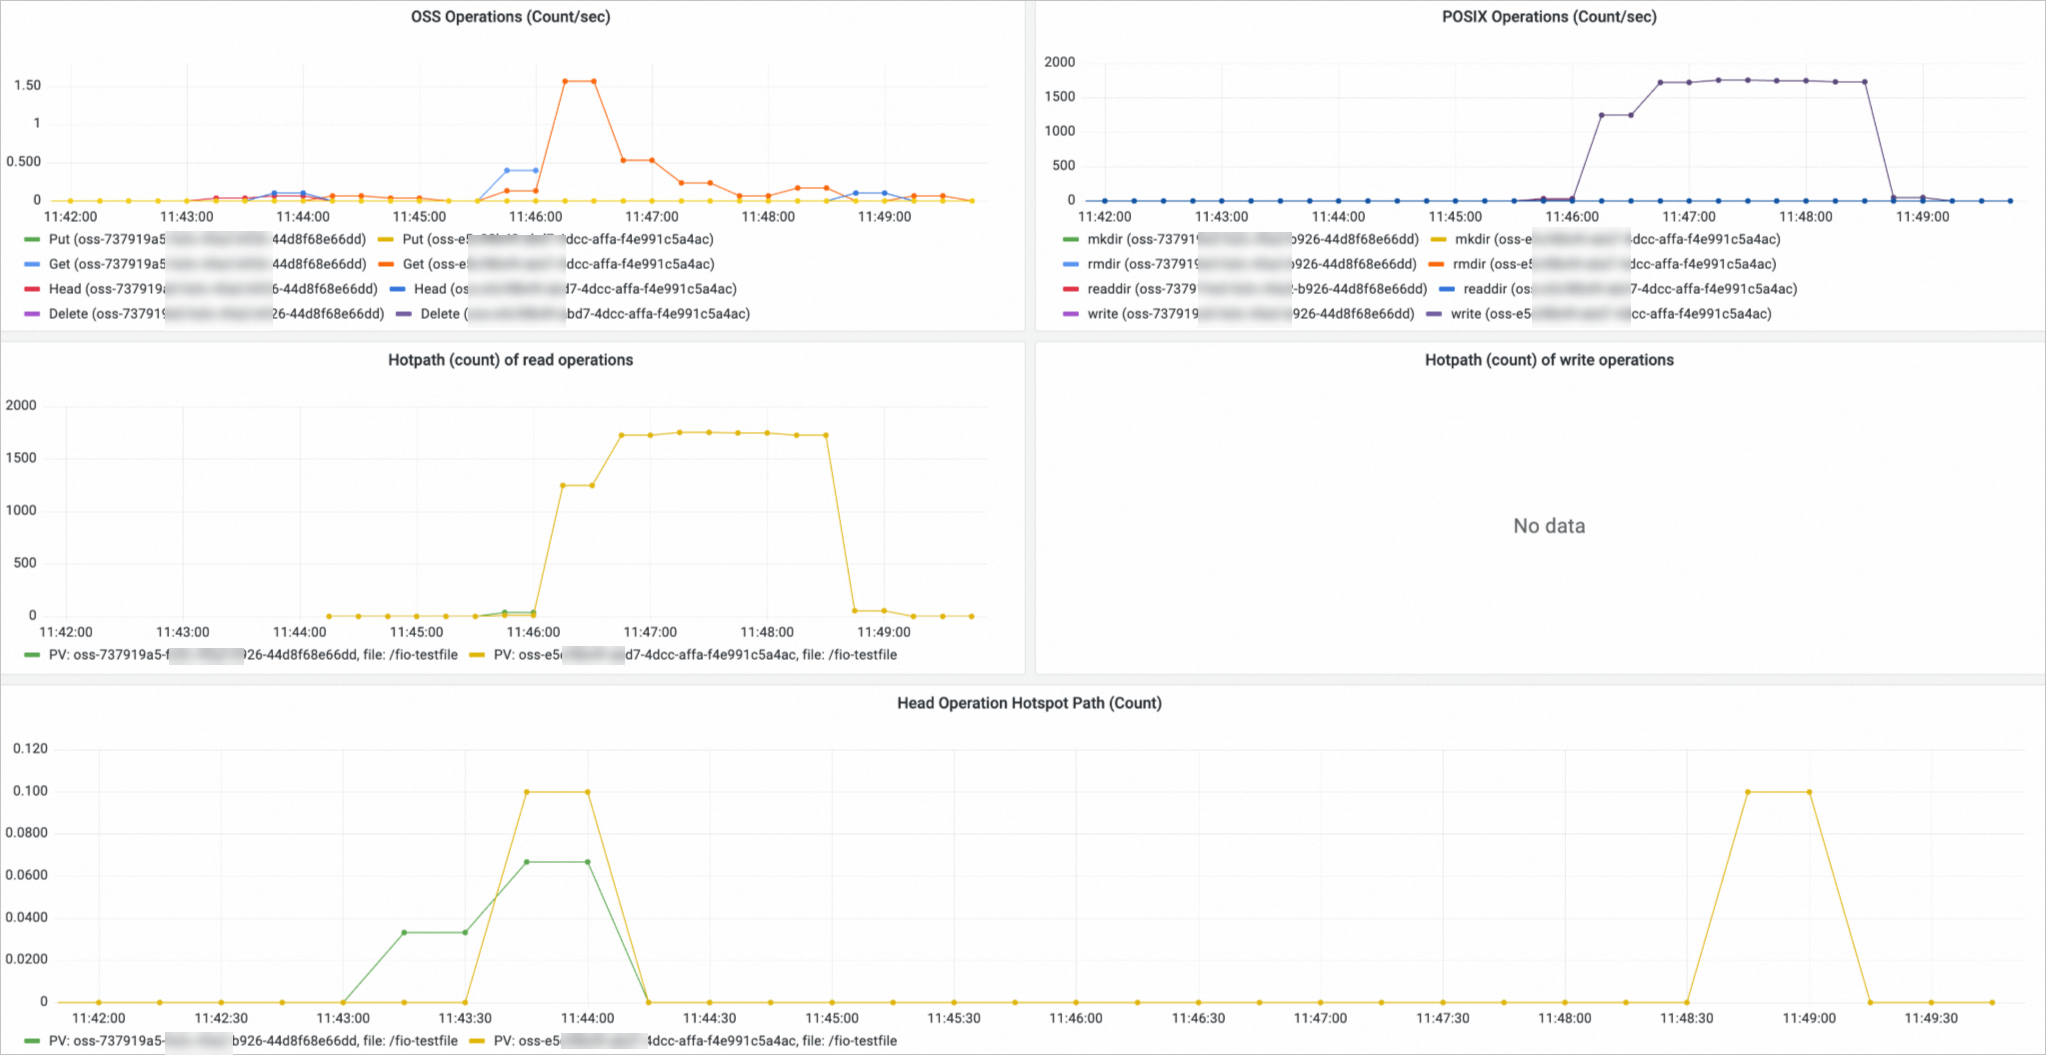
OSS volume monitoring
On the Prometheus Monitoring page, click Storage Monitoring and then click the CSI OSS tab. The OSS volume dashboard is displayed. You can view information about the OSS PVCs, the nodes to which OSS volumes are mounted, and the OSS volume usage in the OSS volume dashboard.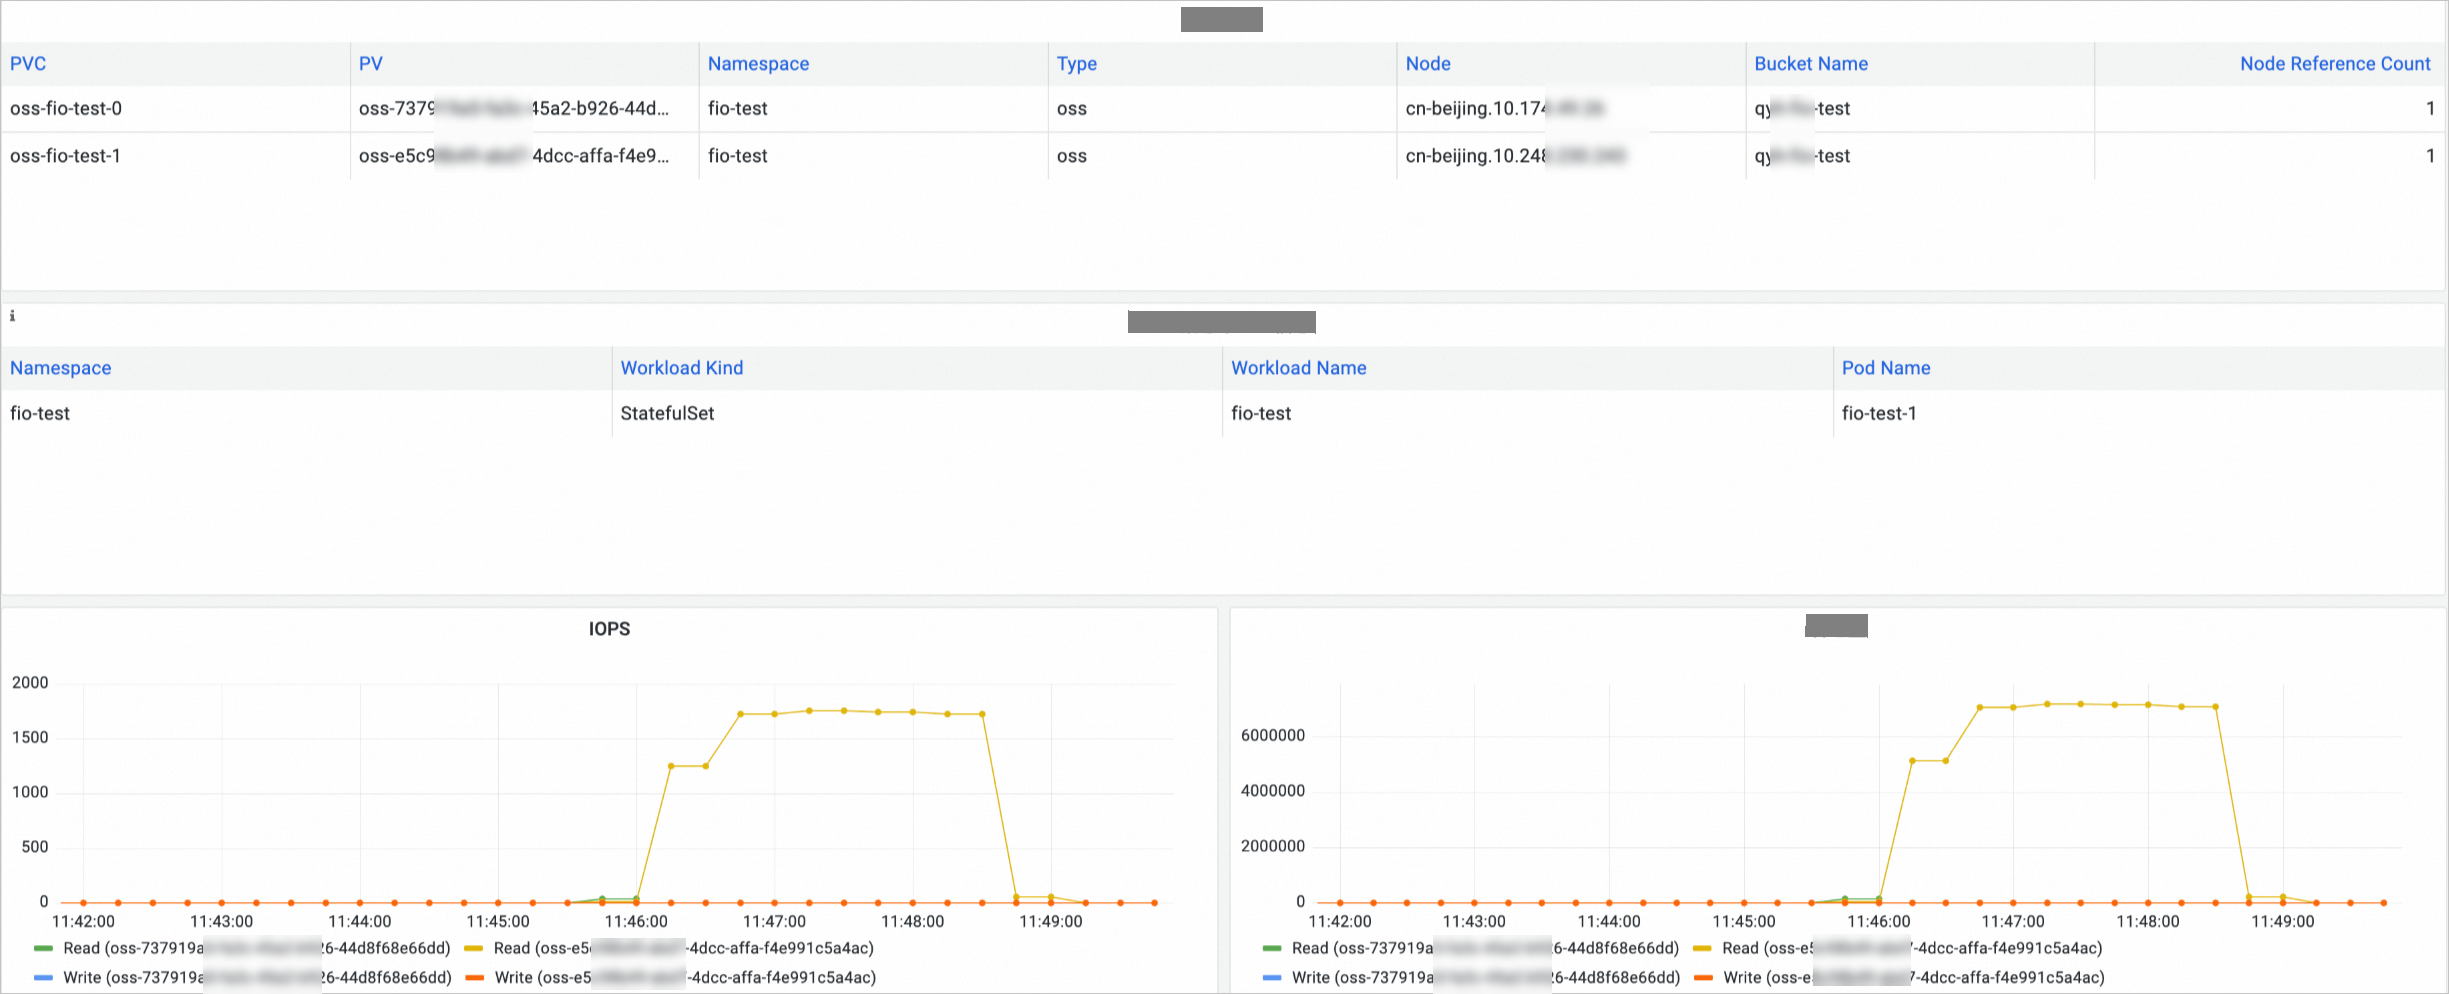
References
For more information about the storage metrics collected from containers, see Storage metrics.
For more information about how to expand volumes, see Expand a disk volume, Expand a dynamically provisioned NAS volume, and Use CNFS to automatically expand NAS volumes.