After you install an agent for an application, Cloud Monitor 2.0 starts to monitor the application. On the Entity Details page, you'll see the total requests and errors, along with the time consumed.
Prerequisite
The application is monitored by Cloud Monitor 2.0.
Try in Playground
Alibaba Cloud Playground provides a demo environment where you can experience the main features of Cloud Monitor 2.0.
Visit the Playground demo environment. By default, you are logged on to the
o11y-demo-cn-hangzhouworkspace.In the left navigation pane, choose .
View in console
Log on to the Cloud Monitor 2.0 console, and select a workspace. In the left navigation pane, choose .
On the Applications page, click an application. Then, click Entity Details.
Metrics
Section | Visualization style | Description |
Requests | Ticker board | Total number of application requests within a specified time period. Day on day: The percentage change in requests compared to the same time period on the previous day. |
Errors | Ticker board | Total number of application errors within a specified time period. Day on day: The percentage change in errors compared to the same time period on the previous day. |
Average response time | Ticker board | The average response time of the application within a specified time period. Day on day: The percentage change in the average response time compared to the same time period on the previous day. |
Full GC count | Ticker board | The number of Full Garbage Collection (Full GC) events performed by the JVM in the last N minutes. This metric helps determine if the application is running Full GCs too often, which can indicate an issue. Week on week: The percentage change in the Full GC count compared to the same time period in the previous week. |
Requests | Column chart | Shows the trend of application requests over a specified time period. The data is stacked and categorized by call type. |
Errors | Column chart/Trend graph | Error count: The trend of application errors within a specified time period, displayed as a column chart. The left axis represents the error count. Error rate: The trend of the application error rate within a specified time period. The right axis represents the error rate. |
Response time | Trend graph | Shows the application's response time trend over a specified time period. The graph includes trends for average response time, P99, P90, and P75. |
Instance GC count | Trend graph | Shows the trend of Young GC and Full GC events performed by the JVM over a specified time period. |
Top services by requests | Top 5 | The top 5 services with the most interface requests in the specified time period. Call types for these services include the following:
|
Top services by errors | Top 5 | The top 5 services with the most interface errors in the specified time period. Call types for these services include the following:
|
Top services by average response time | Top 5 | The top 5 services with the longest average interface response time in the specified time period. Call types for these services include the following:
|
Top instances by Full GC count | Top 5 | The 5 instances with the most Full GC events performed by the JVM in the specified time period. |
Panel features
Drill-down analysis
Click the  icon on the trend graph panel to further analyze the current metric.
Modify or add query metrics. Then, click Execute Query to view the corresponding metric panel.
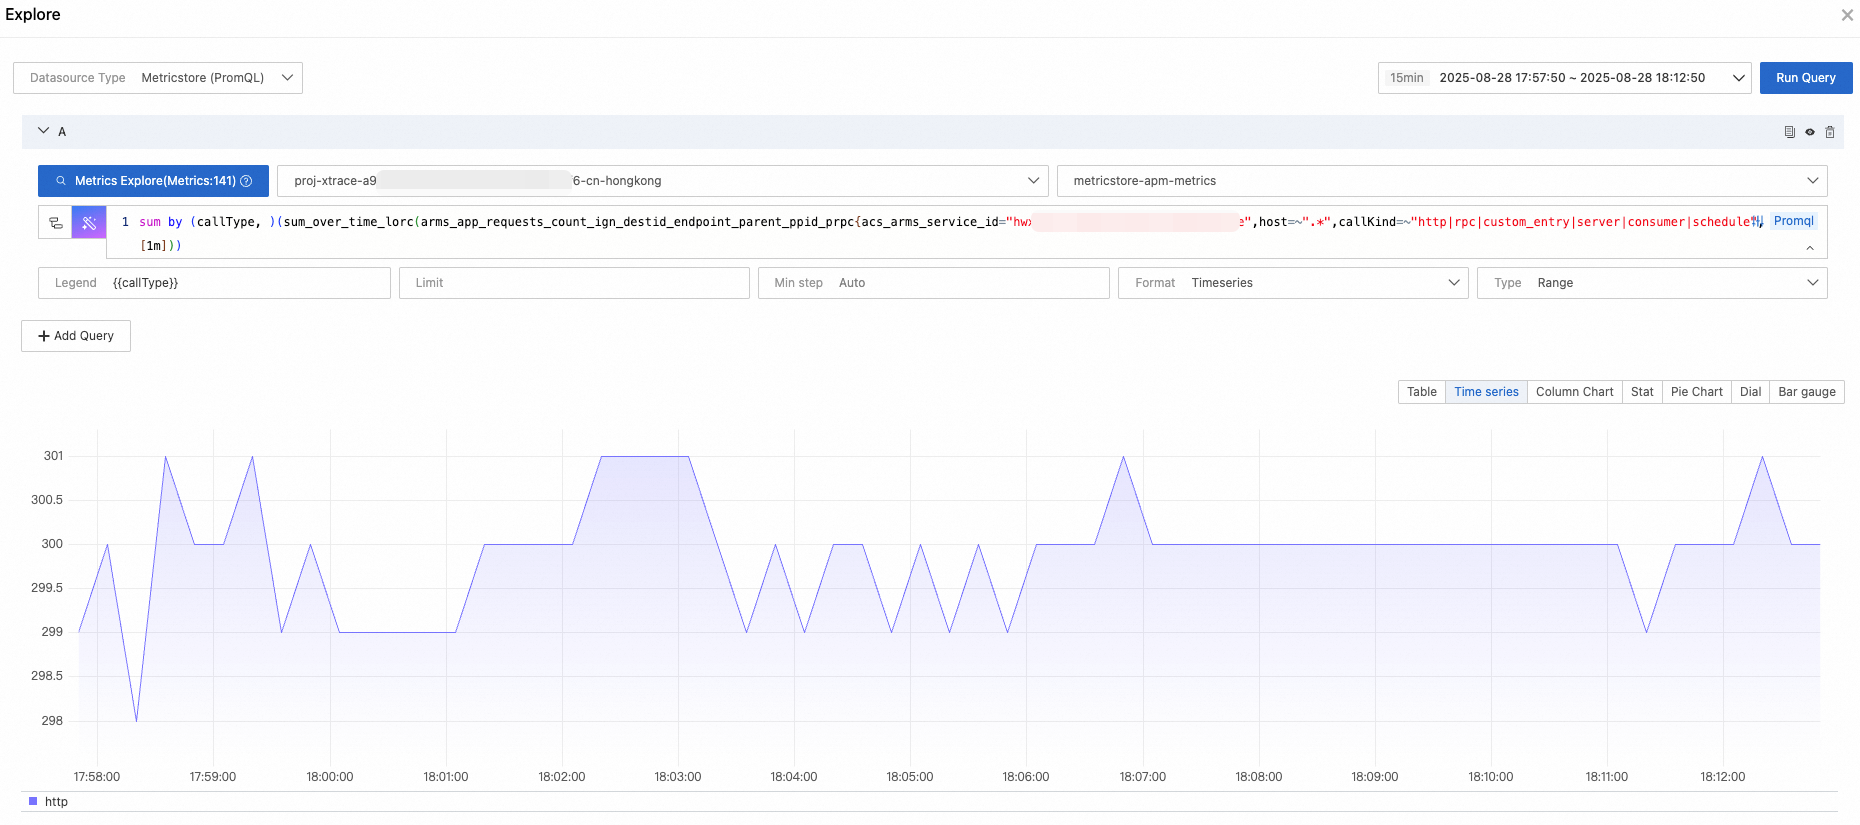
Obtain the Prometheus Query Language (PromQL) for the current metric. Use the PromQL in Grafana to complete the custom configuration.
Comparison
Click the
 icon on the trend graph panel to set the comparison time.
Click the
 icon to cancel the metric comparison and return to the initial state.