Compatible with open source Grafana and Prometheus, Application Real-Time Monitoring Service (ARMS) has designed an observability solution based on Grafana and Prometheus to meet your requirements for custom dashboards. This topic describes how to create a custom Grafana dashboard and how to create custom statements to import data to the dashboard.
Background information
Managed Service for Prometheus integrates with the monitoring data of Application Monitoring to visualize metrics. You can obtain application monitoring data, view preset dashboards, and perform secondary development based on your business requirements in Managed Service for Prometheus.
Prerequisites
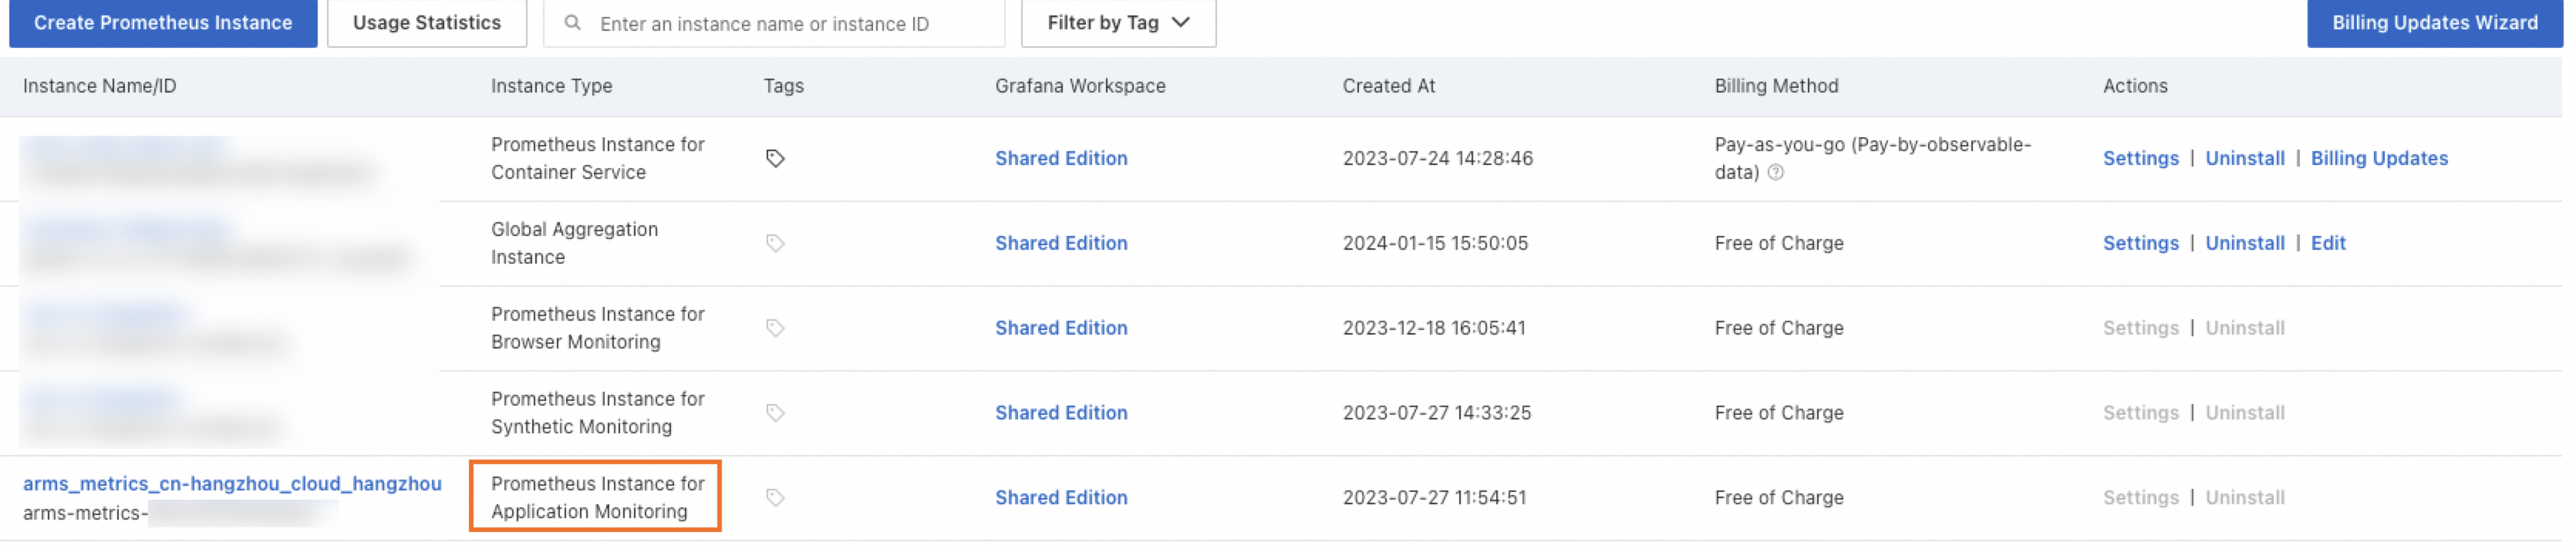
Application Monitoring automatically creates a free Prometheus instance in the region where your application is deployed. As shown in the following figure, all metrics of your application monitored in the China (Hangzhou) region are stored in the Prometheus instance named arms_metrics_cn-hangzhou_cloud_hangzhou.

Scenarios
You want to re-create a dashboard based on the Application Monitoring metrics.
In daily O&M, you want to combine the Application Monitoring metrics with the metrics of other data sources to create a dedicated dashboard.
In the beginning of peak hours, you want to combine the Application Monitoring metrics with the metrics of upstream services or downstream services to create a dedicated dashboard.
You can view application monitoring data obtained in Managed Service for Prometheus in a self-managed Grafana system.
You can use application monitoring data obtained in Managed Service for Prometheus for secondary development.
Prerequisites
An ARMS agent is installed for the application. For more information, see Application Monitoring overview.
Grafana is installed on your local computer or a Managed Service for Grafana workspace is created.
Create a custom dashboard
Step 1: Integrate the monitoring data of an Application Monitoring application into Grafana
By default, Managed Service for Prometheus integrates the monitoring data of Application Monitoring. You can simply integrate the Prometheus instance used to store the monitoring data of your application into Grafana.
Add a data source to a self-managed Grafana system
Obtain the HTTP API address of the Prometheus instance.
Log on to the ARMS console. In the left-side navigation pane, choose . In the top navigation bar, select the region where the application is deployed.
Instances whose instance type is Prometheus Instance for Application Monitoring are used to store the monitoring data of applications monitored in Application Monitoring.
Click the name of such a Prometheus instance. On the page that appears, click Settings in the left-side navigation pane to view the HTTP API address.
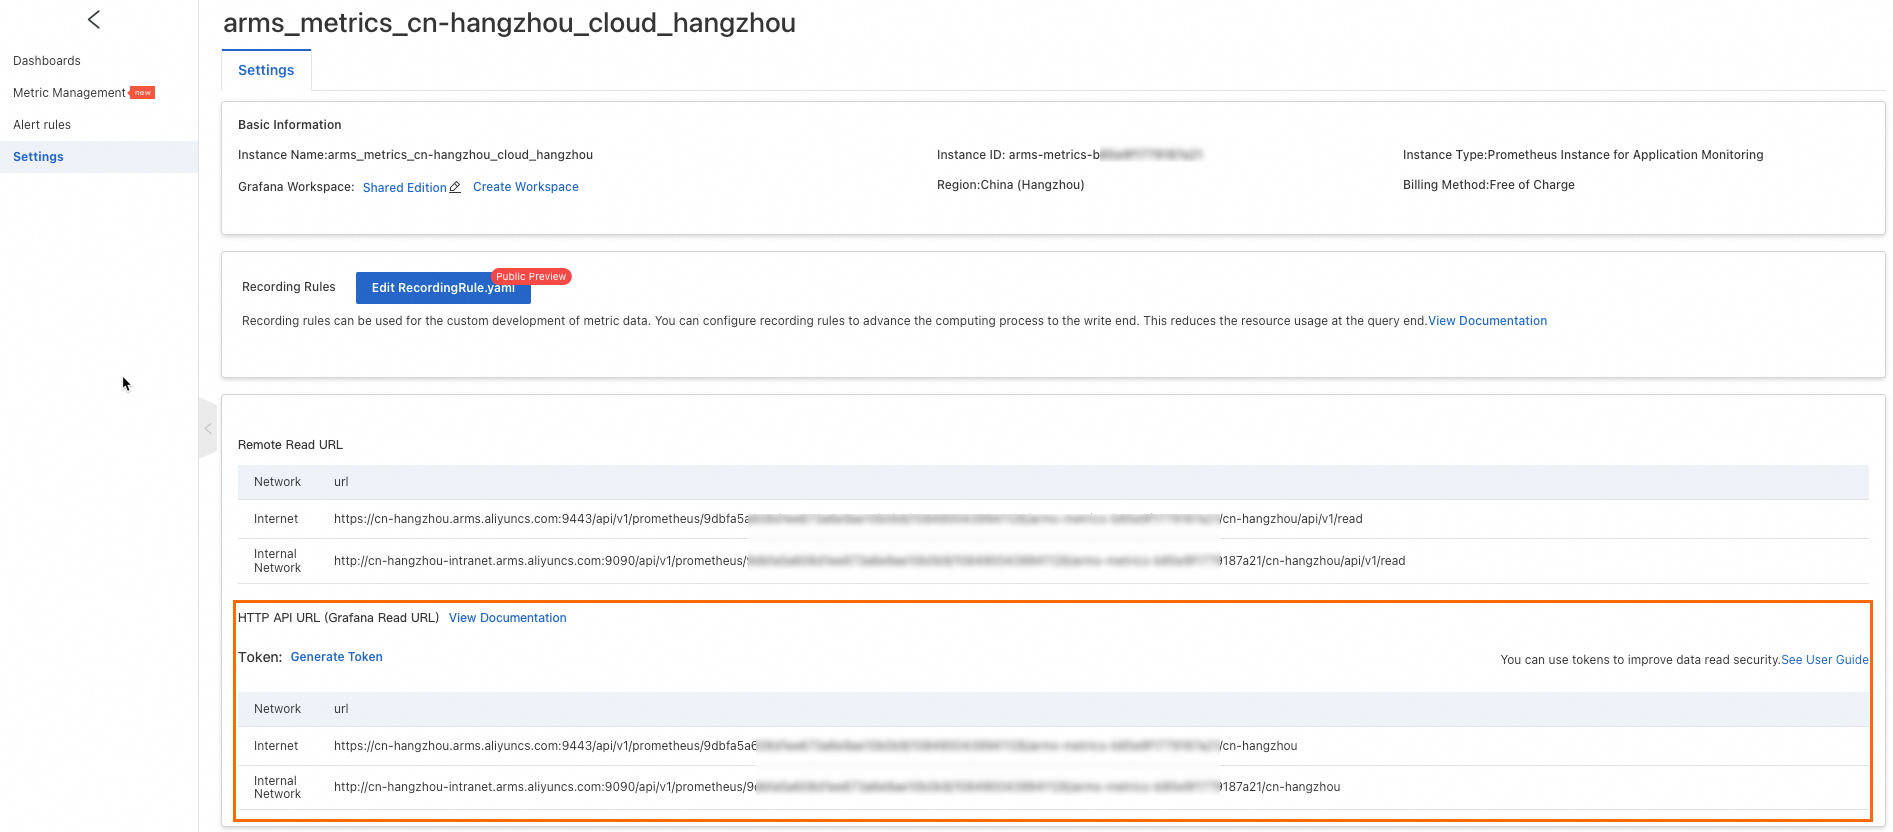
Optional. Click Generate Token to obtain the authentication token for the Prometheus instance. The token is used to ensure data security when monitoring data is imported to Grafana.
ImportantAfter the authentication token is generated, you must specify the token when you add the Prometheus instance to your Grafana system as a data source. Otherwise, monitoring data cannot be read from the Prometheus instance.
Add the Prometheus instance as a data source to the Grafana system.
In this example, Grafana 10.x is used. For information about how to add a data source in other Grafana versions, see Grafana documentation.
Log on to the Grafana system as an administrator.
Move the pointer over the
 icon in the upper-left corner and click Data sources.
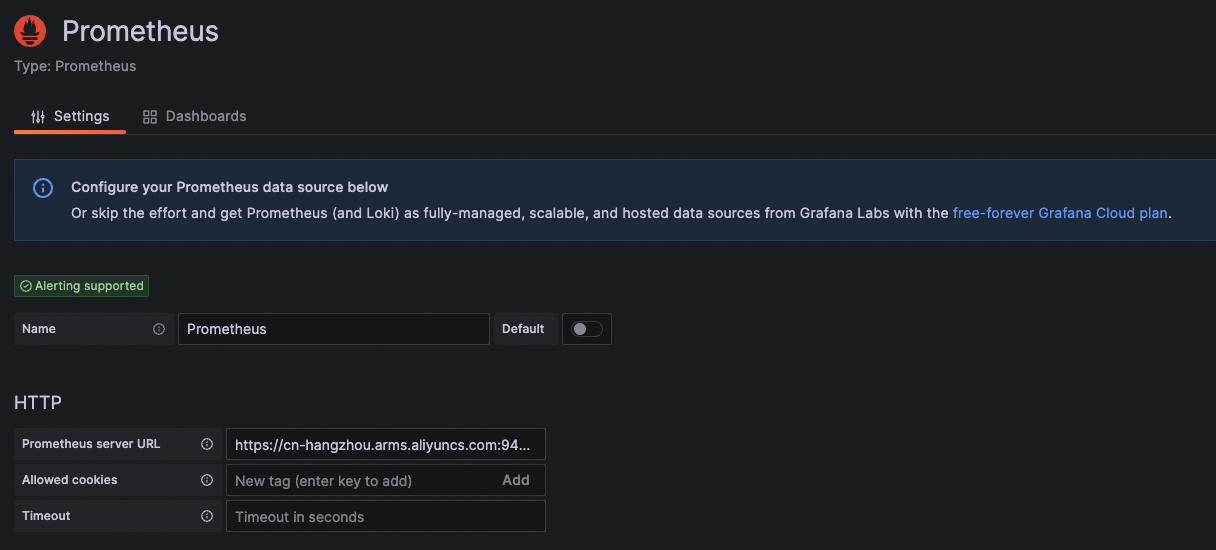
 Click Add data source and select Prometheus as the data source type.
On the Settings tab, enter a custom name in the Name field and enter the HTTP API address obtained in the preceding step in the Prometheus server URL field of the HTTP section.
Optional. In the Custom HTTP Headers section, click + Add header. Set the Header parameter to Authorization and the Value parameter to the token generated in the preceding step.
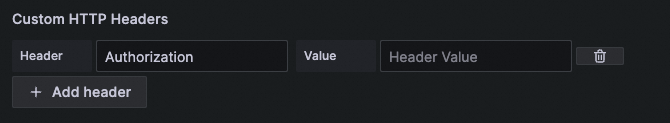
Click Save & test.
Add a data source to a Managed Service for Grafana
You can integrate the monitoring data of an application monitored in Application Monitoring into Managed Service for Grafana.
Log on to the ARMS console. In the left-side navigation pane, choose . On the Workspace Management page, click the workspace ID.
On the Workspace Information page, click ARMS Application Monitoring in the Cloud Service Integration section. Find the Prometheus instance in the destination region and click Integrations in the Actions column.
In the message that appears, click OK.
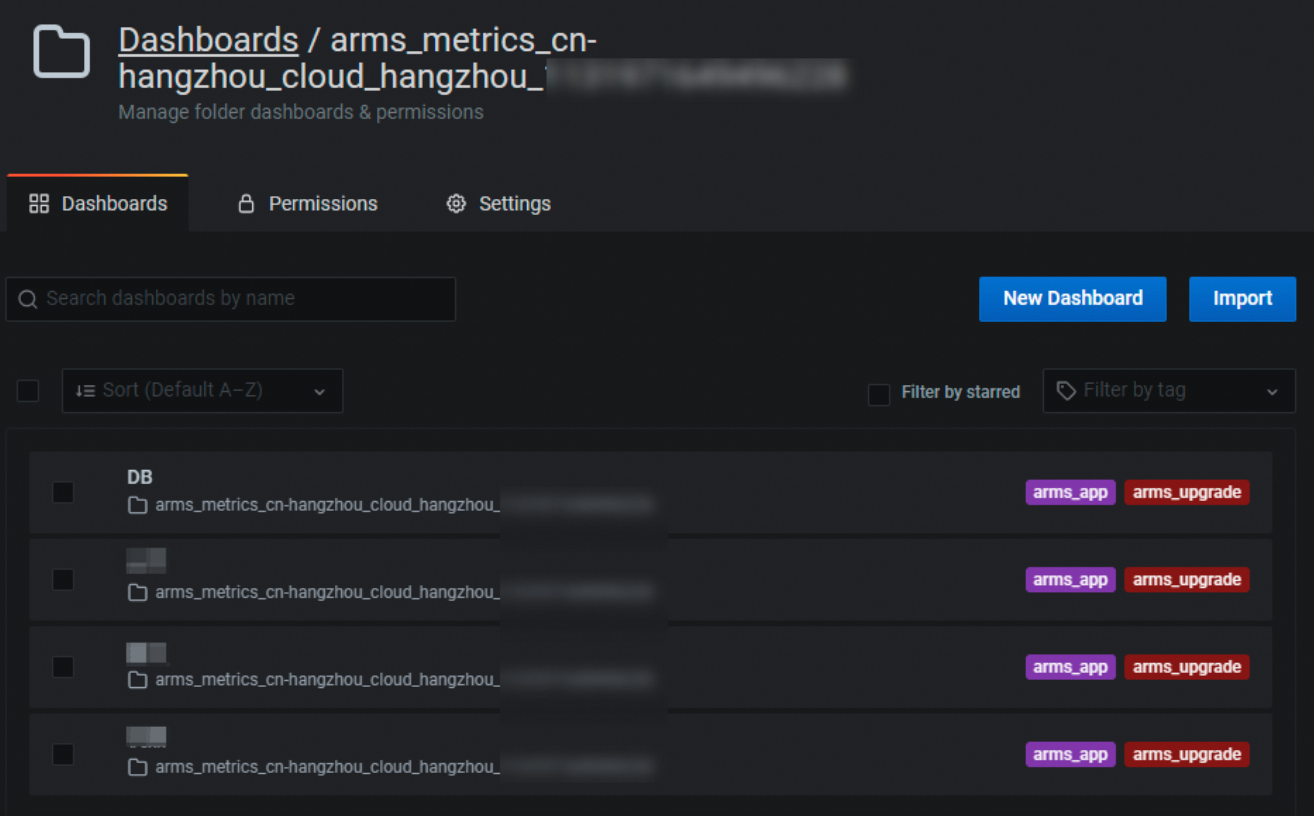
After the synchronization is complete, click Folder in the Actions column.
On the Dashboards tab of the page that appears, click a dashboard name to view the preset Application Monitoring dashboard.
Move the pointer over the
icon in the upper-left corner and click Data sources to view the data source. 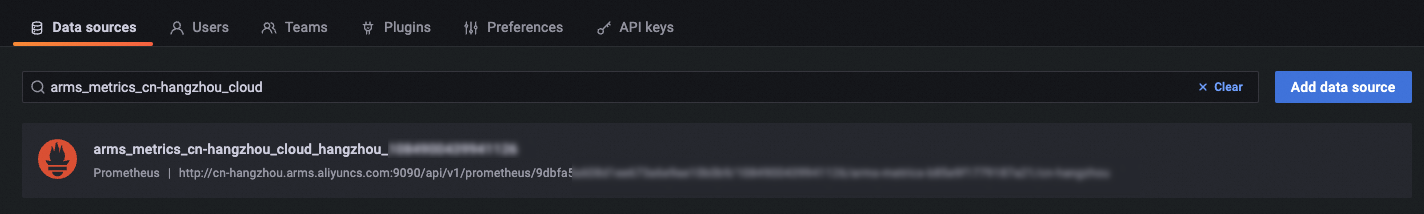
Step 2: Create a custom dashboard
Move the pointer over the
icon in the upper-left corner and click Dashboards. On the Dashboards page, click New Dashboard. On the New dashboard page, click Add an empty panel to create a dashboard panel.
In the Select data source dialog box, select the data source. The default format of a data source name is arms_metrics_{regionid}_cloud.
ImportantMake sure that data is available in the current data source.
Configure the following query parameters in the A section.
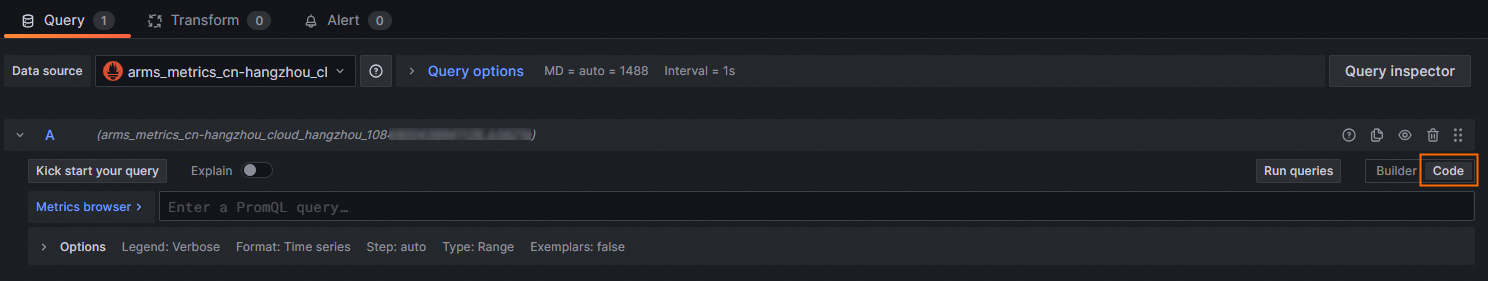
Specify PromQL query statements
In Code mode, enter a PromQL statement on the right side of Metrics browser.
On the application details page in the Application Monitoring module, find a metric and click the
 icon to view the PromQL statement corresponding to the metric. For more information, see Application overview.
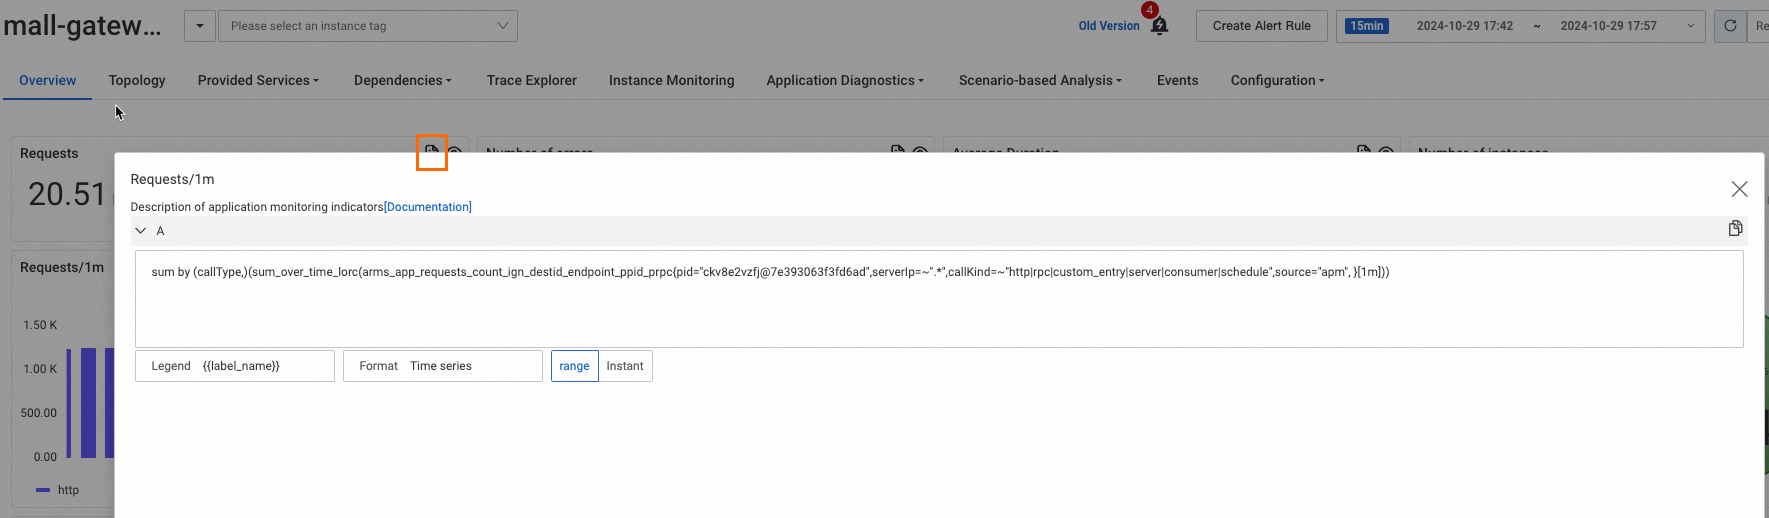
For more information about PromQL statements, see Prometheus documentation.
Specify application metrics
In Builder mode, select a metric from the Metric drop-down list, such as
arms_jvm_threads_count, to query the number of JVM threads. For information about the metrics supported by Application Monitoring, see Application monitoring metrics.In the Label filters section, specify a label and a value.
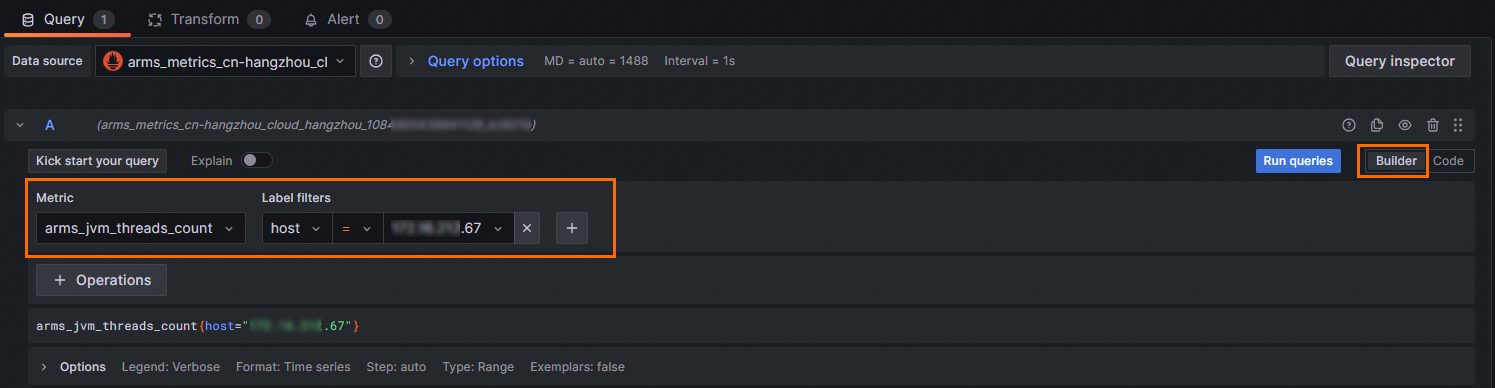
On the right-side Panel tab, set the title of the panel and select chart types.
NoteYou can select multiple chart types for a metric to obtain charts with different granularities.
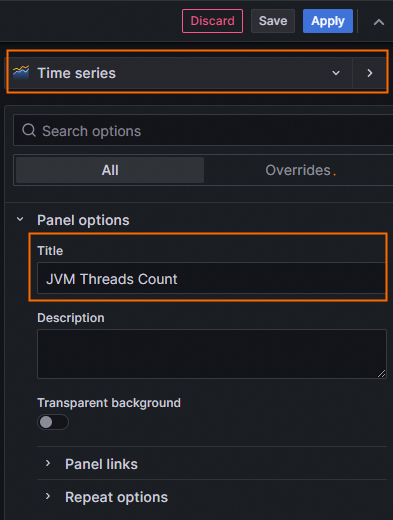
Click Apply in the upper-right corner.
Create custom query statements
Based on the Prometheus HTTP API addresses and PromQL statements obtained in the ARMS console, you can use shell scripts or Java to make HTTP requests to customize the monitoring data.
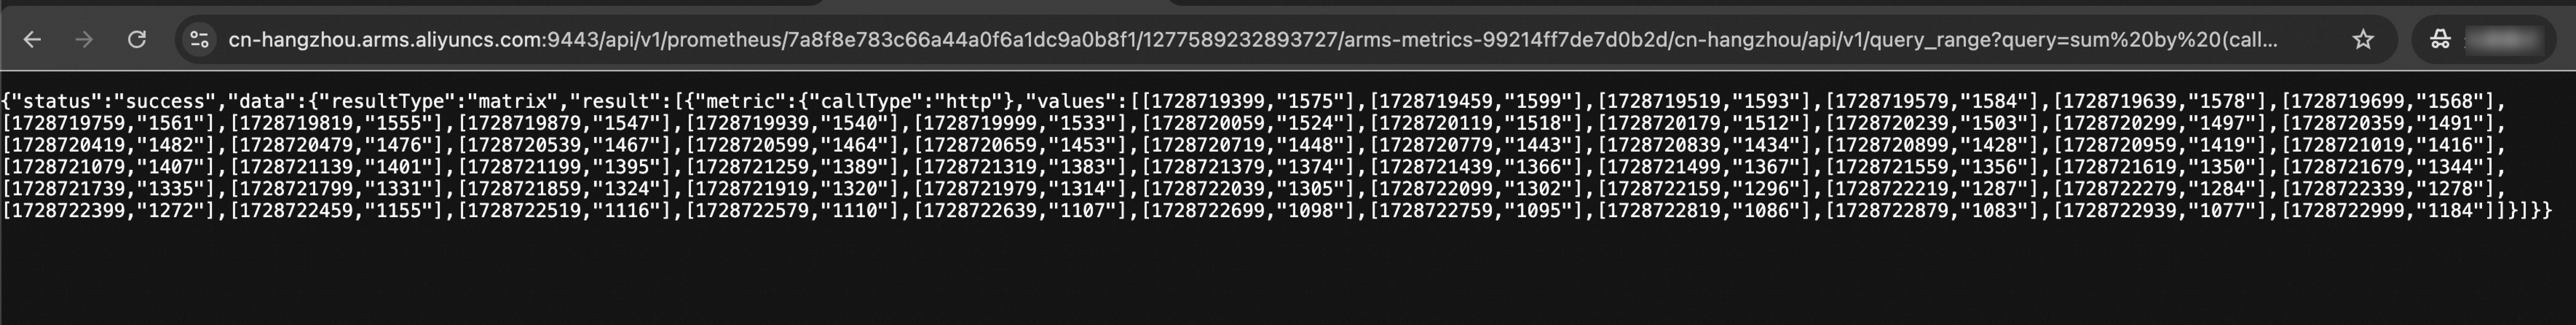
For example, a Prometheus HTTP API address is https://cn-hangzhou.arms.aliyuncs.com:9443/api/v1/prometheus/7a8f8e783c66a44a0f6a1dc9a0b8f1/1277589232893727/arms-metrics-99214ff7de7d0b2d/cn-hangzhou. Combine it with a PromQL statement in the following format:
{{Prometheus HTTP API}}/api/v1/query_range?query={{PromQL}}&start={{startTime}}&end={{endTime}}&step={{step}}
Output query statement:
https://cn-hangzhou.arms.aliyuncs.com:9443/api/v1/prometheus/7a8f8e783c66a44a0f6a1dc9a0b8f1/1277589232893727/arms-metrics-99214ff7de7d0b2d/cn-hangzhou/api/v1/query_range?query=sum by (callType,)(sum_over_time_lorc(arms_app_requests_count_ign_destid_endpoint_ppid_prpc{pid="ckv8e2vzfj@7e393063f3fd6ad",serverIp=~".*",callKind=~"http|rpc|custom_entry|server|consumer|schedule",source="apm", }[1m]))&start=1728719399&end=1728722999&step=60s
The following data is queried with the statement.
FAQs
Am I charged for querying data?
No, data queries are free.
Is throttling triggered when I run PromQL statements?
Throttling protection is available but does not apply to the number of queries per second (QPS). We recommend avoiding time-consuming queries, such as querying all operations or retrieving data older than 30 days, and keeping your incoming query rate below 50 QPS. If you need to run continuous high-consumption queries, submit a ticket to increase the quota.