This topic describes the Overview, Alert Center, Resource Usage, and Governance detection tabs of the Cloud Monitor console.
Overview
On the Overview tab, data is refreshed in real time. You can quickly learn about the health status of resources in the current Alibaba Cloud account, as shown in the following figure.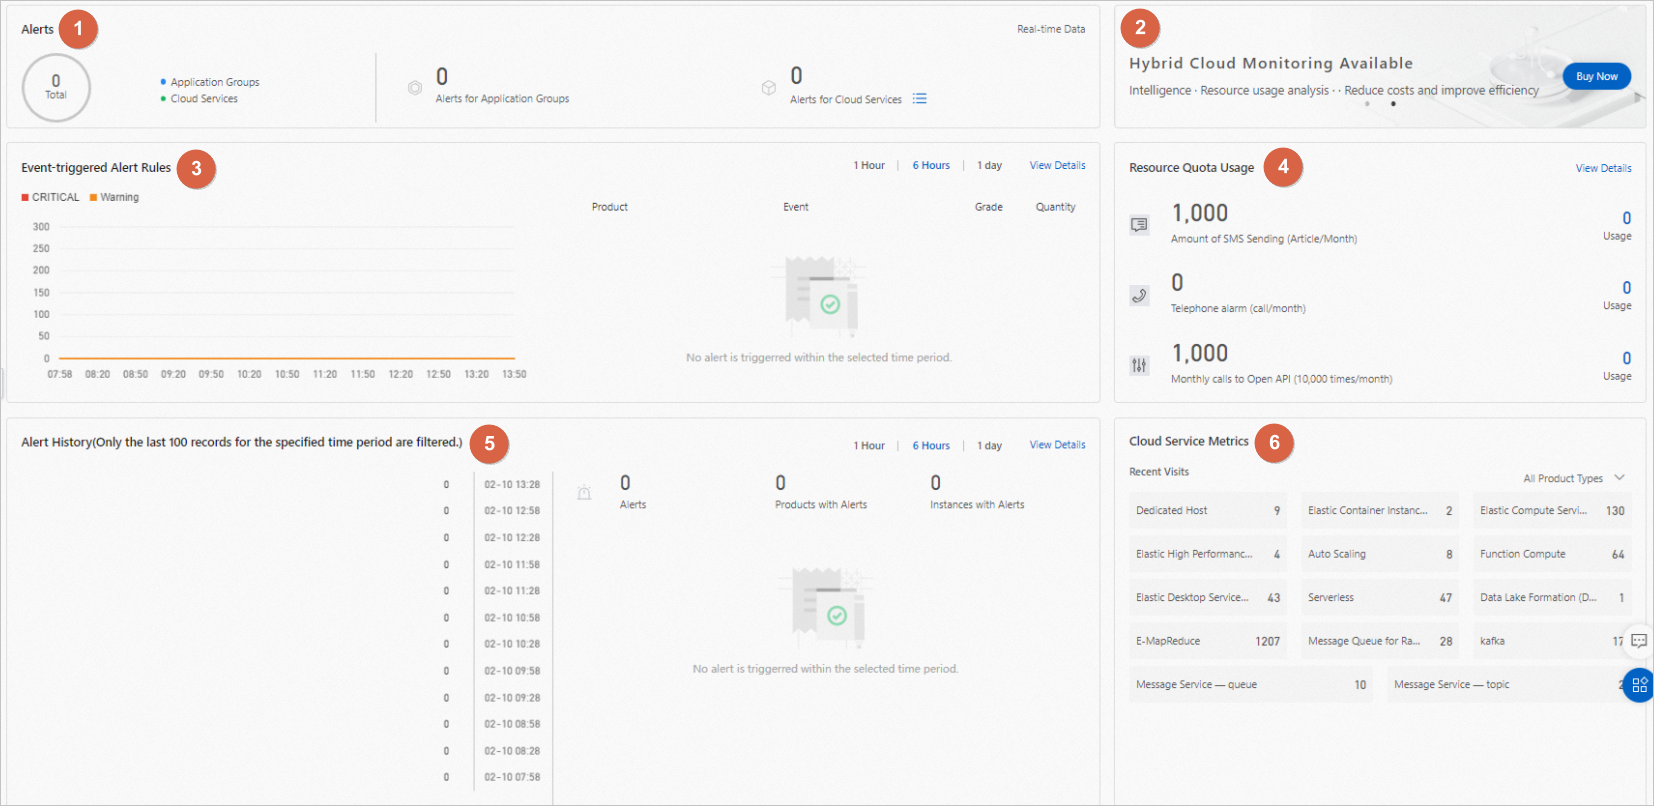
No. | Description | References |
1 | You can view the number of threshold-triggered alerts for resources in the cloud services and application groups of the current Alibaba Cloud account. | |
2 | You can view recommended features and tutorials. | None. |
3 | You can view critical and warning alerts that have been triggered by events in the last 1 hour, 6 hours, or 1 day in the current Alibaba Cloud account. | |
4 | You can view the usage of the free quotas provided by Cloud Monitor Basic for the current Alibaba Cloud account. | |
5 | You can view threshold-based alerts that have been triggered in the last 1 hour, 6 hours, or 1 day in the current Alibaba Cloud account. | |
6 | You can view the metrics of the cloud services that are recently accessed by the current Alibaba Cloud account. |
Alert Center
On the Alert Center tab, you can view the alert history charts and alert history details in the current Alibaba Cloud account. You can also view the statistics and details of historical alerts. This helps you quickly understand the overall alert status of resources.
Resource Usage
On the Resource Usage tab, you can view the resource usage of Network Analysis and Monitoring, Cloud Monitor Basic, and Hybrid Cloud Monitoring in the current Alibaba Cloud account. You can activate or deactivate pay-as-you-go Network Analysis and Monitoring and pay-as-you-go Hybrid Cloud Monitoring. You can also purchase resource plans of Network Analysis and Monitoring. For more information, see Resource usage.
Monitoring governance
Cloud Monitor provides the monitoring governance feature to help you build a complete monitoring system. The feature allows you to evaluate your resources and configurations and provides governance solutions. You can click One-click governance to automatically fix all issues or fix issues based on your needs. For more information, see Monitoring governance.