Cloud Enterprise Network (CEN) collects monitoring data for transit routers, network instance connections, inter-region connections, Express Connect circuits, and bandwidth plans. Use this data to track traffic rates, bandwidth usage, and packet drops across your network. Cloud Monitor collects CEN metrics at 1-minute intervals and supports threshold-based alert rules for proactive anomaly detection.
View monitoring data on the Charts tab
The Charts tab provides a consolidated view of monitoring metrics for all resources attached to a CEN instance.
To view QoS queue metrics for an inter-region connection, use the Monitoring tab on that connection instead. See View monitoring metrics for an inter-region connection.
The Charts tab shows metrics only for bandwidth plans bound to the current CEN instance. To view metrics for any bandwidth plan, see View monitoring metrics for a bandwidth plan.
Log on to the CEN console.
On the Instances page, click the ID of the CEN instance that you want to manage.
Click the Charts tab to view monitoring metrics.
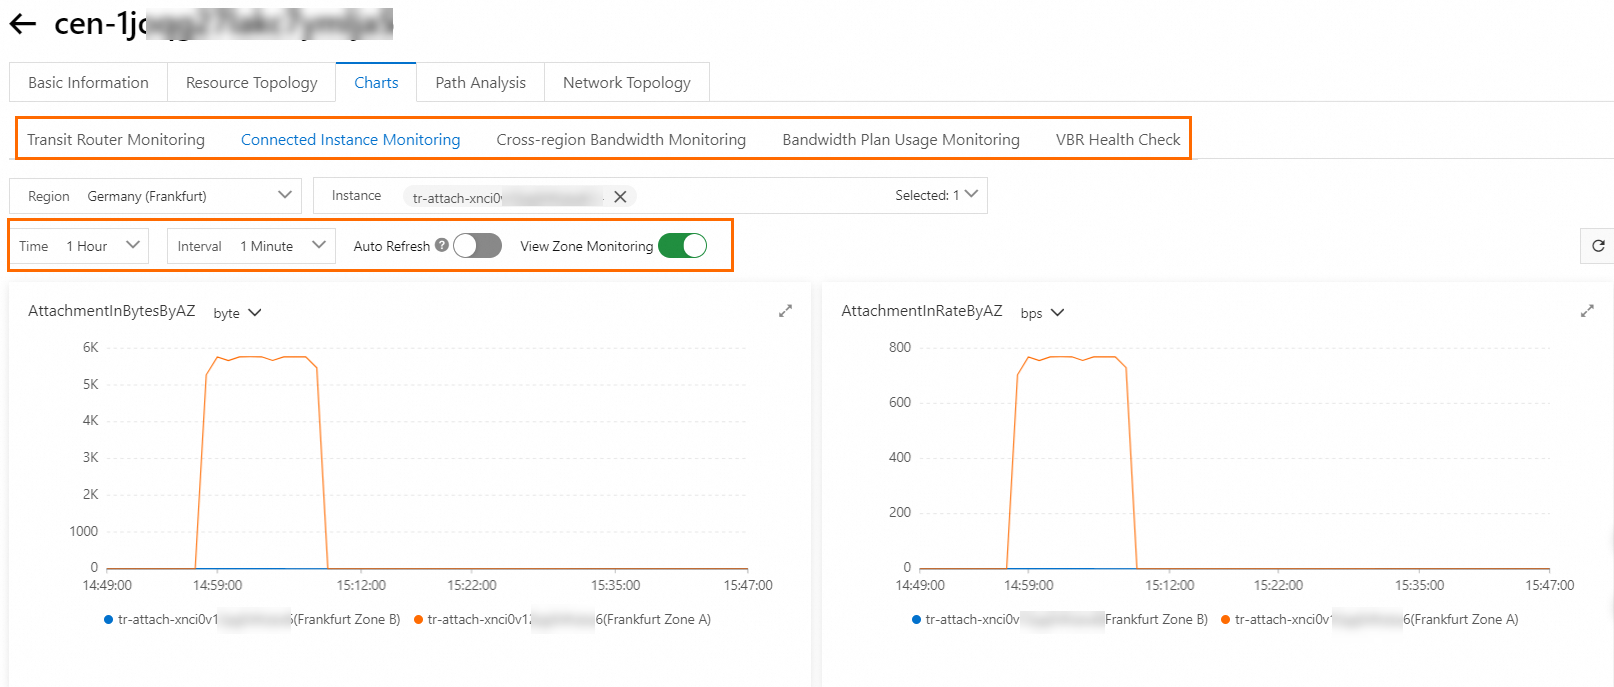 The Charts tab supports the following options:
Time range: By default, the tab displays data from the last hour at a 1-minute interval. Select 3 hours, 6 hours, 12 hours, 1 day, 7 days, or 30 days, or specify a custom time range. Change the Time Interval as needed.
Auto Refresh: Enable this option to refresh the chart with the latest data every minute.
Zone-level Results: Enable this option for transit routers and network instance connections (VPC, ECR, VPN, and VBR connections) to display metrics by zone. Each line in the chart represents a different zone.
View monitoring metrics for a transit router
Log on to the CEN console.
On the Instances page, click the ID of the CEN instance that you want to manage.
On the Basic Information > Transit Router tab, find the transit router and click the
 icon in the Monitoring column.
View the metrics in the Monitoring panel.
View monitoring metrics for a network instance connection
Log on to the CEN console.
On the Instances page, click the ID of the CEN instance that you want to manage.
On the Basic Information > Transit Router tab, find the transit router with the attached network instance connection and click its instance ID.
On the Intra-region Connections tab, find the target connection and click the
icon in the Monitoring column. View the monitoring data in the Monitoring panel.
View monitoring metrics for an inter-region connection
Log on to the CEN console.
On the Instances page, click the ID of the CEN instance that you want to manage.
On the Basic Information > Transit Router tab, find the transit router to which the inter-region connection is attached and click its instance ID.
Click the Inter-region Connections tab.
Find the target inter-region connection and click the
icon in the Monitoring column.Select All Queues in the upper-left corner of the Monitoring panel to view connection-level metrics.
Select Default Queue or a specific queue to view QoS queue metrics.
View monitoring metrics for an Express Connect circuit
Log on to the CEN console.
In the left-side navigation pane, click VBR Health Check.
On the VBR Health Check page, select the region where the VBR instance is deployed.
Find the target health check configuration and click the
icon in the Monitoring column.
View monitoring metrics for a bandwidth plan
Bandwidth plan bound to a CEN instance
Log on to the CEN console.
On the Instances page, find the CEN instance bound to the target bandwidth plan and click its instance ID.
On the Basic Information > Bandwidth Plans tab, find the target bandwidth plan.
Click the
icon in the Monitoring column.
Any bandwidth plan
Log on to the CEN console.
In the left-side navigation pane, click Bandwidth Plans.
Find the target bandwidth plan and click the
icon in the Monitoring column.
Create a threshold-based alert rule
Use Cloud Monitor to create alert rules that notify you when a metric exceeds a specified threshold. This helps you detect issues early and prevent service interruptions.
Log on to the CEN console.
On the Instances page, click the ID of the CEN instance that you want to manage.
On the Basic Information > Transit Router tab, find an Enterprise Edition transit router and click Set Alert in the Monitoring column.
In the Configure Rule Description panel, click Cancel.
In the Create Alert Rule panel, configure the parameters and click Confirm. For details about all parameters, see Create an alert rule. The key CEN-specific parameters are:
Product: The resource type to monitor. | Value | Monitors | |-------|----------| | CEN - Area | Bandwidth plan instances | | CEN - Region | Inter-region connections and QoS queues | | CEN - VBR | Express Connect circuits | | CEN - TR | Transit routers and network instance connections |
Associated Resources: The scope of resources to monitor.
Rule Description: Click Add Rule, select a metric from the drop-down list, and set the rule conditions in the Configure Rule Description panel.
Alert rules cannot be created for the Latency metric of inter-region connections.
Supported resources and monitoring granularity
CEN supports monitoring at different granularity levels depending on the resource type.
VPC, ECR, VPN, and VBR connection metrics are available only on the Enterprise Edition transit routers to which these connections are attached.
| Resource | Monitoring granularity |
|---|---|
| Enterprise Edition transit router | Instance-level and zone-level |
| VPC connection | Connection-level and zone-level |
| ECR connection | Connection-level and zone-level |
| VPN connection | Connection-level and zone-level |
| VBR connection | Connection-level and zone-level |
| Inter-region connection | Connection-level. If a QoS policy is configured, per-queue metrics are also available. QoS queue metrics are available only on Enterprise Edition transit routers. |
| Express Connect circuit | Monitors only the traffic rate and bandwidth usage of the VBR instance on the circuit. |
| Bandwidth plan | Instance-level |
Zone-level monitoring
When an Enterprise Edition transit router connects to a VPC, ECR instance, VBR instance, or IPsec-VPN connection, the system deploys resources in specific zones to establish the connection.
VPC connections: Specify the zones when creating the connection.
ECR, VBR, and VPN connections: The system automatically selects zones and deploys resources.
CEN monitors all zones that are supported by the Enterprise Edition transit router and have connected resources. If a zone does not appear in monitoring data, no resources are connected and no traffic has been transmitted in that zone.
How metrics are collected
Each data point represents the average value of data collected within a 1-minute period, with the following distinctions:
Peak bandwidth rate metrics: The system samples a bandwidth rate every 10 seconds within each 1-minute period (6 samples total). The maximum of the 6 samples is the peak rate for that minute. Use peak bandwidth rate to detect micro-burst traffic at the per-second level.
Average bandwidth rate metrics: The system averages the bandwidth rates across the full 1-minute period.
Instance-level vs. zone-level metrics
For transit routers and network instance connections (VPC, ECR, VPN, and VBR), metrics are available at two levels:
Instance-level: Aggregated across all zones. Descriptions use "total" (for example, "The total number of bytes...").
Zone-level: Scoped to a specific zone. Descriptions refer to a specific zone (for example, "The number of bytes...in a specific zone").
The metrics listed in the following sections apply to both levels unless stated otherwise. Toggle Zone-level Results in the console to switch between views.
Transit router metrics
The following 16 metrics are available for Enterprise Edition transit routers. Each metric has both an instance-level value (aggregated across all zones) and a zone-level value (scoped to a specific zone).
Traffic metrics
| Metric | Description | Unit |
|---|---|---|
| Inbound Bytes | Bytes received from network instance connections. | Byte |
| Inbound Traffic Rate | Rate of traffic received from network instance connections. | bps |
| Inbound Packets | Packets received from network instance connections. | packets |
| Inbound Packet Rate | Rate of packets received from network instance connections. | pps |
| Outbound Bytes | Bytes sent to network instance connections. | Byte |
| Outbound Traffic Rate | Rate of traffic sent to network instance connections. | bps |
| Outbound Packets | Packets sent to network instance connections. | packets |
| Outbound Packet Rate | Rate of packets sent to network instance connections. | pps |
Drop metrics (no matching route)
| Metric | Description | Unit |
|---|---|---|
| Bytes Dropped Due to Missing Route | Bytes dropped because no matching route was found. | Byte |
| Rate of Traffic Dropped Due to Missing Routes | Rate of traffic dropped because no matching route was found. | bps |
| Packets Dropped Due to Missing Routes | Packets dropped because no matching route was found. | packets |
| Rate of Packets Dropped Due to Missing Routes | Rate of packets dropped because no matching route was found. | pps |
Drop metrics (blackhole route)
| Metric | Description | Unit |
|---|---|---|
| Bytes Dropped Due to Blackhole Routes | Bytes dropped because a blackhole route was matched. | Byte |
| Rate of Traffic Dropped Due to Blackhole Routes | Rate of traffic dropped because a blackhole route was matched. | bps |
| Packets Dropped Due to Blackhole Routes | Packets dropped because a blackhole route was matched. | packets |
| Rate of Packets Dropped Due to Blackhole Routes | Rate of packets dropped because a blackhole route was matched. | pps |
Intra-region connection metrics
VPC connections, ECR connections, VPN connections, and VBR connections share the same set of 16 metrics. Each metric has both a connection-level value (aggregated across all zones) and a zone-level value (scoped to a specific zone).
Traffic metrics
| Metric | Description | Unit |
|---|---|---|
| AttachmentInBytes | Bytes transmitted from the network instance to the transit router. | Byte |
| AttachmentInRates | Traffic rate from the network instance to the transit router. | bps |
| AttachmentInPackets | Packets transmitted from the network instance to the transit router. | packets |
| AttachmentInPacketsRate | Packet rate from the network instance to the transit router. | pps |
| AttachmentOutBytes | Bytes transmitted from the transit router to the network instance. | Byte |
| AttachmentOutRate | Traffic rate from the transit router to the network instance. | bps |
| AttachmentOutPackets | Packets transmitted from the transit router to the network instance. | packets |
| AttachmentOutPacketsRate | Packet rate from the transit router to the network instance. | pps |
Drop metrics (no matching route)
| Metric | Description | Unit |
|---|---|---|
| AttachmentNoRouteDropBytes | Bytes dropped because no matching route was found. | Byte |
| AttachmentNoRouteDropRate | Rate of traffic dropped because no matching route was found. | bps |
| AttachmentNoRouteDropPackets | Packets dropped because no matching route was found. | packets |
| AttachmentNoRouteDropPacketsRate | Rate of packets dropped because no matching route was found. | pps |
Drop metrics (blackhole route)
| Metric | Description | Unit |
|---|---|---|
| AttachmentBlackHoleDropBytes | Bytes dropped because a blackhole route was matched. | Byte |
| AttachmentBlackHoleDropRate | Rate of traffic dropped because a blackhole route was matched. | bps |
| AttachmentBlackHoleDropPackets | Packets dropped because a blackhole route was matched. | packets |
| AttachmentBlackHoleDropPacketsRate | Rate of packets dropped because a blackhole route was matched. | pps |
Inter-region connection metrics
Connection-level metrics
| Metric | Description |
|---|---|
| InterRegionPeakBandwidthRate | For two communicating regions (Region A and Region B), reports four values: peak bandwidth rate from A to B (bps), peak bandwidth rate from B to A (bps), average bandwidth rate from A to B (bps), and average bandwidth rate from B to A (bps). |
| InterRegionPeakBandwidthUtilization | For two communicating regions (Region A and Region B), reports four values: percentage of bandwidth consumed by peak traffic from A to B, percentage from B to A, percentage consumed by average traffic from A to B, and percentage from B to A. |
| InterRegionRateLimitDropPackets | For two communicating regions (Region A and Region B), reports two values: packet loss rate due to throttling from A to B (pps) and from B to A (pps). |
| LatencyByConnectionRegion | Average communication latency between the two regions. Unit: ms. You can also view latency for inter-region connections that use Platinum or Gold links on an Enterprise Edition transit router in the Network Intelligence Service console. For more information, see View network performance between regions. |
The legacy metrics Outbound Bandwidth by Region, Outbound Bandwidth Percentage by Region, and Inter-region Throttling Packet Loss Rate are deprecated.
QoS queue metrics
QoS queue metrics are available only for inter-region connections on Enterprise Edition transit routers with a QoS policy configured.
| Metric | Description |
|---|---|
| InterRegionQosQueuePeakBandwidthRate | Reports two values: Rate of Outbound Bandwidth (peak bandwidth rate of the current queue from the local transit router to the peer, in bps) and Average Rate of Outbound Bandwidth (average bandwidth rate, in bps). |
| InterRegionQosQueuePeakBandwidthUtilization | Reports two values: Usage of Outbound Bandwidth (percentage of bandwidth consumed by peak traffic of the current queue) and Average Usage of Outbound Bandwidth (percentage consumed by average traffic). |
| InterRegionQosQueueRateLimitDropPackets | Packet loss rate of the current queue due to throttling from the local transit router to the peer. Unit: pps. |
Express Connect circuit metrics
After a transit router connects to a VBR instance, VBRInternetOutRate and VBRInternetInRate are available by default. To view VBRHealthyCheckLatency and VBRHealthyCheckLossRate, configure a health check first. For more information, see Configure health checks for a VBR.
| Metric | Description | Unit |
|---|---|---|
| VBRInternetOutRate | Bandwidth used for traffic from Alibaba Cloud to your data center. | bps |
| VBRInternetInRate | Bandwidth used for traffic from your data center to Alibaba Cloud. | bps |
| VBRHealthyCheckLatency | Communication latency between Alibaba Cloud and your data center. Requires health check configuration. | ms |
| VBRHealthyCheckLossRate | Packet loss rate between Alibaba Cloud and your data center. Requires health check configuration. | - |
Bandwidth plan metrics
| Metric | Description |
|---|---|
| CENBandwidthPackagePeakBandwidthRate | Reports two values: Outbound Peak Bandwidth Rate (peak rate of used bandwidth, in bps) and Outbound Average Bandwidth Rate (average rate, in bps). |
| CENBandwidthPackagePeakBandwidthUtilization | Reports two values: Outbound Peak Bandwidth Usage (percentage of total bandwidth consumed by peak usage) and Outbound Average Bandwidth Usage (percentage consumed by average usage). |
The legacy metrics Outbound Bandwidth By Area and Outbound Bandwidth Percentage By Area are deprecated.
References
Alert Service: View alert history and manage alert rules in the Cloud Monitor console.
Visualization overview: Create a custom monitoring dashboard in Cloud Monitor to compare metrics across resources.
Cloud service monitoring API: Query CEN monitoring data programmatically. For the Namespace, MetricName, Dimensions, and Period parameter values, see Appendix 1: Cloud service monitoring metrics.
Configure flow logs: Capture detailed traffic information for transit routers, VPC connections, ECR connections, VPN connections, VBR connections, and inter-region connections.