When using Cloud Enterprise Network (CEN) for inter-region network communication, you can analyze the top traffic by using the flow log feature of a transit router (TR).
Scenario

As shown in the figure:
Two VPCs, VPC1 and VPC2, have been respectively created in the China (Hangzhou) and China (Shanghai) regions.
Two ECS instances, ECS1 and ECS2, have been set up in VPC1. One ECS instance, ECS3, is deployed in VPC2.
An inter-region VPC connection has been established between two of the VPCs using CEN, which allows the three ECS instances to communicate with each other.
To analyze the top traffic between VPC1 and VPC2, activate flow logs for the transit routers:
Enable flow logs on TR1 to examine the traffic from VPC1 to VPC2.
Enable flow logs on TR2 to examine the traffic from VPC2 to VPC1.
This topic uses flow logs on TR1 as an example to analyze the top traffic from VPC1 to VPC2.
Network planning
VPC1:
Located in the China (Hangzhou) region with a CIDR block of 10.0.0.0/16.
vSwitch 1 is in Zone J with a CIDR block of 10.0.0.0/24, while vSwitch 2 is in Zone K with a CIDR block of 10.0.1.0/24.
The respective IP addresses of ECS1 and ECS2 are 10.0.0.1 and 10.0.0.2. Both use the
Alibaba Cloud LinuxOS image.
VPC2:
Located in the China (Shanghai) region with a CIDR block of 192.168.0.0/16.
vSwitch 1 is in Zone M with a CIDR block of 192.168.0.0/24, while vSwitch 2 is in Zone N with a CIDR block of 192.168.1.0/24.
ECS3 has an IP address of 192.168.0.1 and uses the
Alibaba Cloud LinuxOS image.
Start configuration
Step 1: Simulate traffic
Before enabling flow logs, you can run the ping command on ECS instances to simulate traffic if there is no mutual access traffic between them.
On ECS1, run the ping command to reach ECS3 with a packet size of 100 bytes.
ping 192.168.0.1 -s 100On ECS2, run the ping command to reach ECS3 with a packet size of 10,000 bytes.
ping 192.168.0.1 -s 10000
Keep the ping commands active instead of terminating them. The packets are deliberately set at different sizes to compare top traffic more easily.
Step 2: Create flow logs
Log on to the CEN console .
In the Instances section, find the target CEN instance, and click its ID.
Under the tab, find the transit router for the China (Hangzhou) region, and click its ID.
On the product page of the transit router, select the Flow Logs tab.
Make sure Simple Log Service is activated for your account.
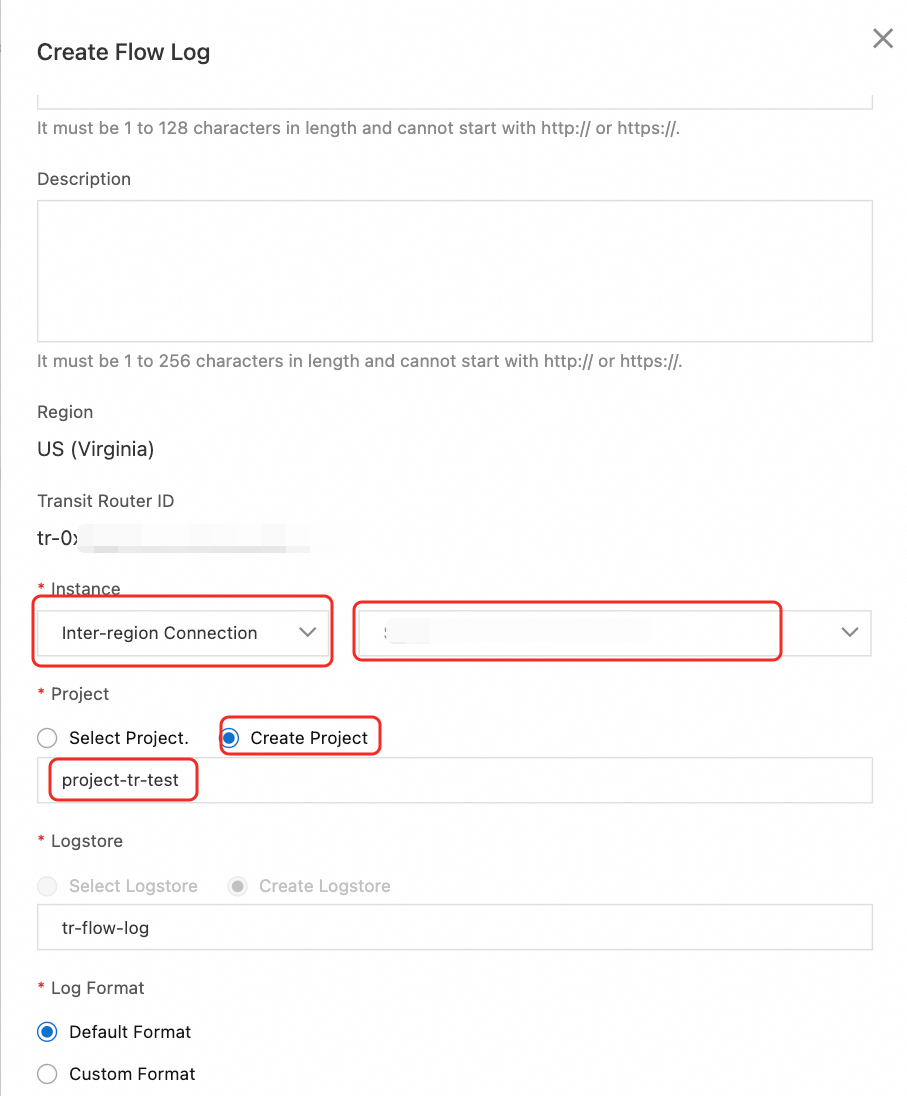
On the Flow Logs tab, click Create Flow Log. Configure the settings as follows, and then click OK.
Instance: Choose Inter-region Connection from the left drop-down menu and select the corresponding inter-region connection instance ID (tr-attach-xxx) from the right drop-down menu.
Project: Choose Create New Project and enter
project-tr-test1.Keep all other parameters at their default values.
 Note
NoteWhen you enable flow logs for inter-region connections, only the outbound traffic of the transit router is recorded. In this example, traffic from VPC1 to VPC2 is captured. For more information on the supported traffic directions for other instance types, such as VPC connections, see Resources that support flow logs.
If Log Service is already active on your Alibaba Cloud account, you can skip this step.
On the Flow Logs tab, click Enable Now. On the Simple Log Service page, agree to the Terms of Service for Flow Log and click Enable Now. After activation, return to the Flow Logs tab.
Step 3: View flow logs
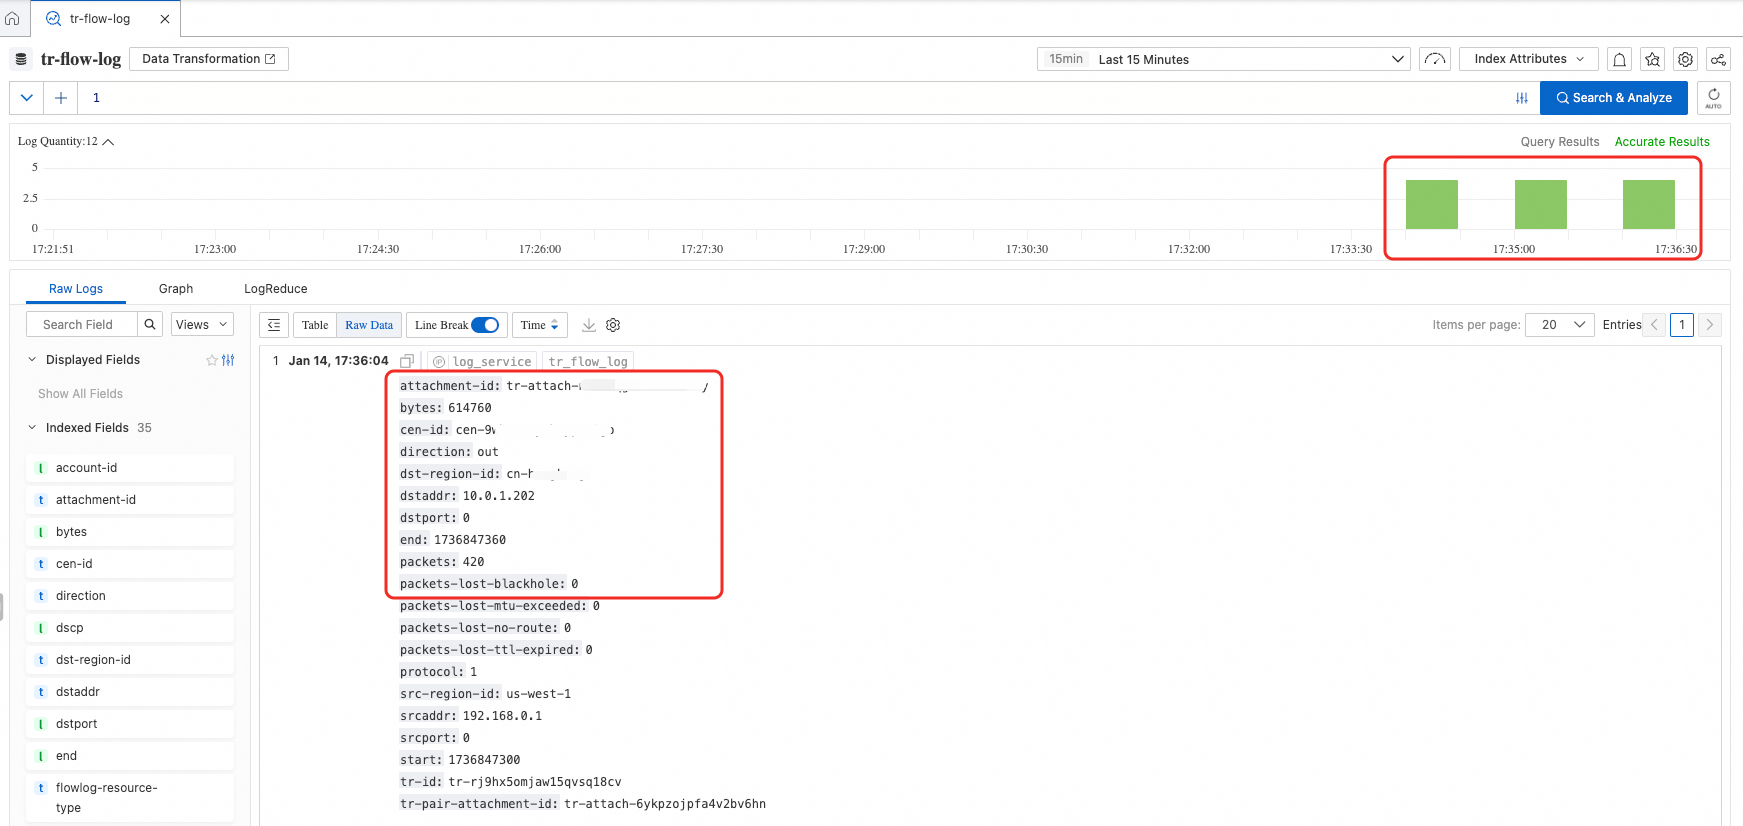
A flow log is enabled by default after creation. Simple Log Service may take a few minutes to initialize after activation. Once initialized, it automatically begins recording traffic. You can click the project and Logstore name in the Simple Log Service column to go to the Log Service console, where you can query and analyze flow logs.

The Log Service console appears as shown in the figure. You can view flow log details in this interface.

Step 4: Filter top traffic
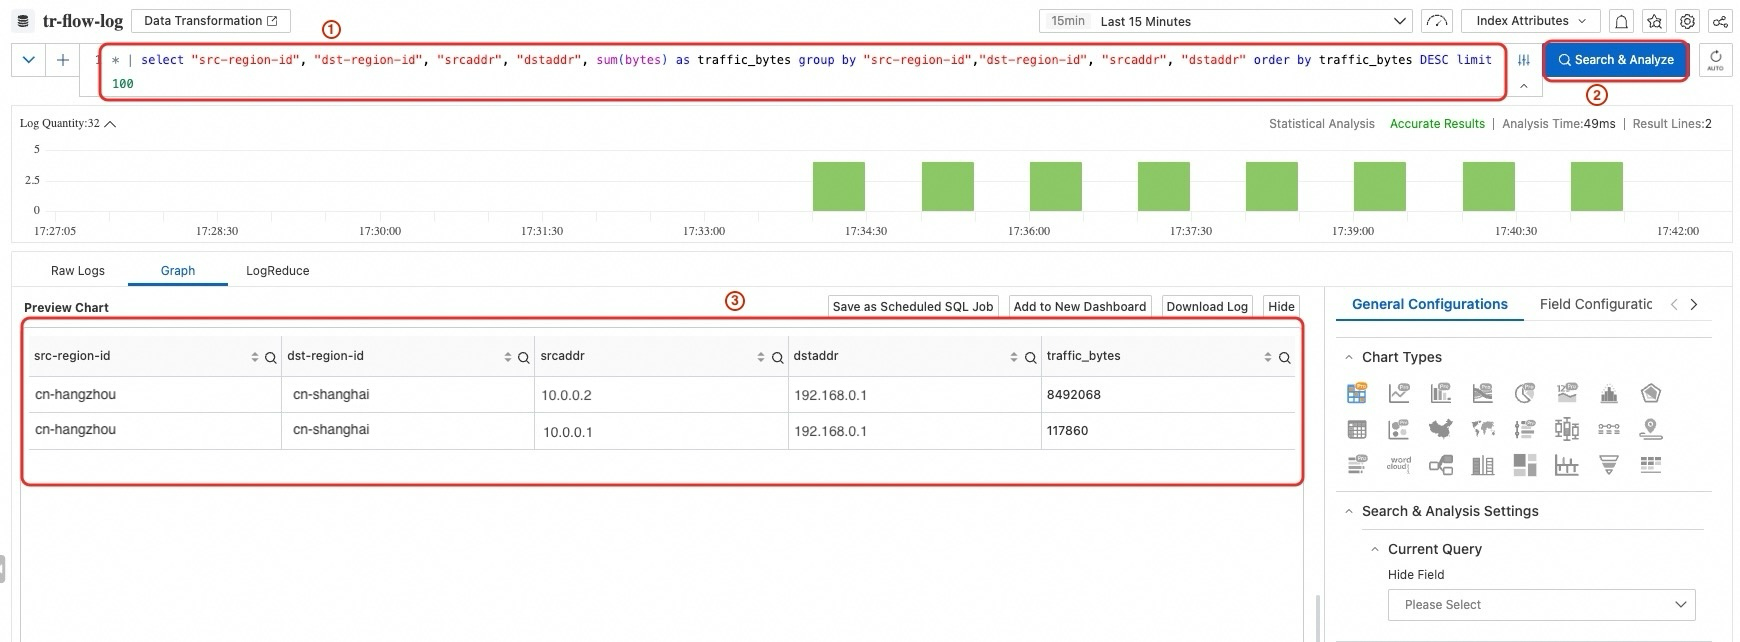
Enter the following query to view the top inter-region traffic:
* | select "src-region-id", "dst-region-id", "srcaddr", "dstaddr", sum(bytes) as traffic_bytes group by "src-region-id","dst-region-id", "srcaddr", "dstaddr" order by traffic_bytes DESC limit 100This query groups the flow logs by source region ID, destination region ID, source address, and destination address, calculates the total traffic in bytes for each session within each group, and sorts the results by total traffic in descending order.
The query results are as follows:

From the results, the top traffic from VPC1 to VPC2 in the last 15 minutes is as follows:
Traffic from ECS2 to ECS3 is the highest, totaling 8,492,068 bytes.
Traffic from ECS1 to ECS3 is the second highest, totaling 117,860 bytes.
References
For more information on the fields in the log entry, see Flow log fields.
For more information on the syntax of the flow log query statement, see Query syntax and features.