View the prediction of a predictive scaling rule
After creating a predictive scaling rule, validate its predictions before enabling automatic scaling. Running in Forecast Only mode lets you compare forecasted values against actual values to build confidence in the prediction model—without triggering any scaling actions.
How predictions work
When a predictive scaling rule runs, it analyzes historical CPU utilization patterns and generates a forecast. The rule then creates scheduled tasks based on that forecast. You can review the prediction charts on the rule's details page to evaluate accuracy and decide when to switch to automatic scaling.
Note: Start with Predictive Mode set to Forecast Only. After the rule runs and you confirm that the predictions match your expectations, switch to Forecast and Scale to enable automatic adjustment of instance counts.
Prerequisites
Before you begin, ensure that you have:
-
A scaling group with a predictive scaling rule already created
-
Run the predictive scaling rule at least once so prediction data is available
View the prediction charts
-
Log on to the Auto Scaling console.
-
In the left-side navigation pane, click Scaling Rules.
-
In the top navigation bar, select a region.
-
Open the scaling group details page using one of the following methods:
-
Click the ID of the scaling group in the Scaling Group Name/ID column.
-
Click Details in the Actions column.
-
-
In the upper part of the scaling group details page, click the Scaling Rules and Tasks tab.
-
On the Scaling Rules tab, find the predictive scaling rule and click its ID in the Scaling Rule ID/Name column.
The scaling rule details page displays the following charts. In each chart, a vertical line separates historical values (to the left) from upcoming predictions (to the right). Use the historical section to evaluate forecast accuracy, and the prediction section to decide whether to act.
Figure 1. CPU utilization comparison
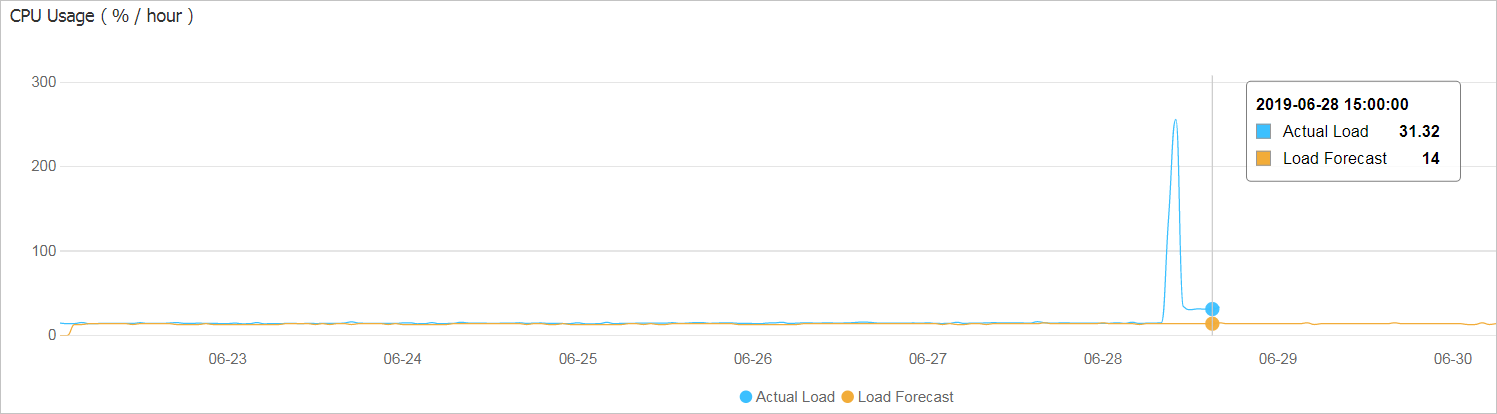
Compares forecasted CPU utilization against actual observed values. If the forecasted line closely tracks the actual line on the historical side, the model is performing well.
Figure 2. Instance count comparison
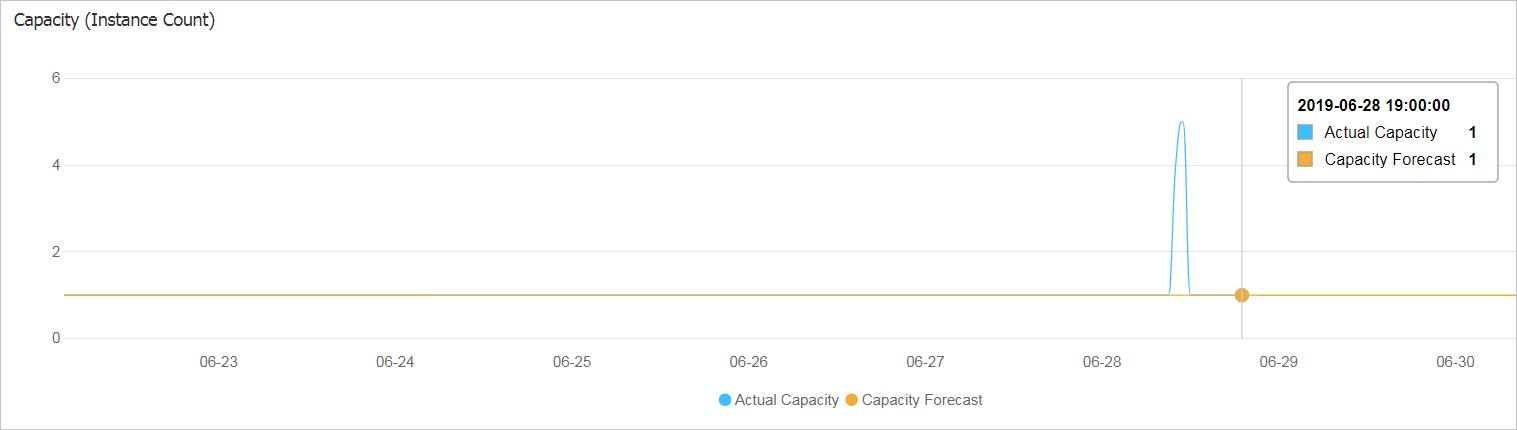
Shows the predicted number of instances alongside the actual instance count in the scaling group. Use this chart to verify that the predicted capacity aligns with your expected workload.
Figure 3. Generated scheduled tasks
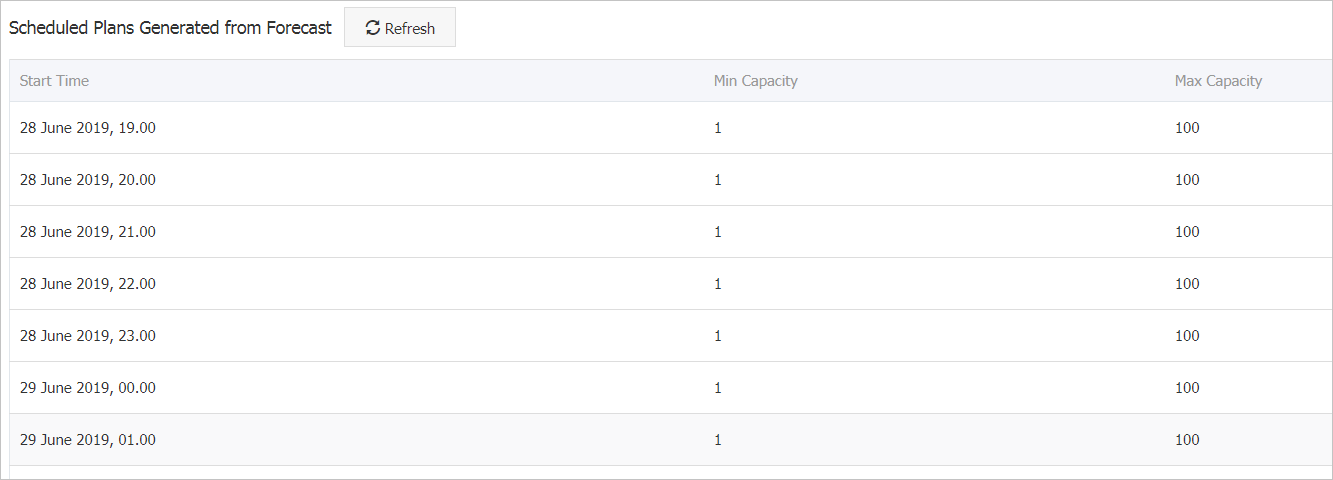
Lists the scheduled tasks that the predictive scaling rule has generated. Each task represents a planned capacity adjustment at a specific time.
Enable automatic scaling
After confirming the predictions meet your expectations, switch Predictive Mode to Forecast and Scale. For instructions, see Modify or delete a scaling rule.
With Forecast and Scale enabled, the rule automatically adjusts the minimum and maximum instance counts in your scaling group based on its predictions.
View generated scheduled tasks
View tasks on the Scheduled Tasks page
-
In the left-side navigation pane, choose Scaling Tasks > Scheduled Tasks.
-
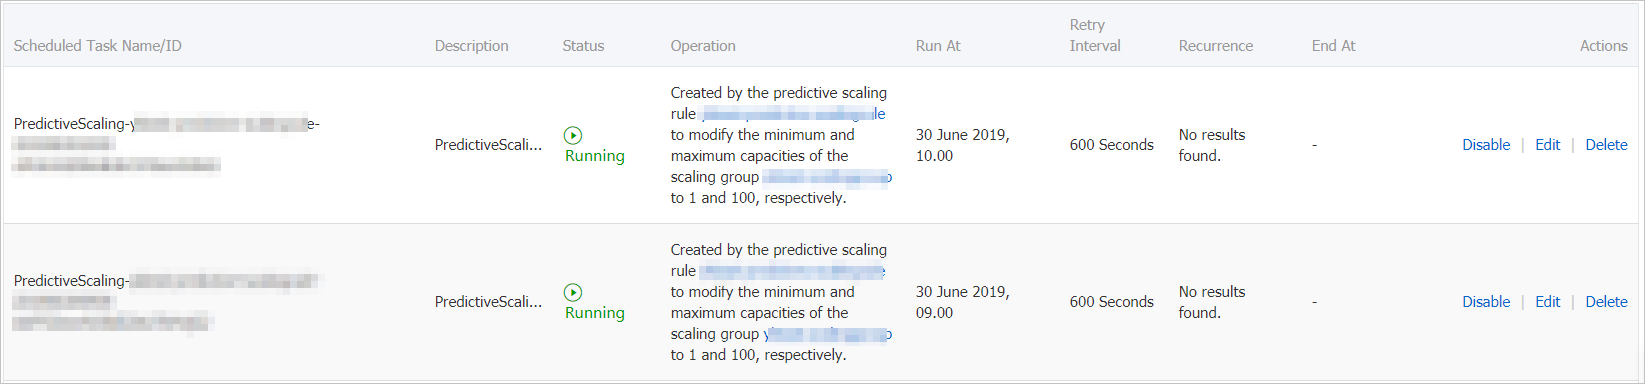
On the Scheduled Tasks page, find the tasks generated by your predictive scaling rule.
Scheduled tasks generated by a predictive scaling rule follow this naming format:
PredictiveScaling-_Scaling rule name_-_Execution time_
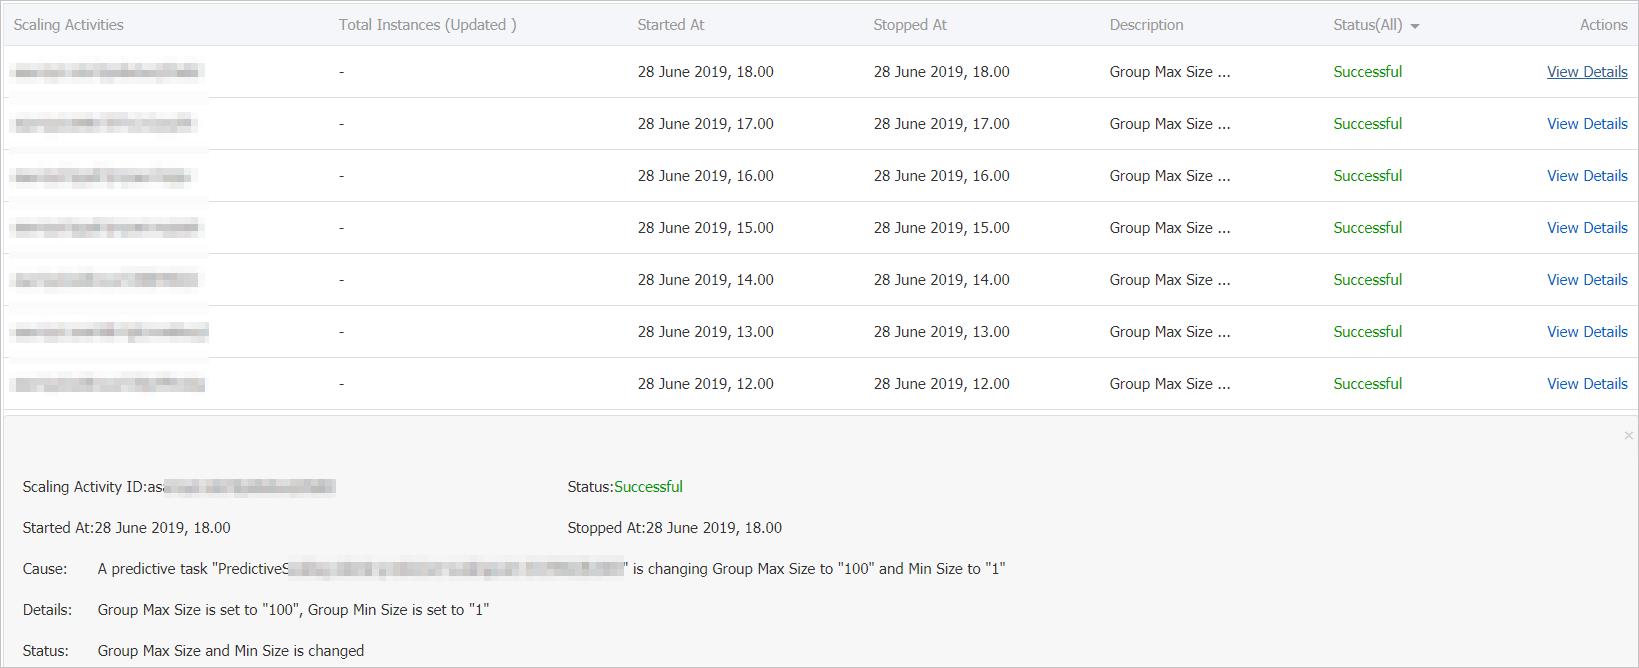
View task execution details
After a scheduled task runs, Auto Scaling automatically adjusts the maximum and minimum instance counts and then deletes the task if it was successfully executed. To review what happened, go to the Scaling Activities tab on the scaling group details page. The tab shows the task status, cause, details, and status description for each scaling activity.
For more information about scaling rule types, see Scaling rule types.