Service Mesh (ASM) can trace applications that are deployed inside an ASM instance. To trace applications that are deployed inside and outside an ASM instance at the same time, you must use Managed Service for OpenTelemetry to generate call traces. This topic describes how to use Managed Service for OpenTelemetry to enable an external application to call an application inside an ASM instance. This way, Managed Service for OpenTelemetry generates a call trace between the two applications.
Prerequisites
A Service Mesh (ASM) instance is created. The ACK cluster is added to the ASM instance. For more information, see Create an ASM instance and Add a cluster to an ASM instance.
An ingress gateway is deployed for the ASM instance to allow external access to applications that are deployed inside the ASM instance. For more information, see Create an ingress gateway.
Python 2.7 is installed in the runtime environment where you want to deploy an application outside the ASM instance.
Managed Service for OpenTelemetry is activated. For more information, see Collect ASM tracing data to Managed Service for OpenTelemetry.
Usage notes
In this example, the ExternalProxy application that is compiled by using Python is deployed outside the ASM instance. ExternalProxy uses an HTTP server. When the root path of ExternalProxy is accessed, the HTTP server calls the Productpage microservice of the Bookinfo application that is deployed inside the ASM instance.
In this example, Managed Service for OpenTelemetry is used to trace applications. If you use a custom tracing system that is compatible with Zipkin, skip Step 2: Obtain the endpoint that is used to access Managed Service for OpenTelemetry and go to Step 3: Deploy the ExternalProxy application. Set the endpoint for external access to the custom tracing system to the endpoint to which tracing data is reported.
Step 1: Deploy the Bookinfo application inside an ASM instance
Run the following command to deploy the Bookinfo application in the ACK cluster that is added to the ASM instance.
You can download the YAML file of the Bookinfo application from GitHub.
kubectl --kubeconfig=${DATA_PLANE_KUBECONFIG} apply -f bookinfo.yamlRun the following command to deploy virtual services for the Bookinfo application.
You can download the YAML file of virtual services from GitHub.
kubectl --kubeconfig=${ASM_KUBECONFIG} apply -f virtual-service-all-v1.yamlRun the following command to deploy destination rules for the Bookinfo application.
You can download the YAML file of destination rules from GitHub.
kubectl --kubeconfig=${ASM_KUBECONFIG} apply -f destination-rule-all.yamlRun the following command to deploy a gateway for the Bookinfo application.
You can download the YAML file of the gateway from GitHub.
kubectl --kubeconfig=${ASM_KUBECONFIG} apply -f bookinfo-gateway.yaml
Step 2: Obtain the endpoint that is used to access Managed Service for OpenTelemetry
Log on to the Managed Service for OpenTelemetry console. In the left-side navigation pane, click Overview.
On the Overview page, click the Access process tab, and then click View access point information.
View the access endpoint.
In the upper part of the page, select the desired region.
Select the region of the ACK cluster where the Bookinfo application is deployed. If you select another region, the tracing data of the Bookinfo application cannot be reported to Managed Service for OpenTelemetry.
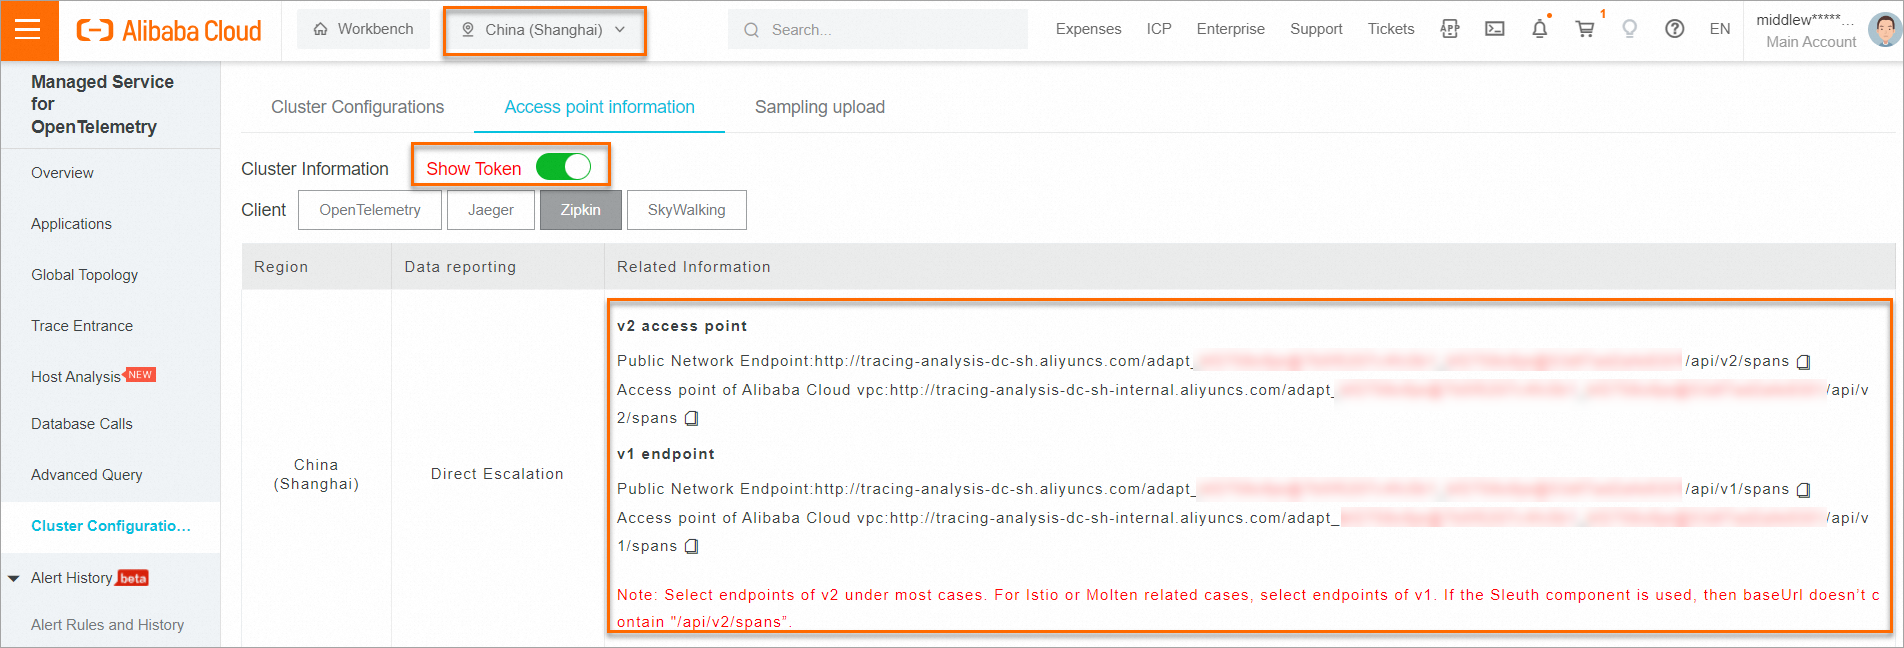
On the Access point information tab, turn on Show Token for the Cluster Information parameter. Select the public or private endpoint based on the place where you want to deploy the ExternalProxy application.
In this example, the tracing data of ExternalProxy is reported by using the API of Zipkin V1. Therefore, you must use the public or private endpoint of Zipkin V1.

Step 3: Deploy the ExternalProxy application
The sidecar proxy forwards all content (including the HTTP request headers and request body) received in a request to the upstream service. Therefore, tracing-related headers are also forwarded to the upstream service.
To pass tracing information through, the application must pass tracing-related request headers through to the upstream service according to the specifications of the Istio community.
Create an ExternalProxy.py file that contains the following content and save the file in the runtime environment of the ExternalProxy application.
Replace
{XTRACE_ZIPKIN_V1_ENDPOINT}with the endpoint that you obtained in Step 2. If you need to report the tracing data to a custom tracing system, replace the variable with the access endpoint of the custom tracing system.Replace
{INGRESS_GATE_WAY_IP}with the endpoint of the ingress gateway that is deployed for the ACK cluster.
Run the following command to start ExternalProxy:
python ExternalProxy.py* Serving Flask app "main" (lazy loading) * Environment: production WARNING: This is a development server. Do not use it in a production deployment. Use a production WSGI server instead. * Debug mode: on * Running on http://0.0.0.0:5000/ (Press CTRL+C to quit) * Restarting with stat * Debugger is active! * Debugger PIN: 317-792-686Run the following command to call ExternalProxy:
curl localhost:5000Expected output:
OK
Step 4: View tracing data
Log on to the Managed Service for OpenTelemetry console.
In the left-side navigation pane, click Applications. In the upper part of the Applications page, select the region where the ACK cluster resides. Then, click ExternalProxy in the application list.
On the page that appears, click Application Details in the left-side navigation pane. On the Application Details page, click the Traces tab. Then, click the trace ID of the call trace that you want to query.
A call trace is generated between the ExternalProxy application that is deployed outside the ASM instance and the Bookinfo application that is deployed inside the ASM instance.