Service Mesh (ASM) allows you to report metrics to Managed Service for OpenTelemetry and self-managed system. You can specify these metrics in the Managed Service for OpenTelemetry console. This topic describes how to collect ASM tracing data to Managed Service for OpenTelemetry and self-managed system.
Prerequisites
A Container Service for Kubernetes (ACK) cluster is added to an ASM instance. For more information, see Add a cluster to an ASM instance.
and Managed Service for OpenTelemetry is activated for your Alibaba Cloud account. For more information about billing of this service, see Billing rules.
An ingress gateway is created in the ASM instance. Formore information, see Create an ingress gateway.
Collect ASM tracing data to Managed Service for OpenTelemetry
Perform the following steps based on the version of your ASM instance. If you need to upgrade an instance version, see Update an ASM instance.
For ASM instances whose versions are earlier than 1.17.2.35
Log on to the ASM console. In the left-side navigation pane, choose .
On the Mesh Management page, click the name of the ASM instance. In the left-side navigation pane, choose .
On the Base Information page, click Settings. In the Settings Update panel, select Enable Tracing Analysis, set Sampling Percentage, select Enable Managed Service for OpenTelemetry for Sampling Method, and then click OK.
In the left-side navigation pane, choose . You are redirected to the Managed Service for OpenTelemetry console. In the console, you can find the ASM tracing data.
For more information about Managed Service for OpenTelemetry, see What is Managed Service for OpenTelemetry?
If you no longer need to use this feature, clear Enable Tracing Analysis in the Settings Update panel and click OK.
For ASM instances whose versions are 1.17.2.35 or later and earlier than 1.18.0.124
Log on to the ASM console. In the left-side navigation pane, choose .
On the Mesh Management page, click the name of the ASM instance. In the left-side navigation pane, choose .
On the Tracing Analysis page, click Collect ASM Tracing Data to Managed Service for OpenTelemetry. In the Submit message, click OK.
Click Open the Managed Service for OpenTelemetry Console to view the ASM tracing data.
For more information about Managed Service for OpenTelemetry, see What is Managed Service for OpenTelemetry?
If you no longer need to use this feature, click Disable Collection on the Tracing Analysis page. In the Submit message, click OK.
For ASM instances whose versions are 1.18.0.124 or later and earlier than 1.22.6.89
In this version range, you cannot export ASM tracing data to Managed Service for OpenTelemetry in the console. You can configure the Collector in the system by using the following steps.
Step 1: Deploy the OpenTelemetry Operator
Use kubectl to connect to the ACK cluster based on the information in the kubeconfig file. Then, run the following command to create the opentelemetry-operator-system namespace:
kubectl create namespace opentelemetry-operator-systemRun the following commands to use Helm to install the OpenTelemetry Operator in the opentelemetry-operator-system namespace:
helm repo add open-telemetry https://open-telemetry.github.io/opentelemetry-helm-charts
helm install --namespace=opentelemetry-operator-system opentelemetry-operator open-telemetry/opentelemetry-operator \
  --set "manager.collectorImage.repository=otel/opentelemetry-collector-k8s" \
  --set admissionWebhooks.certManager.enabled=false \
  --set admissionWebhooks.autoGenerateCert.enabled=true
Run the following command to check whether the OpenTelemetry Operator works properly:
kubectl get pod -n opentelemetry-operator-systemExpected output:
NAME                                      READY   STATUS    RESTARTS   AGE
opentelemetry-operator-854fb558b5-pvllj   2/2     Running   0          1m
The output indicates that the
STATUSisRunning. This means that the OpenTelemetry Operator works properly.
Step 2: Create OpenTelemetry Collector
Create a collector.yaml file with the following content.
Replace
${ENDPOINT}in the YAML with the VPC network access point of the gRPC protocol, and${TOKEN}with the authentication token. For information on how to obtain the access point and authentication token for Alibaba Cloud Managed Service for OpenTelemetry, see Access and Authentication Instructions.In the kubeconfig environment corresponding to the ACK cluster, execute the following command to deploy the collector to the cluster.
kubectl apply -f collector.yamlExecute the following command to check whether the collector is started properly.
kubectl get pod -n opentelemetry-operator-systemExpected output:
NAME                                      READY   STATUS    RESTARTS   AGE
opentelemetry-operator-854fb558b5-pvllj   2/2     Running   0          3m
default-collector-5cbb4497f4-2hjqv        1/1     Running   0          30s
The expected output indicates that the collector is started properly.
Execute the following command to check whether the service is created.
kubectl get svc -n opentelemetry-operator-systemExpected output:
opentelemetry-operator           ClusterIP   172.16.138.165   <none>        8443/TCP,8080/TCP   3m
opentelemetry-operator-webhook   ClusterIP   172.16.127.0     <none>        443/TCP             3m
default-collector              ClusterIP   172.16.145.93    <none>        4317/TCP   30s
default-collector-headless     ClusterIP   None             <none>        4317/TCP   30s
default-collector-monitoring   ClusterIP   172.16.136.5     <none>        8888/TCP   30s
The expected output indicates that the service is created successfully.
Step 3: Enable link tracking through the ASM console
Log on to the ASM console. In the left-side navigation pane, choose .
On the Mesh Management page, click the name of the ASM instance. In the left-side navigation pane, choose .
On the Observability Configuration page, within the Link Tracking Settings section, adjust the Sampling Percentage to 100, and then click Submit.
In the left-side navigation pane, select . Enter Opentelemetry Service Address/domain Name as default-collector.opentelemetry-operator-system.svc.cluster.local, enter Opentelemetry Service Port as 4317, and then click Collect Service Mesh Link Tracking Data To Opentelemetry.
For ASM instances whose versions are 1.22.6.89 or later
Log on to the ASM console. In the left-side navigation pane, choose .
On the Mesh Management page, click the name of the ASM instance. In the left-side navigation pane, choose .
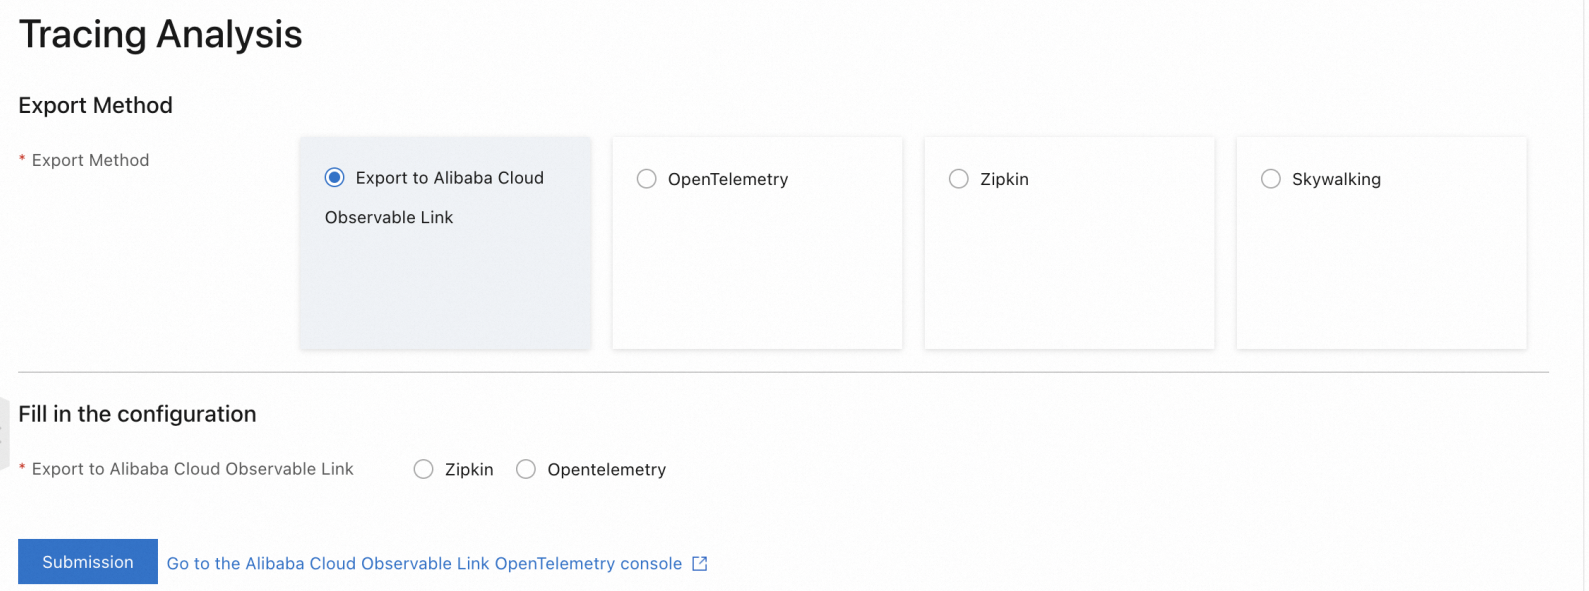
On the Tracing Analysis page, select Export Method to Export to Alibaba Cloud Observable link, select a method to submit data below Fill in the configuration, such as Zipkin, and then click Submission.
Click Go To Alibaba Cloud Observable link OpenTelemetry console to view the ASM tracing data. For more information, see What is Managed Service for OpenTelemetry?.
 Note
NoteIf you no longer need to use this feature, click Disable Collection on the Tracing Analysis page. In the Submit message, click OK.
Export ASM tracing data to a self-managed system
The import method varies with the versions of ASM instances. Perform the following steps based on the version of your ASM instance:
For ASM instances whose versions are earlier than 1.18.0.124
For ASM instances whose versions are earlier than 1.17.2.28: Log on to the ASM console. On the Basic Information pag, click Settings, select Enable Tracing Analysis to configure items as needed, and then click OK.
For more information about how to enable tracing analysis for ASM instances whose versions are 1.17.2.28 and later and earlier than 1.18.0.124, see the section Description of Tracing Analysis Settings in the topic "Configure observability settings".
For ASM instances whose versions are 1.18.0.124 or later and earlier than 1.22.6.89
In this version range, you can report ASM tracing data to Managed Service for OpenTelemetry in the console. Log on to the ASM console. On the page, configure the following parameters.
Configuration description
Item | Description |
OpenTelemetry Domain Name (FQDN) | The domain name of a self-managed system, which needs to be a fully qualified domain name (FQDN). Example: |
OpenTelemetry Service Port | The service port of the self-managed system. Example: |
For ASM instances whose versions are 1.22.6.89 or later
Log on to the ASM console. On the page, select and configure a self-managed system.
To import the ASM tracing data to a self-managed system, ensure that the system has been deployed in the ASM instance. Otherwise, you need to define the self-managed system in the service registry of the ASM instance by creating ServiceEntry. For more information, see ServiceEntry.
Configuration description
Report data to Managed Service for OpenTelemetry
Item | Description | |
Service domain name (full FQDN) | The domain name of the self-managed system, which needs to be a FQDN. For example, | |
Service Port | The service port of the self-managed system. For example, | |
Reporting via gRPC | Timeout | Optional. The request timeout period of reporting data to Managed Service for OpenTelemetry. Unit: seconds. For example, |
Request Header | Optional. The headers that are carried when reporting data to Managed Service for OpenTelemetry. For example, | |
Reporting via http | Request Path | The request path of reporting data to Managed Service for OpenTelemetry. For example, |
Timeout | Optional. The request timeout period of reporting data to Managed Service for OpenTelemetry. Unit: seconds. For example, | |
Request Header | Optional. The headers that are carried when reporting data to Managed Service for OpenTelemetry. For example, | |
Report data to Zipkin
Item | Description |
Service domain name (full FQDN) | The domain name of the self-managed system, which needs to be a FQDN. For example, |
Service Port | The service port of the self-managed system. For example, |
Request Path | The request path of reporting data to Zipkin. For example, |
Report data to Skywalking
Item | Description |
Service domain name (full FQDN) | The domain name of the self-managed system, which needs to be a FQDN. For example, |
Service Port | The service port of the self-managed system. For example, |
Verify reported ASM tracing data
Deploy an application
Deploy a sample application.
Create a file named bookinfo.yaml and copy the following content to the file.
Deploy the Bookinfo application to the Kubernetes cluster on the data plane:
kubectl --kubeconfig=${DATA_PLANE_KUBECONFIG} apply -f bookinfo.yaml
Deploy a sleep application.
Create a file named sleep.yaml file and copy the following content to the file.
Deploy the sleep application.
kubectl --kubeconfig=${DATA_PLANE_KUBECONFIG} apply -f sleep.yaml
Initiate a test
Run the following command to initiate a test.
kubectl exec -it deploy/sleep -- sh -c 'for i in $(seq 1 100); do curl -s productpage:9080/productpage > /dev/null; done'View reported ASM tracing data
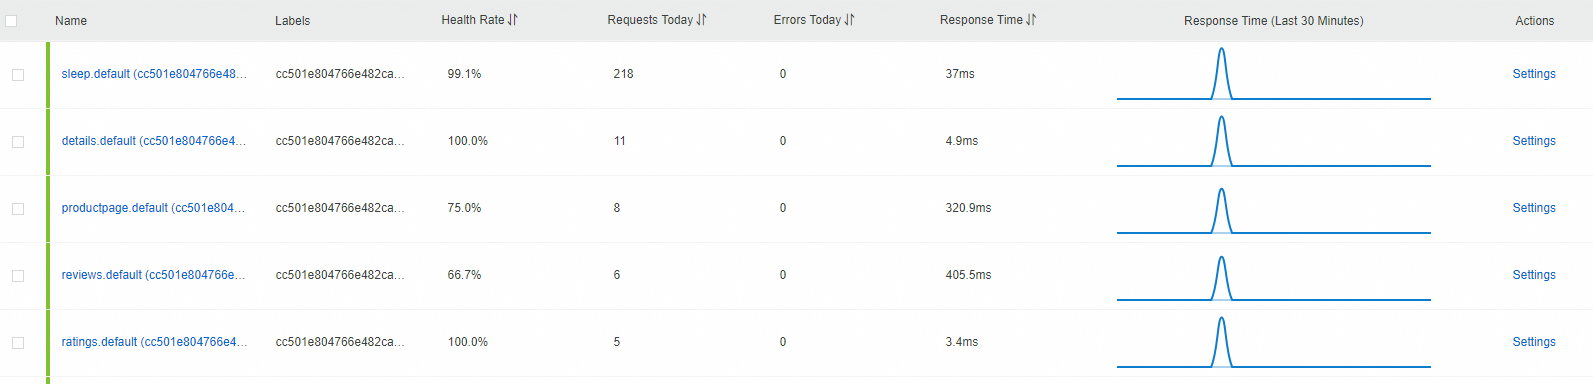
The following example shows the result of reporting ASM tracing data to Managed Service for OpenTelemetry.
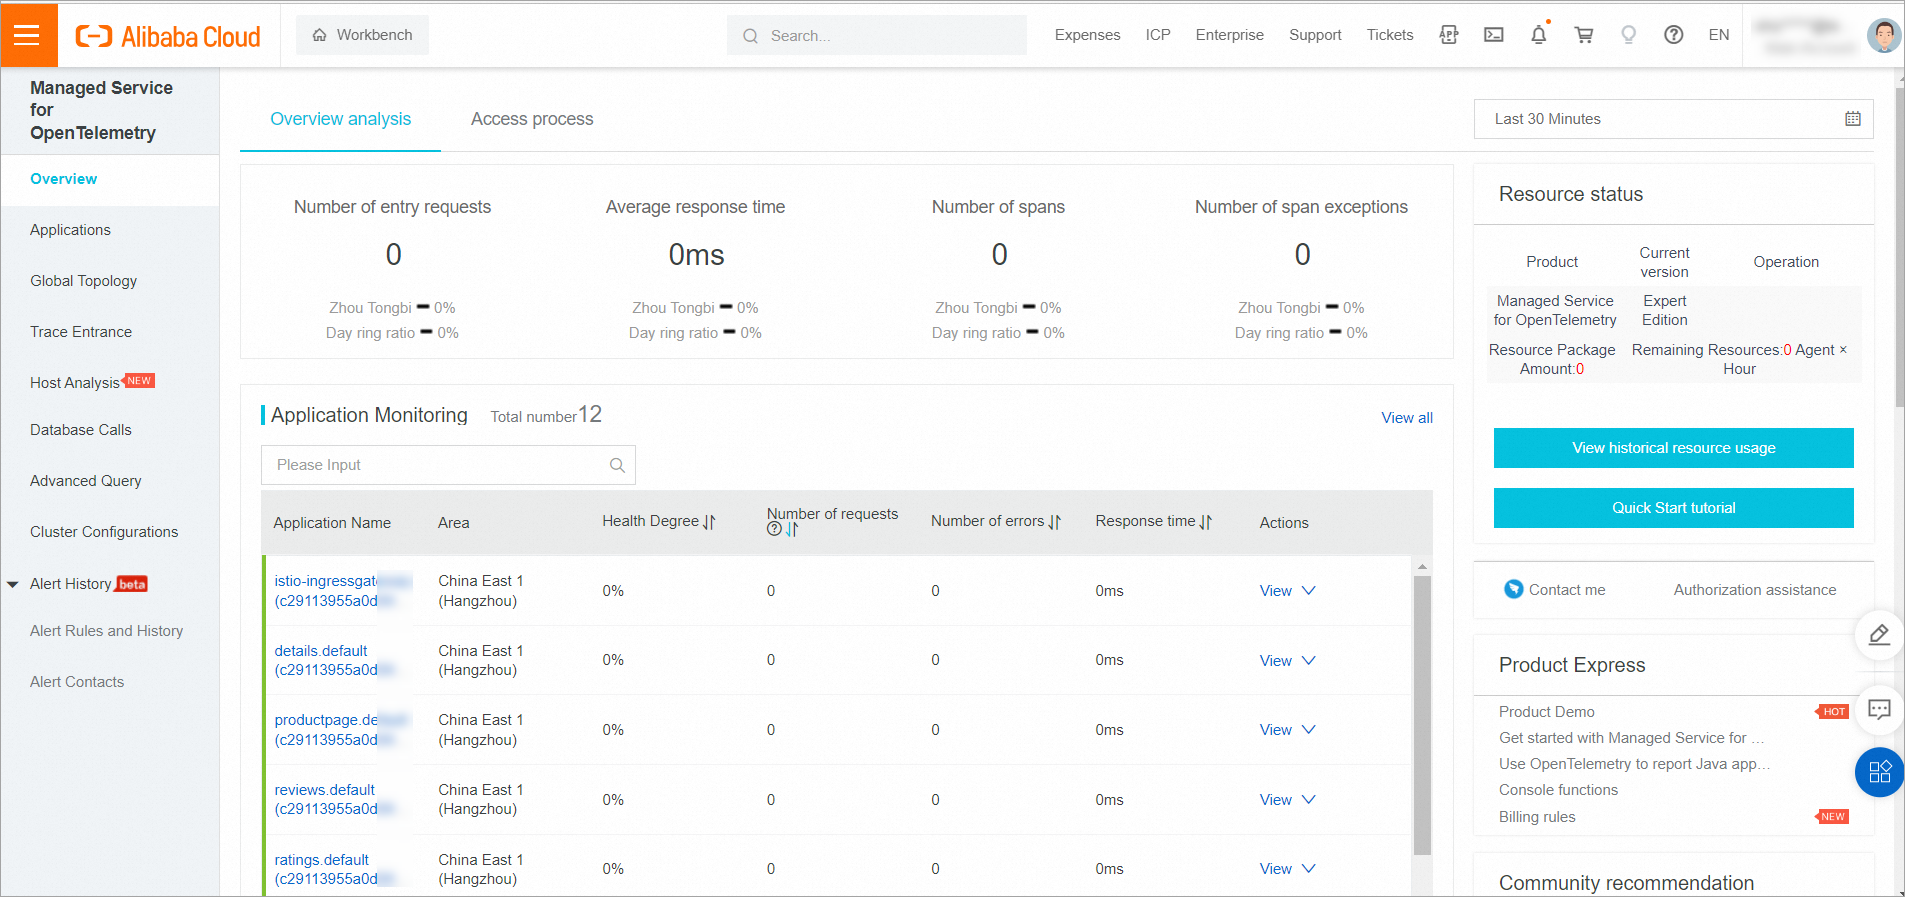
Log on to the Managed Service for OpenTelemetry console.
Click Application List in the left-side navigation pane to view the data shown in the following figure.