After you configure service level objectives (SLOs) for an application in Service Mesh (ASM), ASM generates a Prometheus rule that contains the required recording and alerting definitions. To activate these SLOs, import the generated rule into your Prometheus system as a PrometheusRule custom resource.
How it works
ASM generates a Prometheus rule when you configure SLOs. This rule contains:
Recording rules that compute SLO metrics such as error budgets and burn rates.
Alerting rules that fire when SLO thresholds are breached.
The Prometheus Operator uses the PrometheusRule custom resource definition (CRD) to manage these rules. The Operator determines which PrometheusRule objects to load based on the ruleSelector field in the Prometheus custom resource (CR). Only PrometheusRule objects whose labels match ruleSelector.matchLabels are loaded.
If ruleSelector is empty in the Prometheus CR, the Operator loads all PrometheusRule objects in the namespace. If ruleSelector specifies matchLabels, the PrometheusRule must carry the same labels. Mismatched labels are the most common reason rules fail to load.
Prerequisites
Before you begin, make sure that you have:
Prometheus monitoring enabled for the Container Service for Kubernetes (ACK) cluster. For setup instructions, see Use open source Prometheus to monitor an ACK cluster or Monitor ASM instances by using a self-managed Prometheus instance
kubectlaccess to the ACK cluster
This topic assumes Prometheus is deployed through the Prometheus Operator. If you use a different deployment method, see the Prometheus documentation for rule import instructions.
Step 1: Get the ruleSelector labels from the Prometheus CR
Before you create the PrometheusRule, check which labels the Prometheus Operator expects.
Log on to the ACK console. In the left-side navigation pane, click Clusters.
On the Clusters page, click the name of the cluster that you want to manage, and then choose Workloads > Custom Resources in the left-side navigation pane.
On the CRDs tab, click PrometheusRule.
On the Resource Objects tab, select monitoring from the Namespace drop-down list. Find ack-prometheus-operator-prometheus and click Edit YAML in the Actions column.
Locate the
ruleSelectorfield and note the labels undermatchLabels. SampleruleSelectorconfiguration: In this example, anyPrometheusRulemust carry bothapp: ack-prometheus-operatorandrelease: ack-prometheus-operatorlabels for the Operator to load it.ruleSelector: matchLabels: app: ack-prometheus-operator release: ack-prometheus-operator
Step 2: Deploy the PrometheusRule
Create a file named
prometheusrule.yamlwith the following content:The
labelsvalues must match thematchLabelsfrom Step 1.Replace the
specsection with the generated Prometheus rule from your SLO configuration.
   apiVersion: monitoring.coreos.com/v1
   kind: PrometheusRule
   metadata:
     labels:
       app: ack-prometheus-operator
       release: ack-prometheus-operator
     name: asm-rules
     namespace: monitoring
   spec:
     # Paste the generated Prometheus rule here.
     # To get the rule, see: https://www.alibabacloud.com/help/en/asm/sidecar/configure-slos-for-applications-in-asm#section-nte-2om-ajq
Apply the file to the ACK cluster:
kubectl apply -f prometheusrule.yaml
Step 3: Verify the PrometheusRule deployment
After you apply the PrometheusRule, the Prometheus Operator controller automatically writes the rules into the Prometheus ConfigMap.
Log on to the ACK console. In the left-side navigation pane, click Clusters.
On the Clusters page, click the name of the cluster that you want to manage, and then choose Configurations > ConfigMaps in the left-side navigation pane.
On the ConfigMap page, select monitoring from the Namespace drop-down list. Find the Prometheus ConfigMap and click Edit YAML in the Actions column.
Check that the ConfigMap includes the rules from your
PrometheusRule. If the rules appear, the deployment succeeded.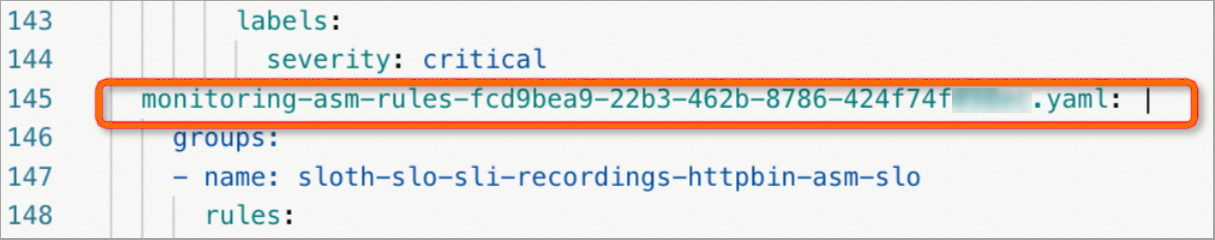
If the rules do not appear, verify that the labels in prometheusrule.yaml match the ruleSelector.matchLabels in the Prometheus CR.
Verify SLOs
View Prometheus metrics and alerts
Forward port 9090 to the Prometheus service:
kubectl --namespace monitoring port-forward svc/ack-prometheus-operator-prometheus 9090Open http://localhost:9090 in a browser.
Enter
asm_slo_infoin the query box and click Execute. The results confirm that the recording rules are active.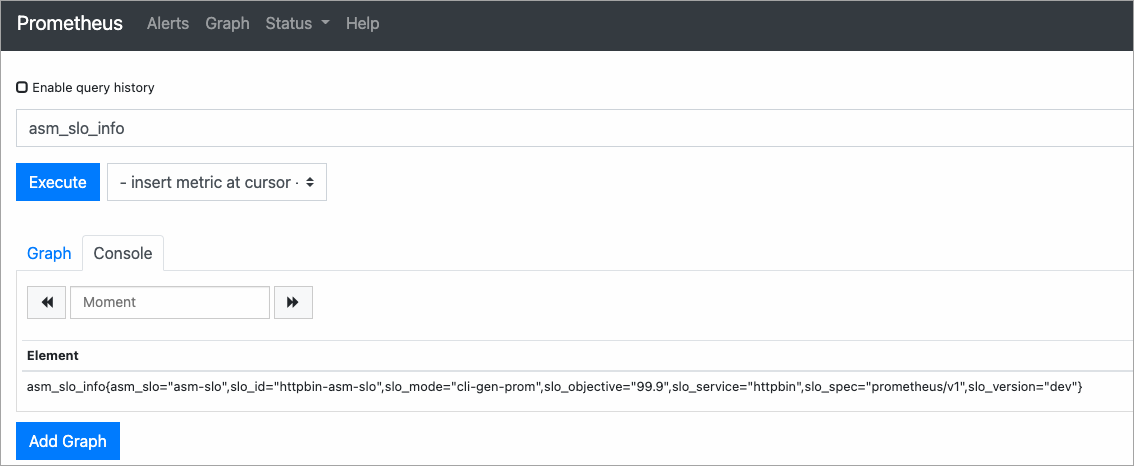
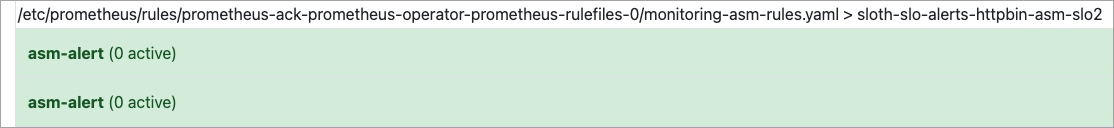
Click Alerts in the top navigation bar. If alerting rules appear, the Prometheus alerting configuration is active.
SLO metrics reference
Metric | Description |
| Remaining error budget during the 30-day compliance period |
| Average error rate during the 30-day compliance period |
| Burn rate for the 30-day compliance period |
| Current burn rate |
For details on these metrics, see SLO overview.
Scenario 1: Simulate normal traffic
Send traffic with a 99.5% success rate to confirm that the error budget remains healthy.
Run the following script. Replace
<ingress-gateway-ip>with the IP address of your ingress gateway. To find this IP, see Deploy an ingress gateway service. This script sends 200 requests. One request (at iteration 100) returns HTTP 500, while the other 199 return HTTP 200, producing a 99.5% success rate.#!/bin/bash for i in $(seq 200) do if (( i == 100 )); then curl -I http://<ingress-gateway-ip>/status/500 else curl -I http://<ingress-gateway-ip>/ fi echo "OK" sleep 0.01 doneIn the Prometheus console, query
slo:period_error_budget_remaining:ratioand click Execute. The remaining error budget should reflect the minimal error impact.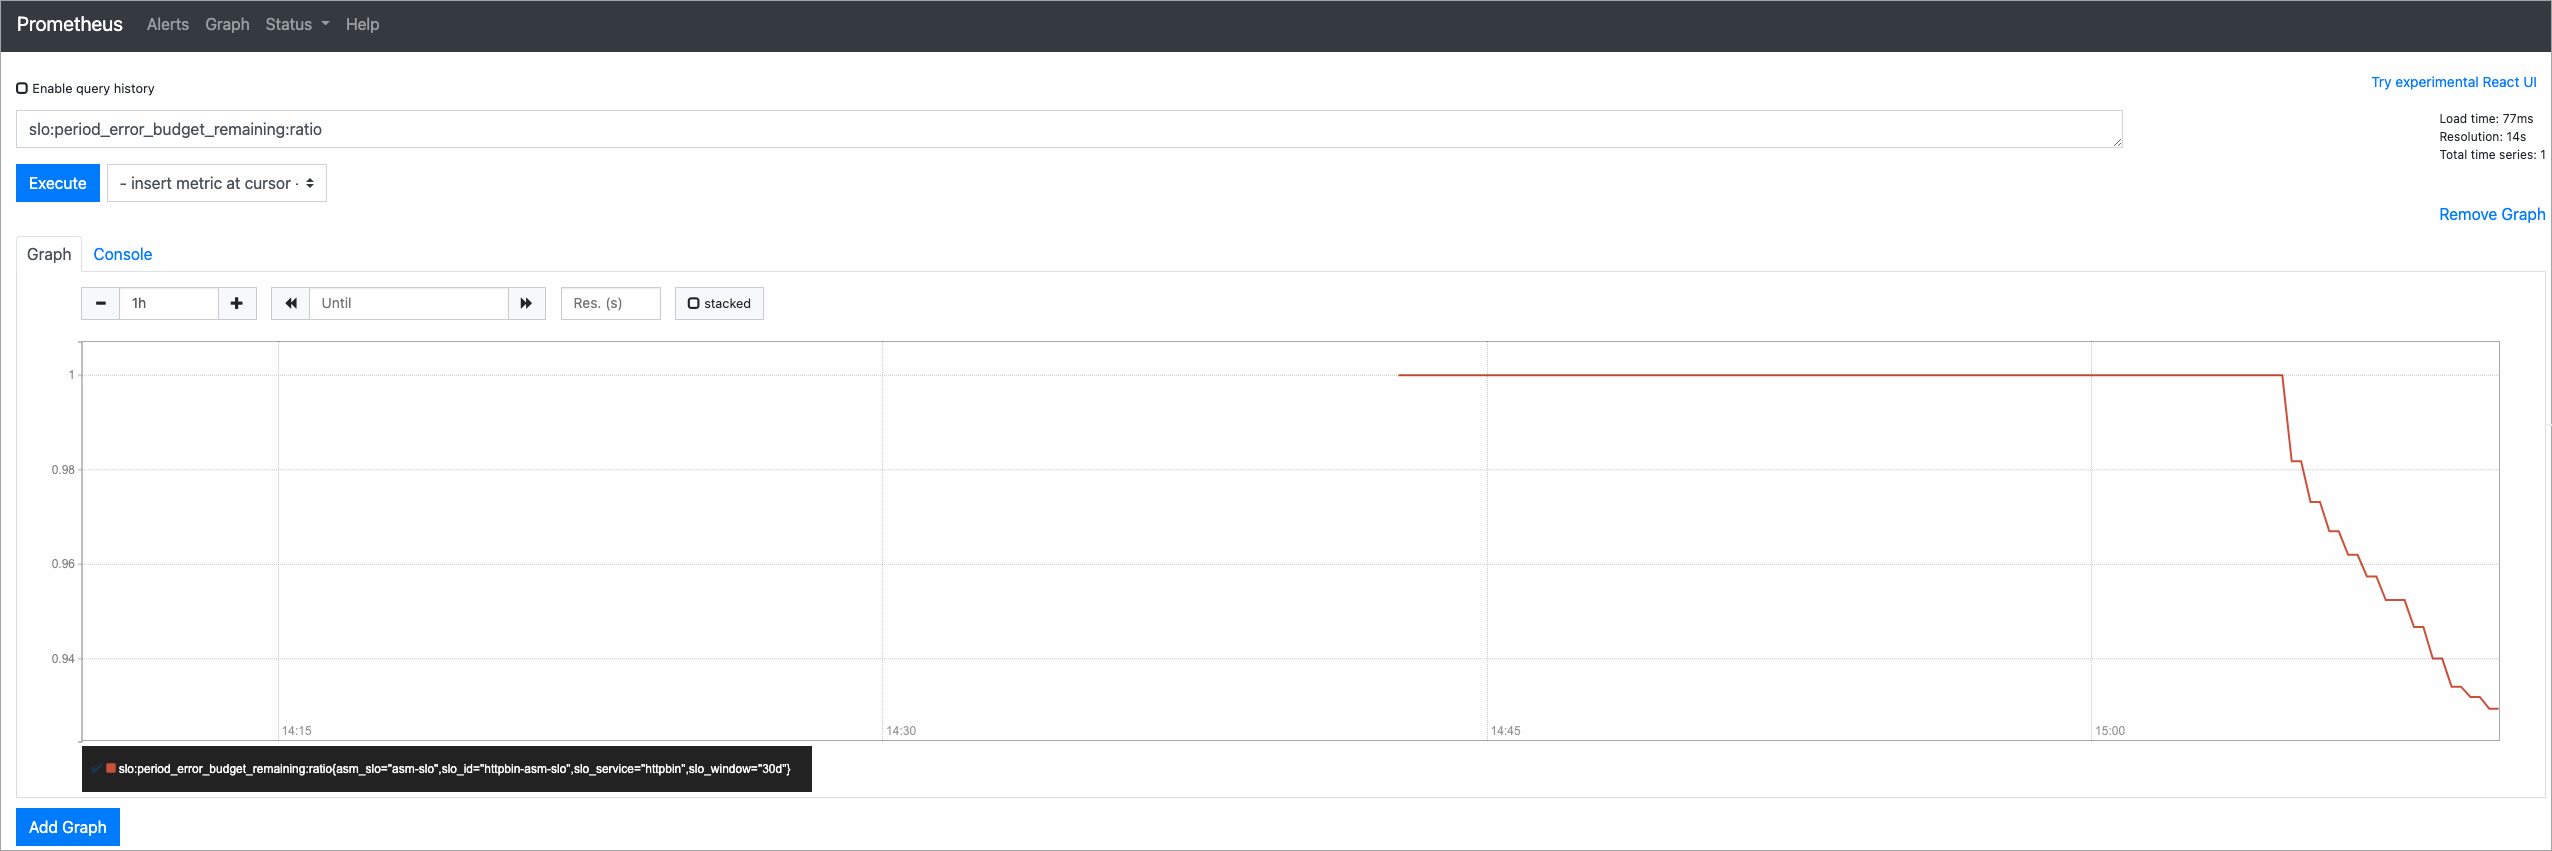
Scenario 2: Simulate error traffic
Trigger alerts by sending traffic with a 50% failure rate.
Run the following script. Replace
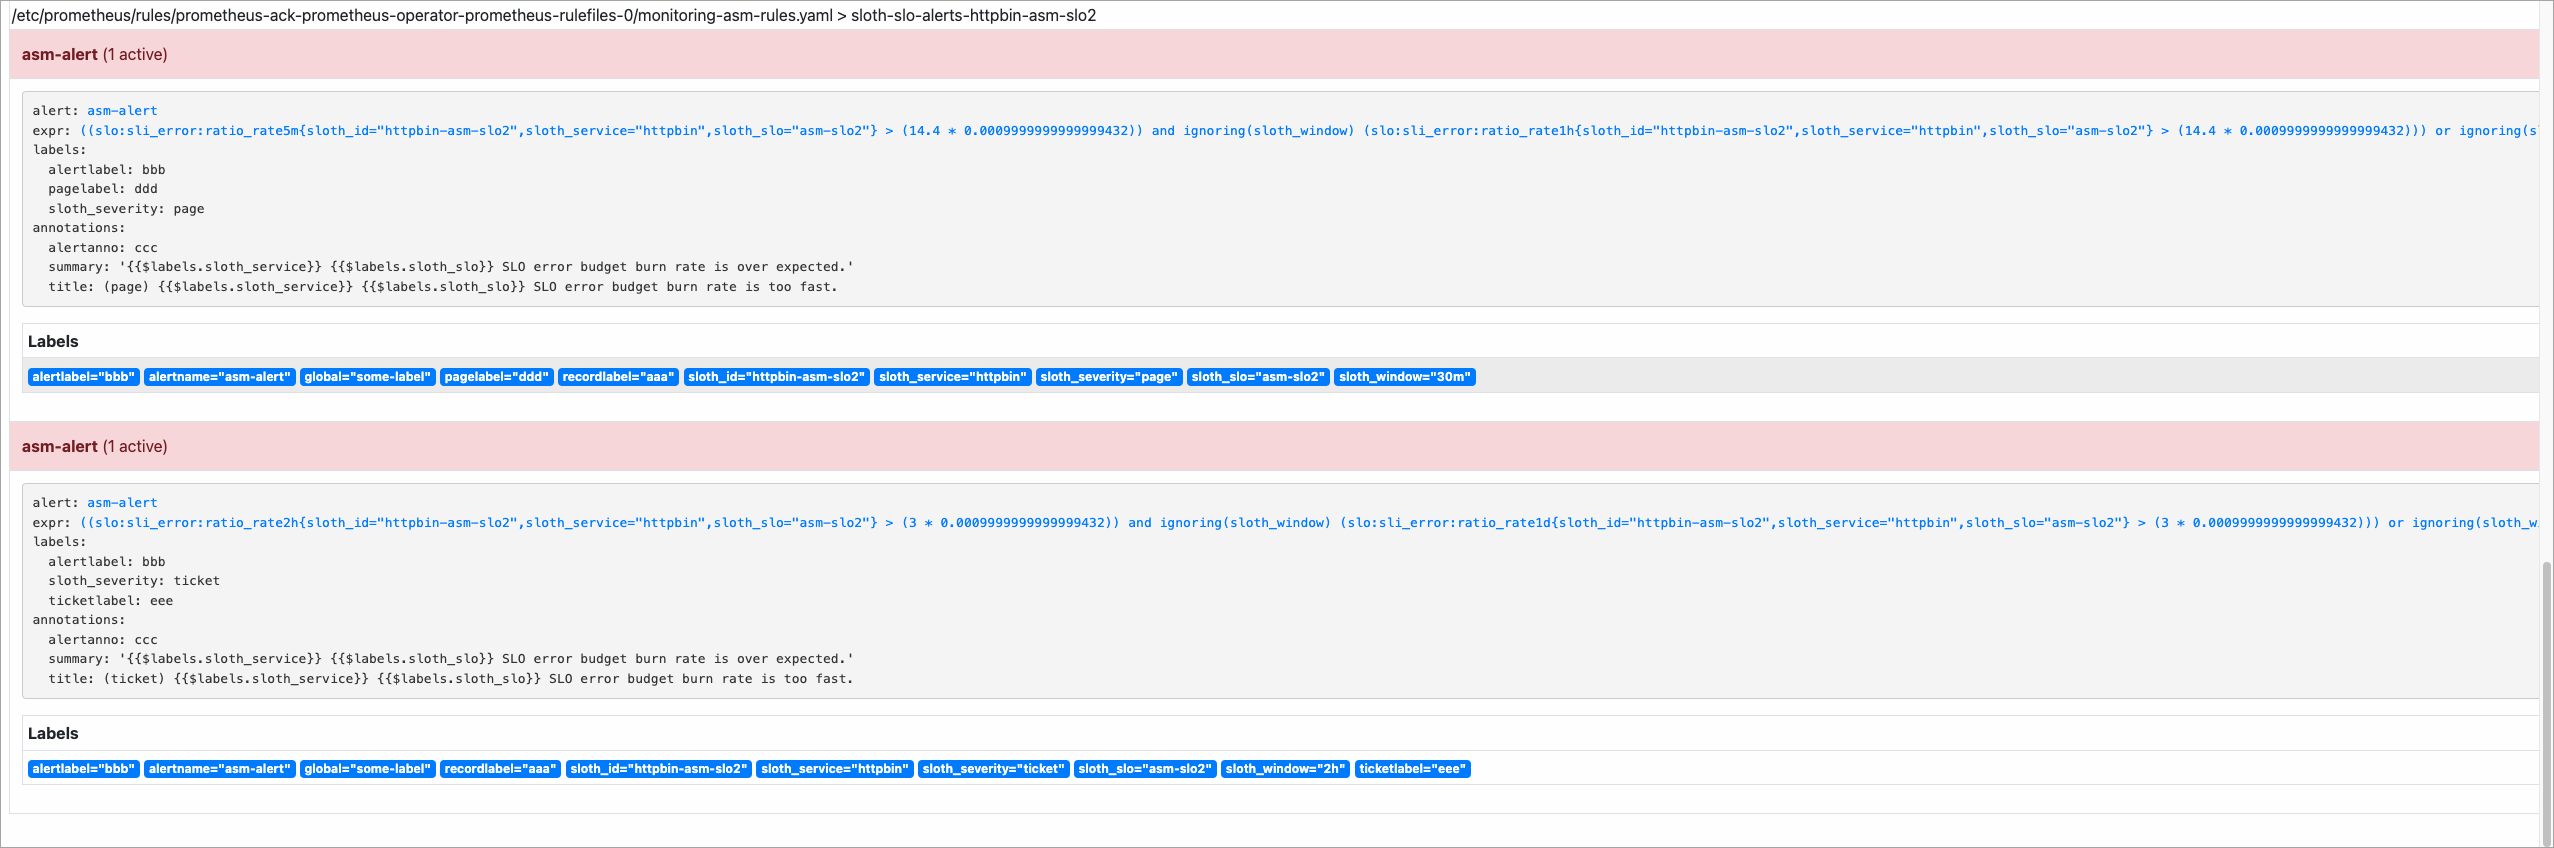
<ingress-gateway-ip>with the IP address of your ingress gateway. This script alternates between successful and failing requests, producing a 50% error rate and a 50% burn rate.#!/bin/bash for i in $(seq 200) do curl -I http://<ingress-gateway-ip>/ curl -I http://<ingress-gateway-ip>/status/500 echo "OK" sleep 0.01 doneOpen the Alerts page in the Prometheus console to confirm that alerts have fired.
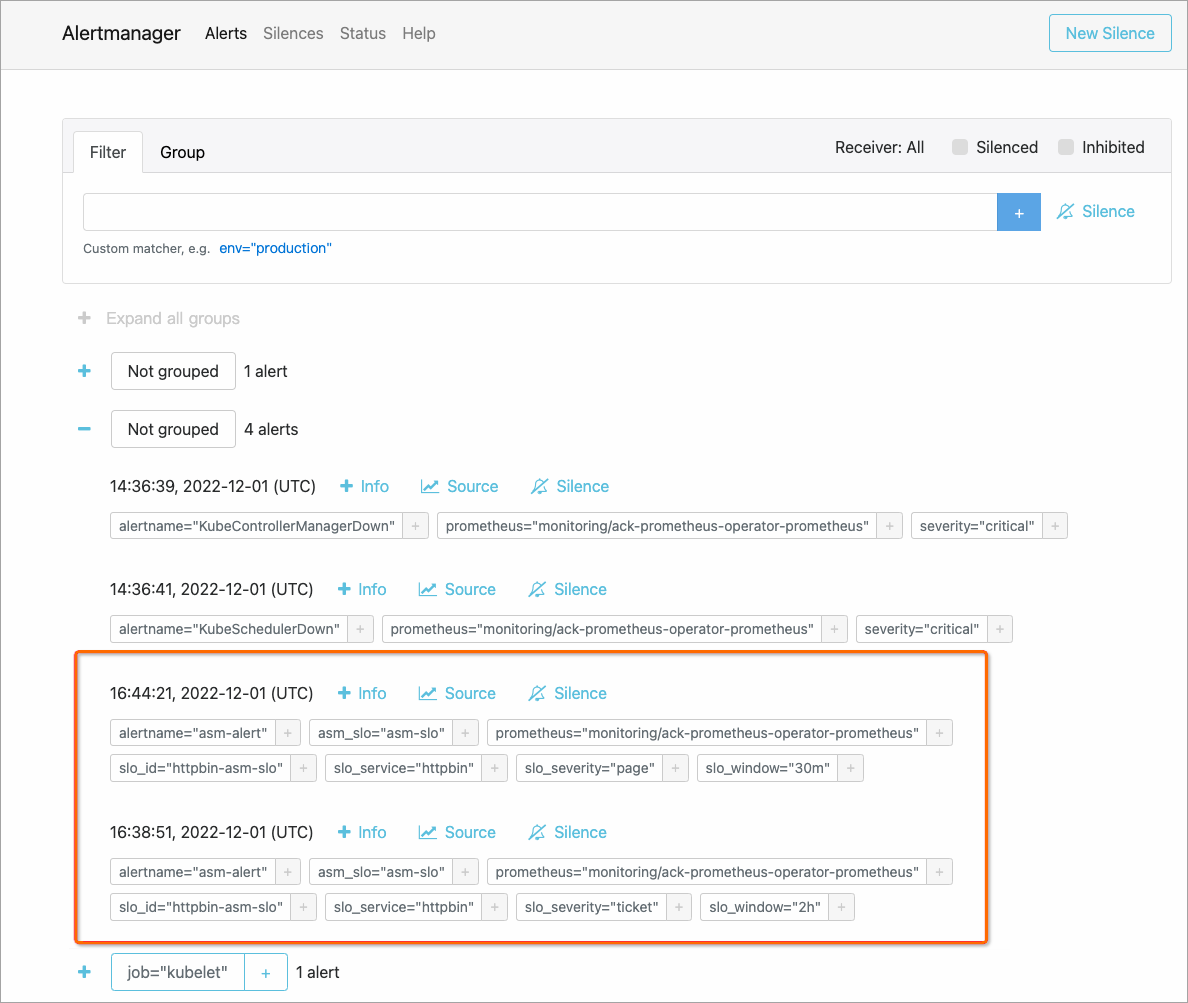
View alerts in Alertmanager
Alertmanager collects alerts from the Prometheus server and routes them to configured receivers.
Forward port 9093 to the Alertmanager service:
kubectl --namespace monitoring port-forward svc/ack-prometheus-operator-alertmanager 9093Open http://localhost:9093 in a browser.
On the Alertmanager page, click the
 icon to expand alert groups and view alert details.