All Products
Search
Document Center

Alibaba Cloud Service Mesh:Use QuotaSchedulingPolicy to implement request call quota management

Last Updated:Jun 22, 2026

The QuotaSchedulingPolicy CRD in the Service Mesh (ASM) traffic scheduling suite enables priority-based request scheduling under a specified call quota. When the in-flight request rate exceeds the quota, subsequent requests are queued and higher-priority requests are processed first.

Background information

QuotaSchedulingPolicy uses the token bucket algorithm to control the request rate for a specified service and queues requests when the rate exceeds the quota. It works as follows:

  1. A rate limiter based on the token bucket algorithm limits the request rate. For more information about the algorithm, see the Background information section in Use RateLimitingPolicy to implement user-specific throttling.

  2. When the request rate exceeds the quota, subsequent requests are queued and forwarded to the destination service after earlier requests complete. This keeps the request rate at the specified value. High-priority requests are dequeued and forwarded first.

Unlike throttling, QuotaSchedulingPolicy does not reject requests that exceed the quota. Instead, it places them in a priority queue and schedules them by priority while keeping the request rate within the quota.

Prerequisites

Step 1: Create QuotaSchedulingPolicy

  1. Use kubectl to connect to the ASM instance. For more information, see Access Istio resources with kubectl.

  2. Create a quotaschedulingpolicy.yaml file that contains the following content:

    apiVersion: istio.alibabacloud.com/v1
    kind: QuotaSchedulingPolicy
    metadata:
      name: quotascheduling
      namespace: istio-system
    spec:
      quota_scheduler:
        bucket_capacity: 10
        fill_amount: 10
        rate_limiter:
          interval: 1s
        scheduler:
          workloads:
            - label_matcher:
                match_labels:
                  http.request.header.user_type: guest
              parameters:
                priority: 50.0
              name: guest
            - label_matcher:
                match_labels:
                  http.request.header.user_type: subscriber
              parameters:
                priority: 200.0
              name: subscriber
        selectors:
        - service: httpbin.default.svc.cluster.local

    The following table describes some of the fields. For more information about the related fields, see QuotaSchedulingPolicy field reference.

    Field

    Description

    fill_amount

    The number of tokens added per interval. In this example, the value is 10, meaning 10 tokens are added to the bucket after each interval.

    interval

    The interval at which tokens are added to the bucket. In this example, the value is 1s, so 10 tokens are added every second.

    bucket_capacity

    The maximum number of tokens in the bucket. When the request rate is lower than the fill rate, tokens accumulate up to bucket_capacity, allowing a degree of burst traffic. In this example, the value is 10, equal to fill_amount, so no burst traffic is allowed.

    workloads

    Two types of requests are defined based on user_type in the request headers: guest and subscriber. The priority of a request of the guest type is 50, and that of a request of the subscriber type is 200.

    selectors

    The services to which the quota policy applies. In this example, quota limiting is applied to the httpbin.default.svc.cluster.local service.

  3. Run the following command to create QuotaSchedulingPolicy:

kubectl apply -f quotaschedulingpolicy.yaml

Step 2: Verify whether QuotaSchedulingPolicy takes effect

In this example, the stress testing tool Fortio is used. For more information, see the Installation section ofFortio on the GitHub website.

  1. Open two terminals and run the following stress testing commands simultaneously. In both tests, 10 concurrent connections send requests at 10,000 QPS, far exceeding the service's configured quota.

    fortio load -c 10 -qps 10000  -H "user_type:guest" -t 30s -timeout 60s -a http://${IP address of the ASM ingress gateway}/status/201
    fortio load -c 10 -qps 10000  -H "user_type:subscriber" -t 30s -timeout 60s -a http://${IP address of the ASM ingress gateway}/status/202
    Note

    Replace ${IP address of the ASM ingress gateway} in the preceding commands with the IP address of your ASM ingress gateway. For more information about how to obtain the IP address of the ASM ingress gateway, see substep 1 of Step 3 in the Version-based traffic routing with Istio topic.

    Expected output from test 1:

    ...
    # target 50% 4.83333
    # target 75% 5.20763
    # target 90% 5.38203
    # target 99% 5.48668
    # target 99.9% 5.49714
    Sockets used: 10 (for perfect keepalive, would be 10)
    Uniform: false, Jitter: false
    Code 201 : 70 (100.0 %)
    Response Header Sizes : count 70 avg 249.94286 +/- 0.2871 min 248 max 250 sum 17496
    Response Body/Total Sizes : count 70 avg 249.94286 +/- 0.2871 min 248 max 250 sum 17496
    All done 70 calls (plus 10 warmup) 4566.839 ms avg, 2.1 qps
    Successfully wrote 4693 bytes of Json data to 2024-07-26-232250_114_55_5_155_status_201_iZbp1cz9ur77robaiv085tZ.json

    Expected output from test 2:

    fortio load -c 10 -qps 10000  -H "user_type:subscriber" -t 30s -timeout 60s -a http://114.55.xx.xx/status/202
    ...
    # target 50% 0.253333
    # target 75% 1.875
    # target 90% 4.26635
    # target 99% 4.47301
    # target 99.9% 4.49367
    Sockets used: 10 (for perfect keepalive, would be 10)
    Uniform: false, Jitter: false
    Code 202 : 250 (100.0 %)
    Response Header Sizes : count 250 avg 250.264 +/- 0.4408 min 250 max 251 sum 62566
    Response Body/Total Sizes : count 250 avg 250.264 +/- 0.4408 min 250 max 251 sum 62566
    All done 250 calls (plus 10 warmup) 1226.657 ms avg, 8.0 qps
    Successfully wrote 4509 bytes of Json data to 2024-07-26-232250_114_55_5_155_status_202_iZbp1cz9ur77robaiv085tZ.json

    The output shows that test 2 has about 1/4 the average latency and 4 times the QPS of test 1, because the subscriber priority (200) is four times the guest priority (50). A total of 320 requests are processed within 30 seconds across both tests. Excluding the 20 warm-up requests, the effective rate is exactly 10 requests per second, confirming that the service stays within the quota.

References

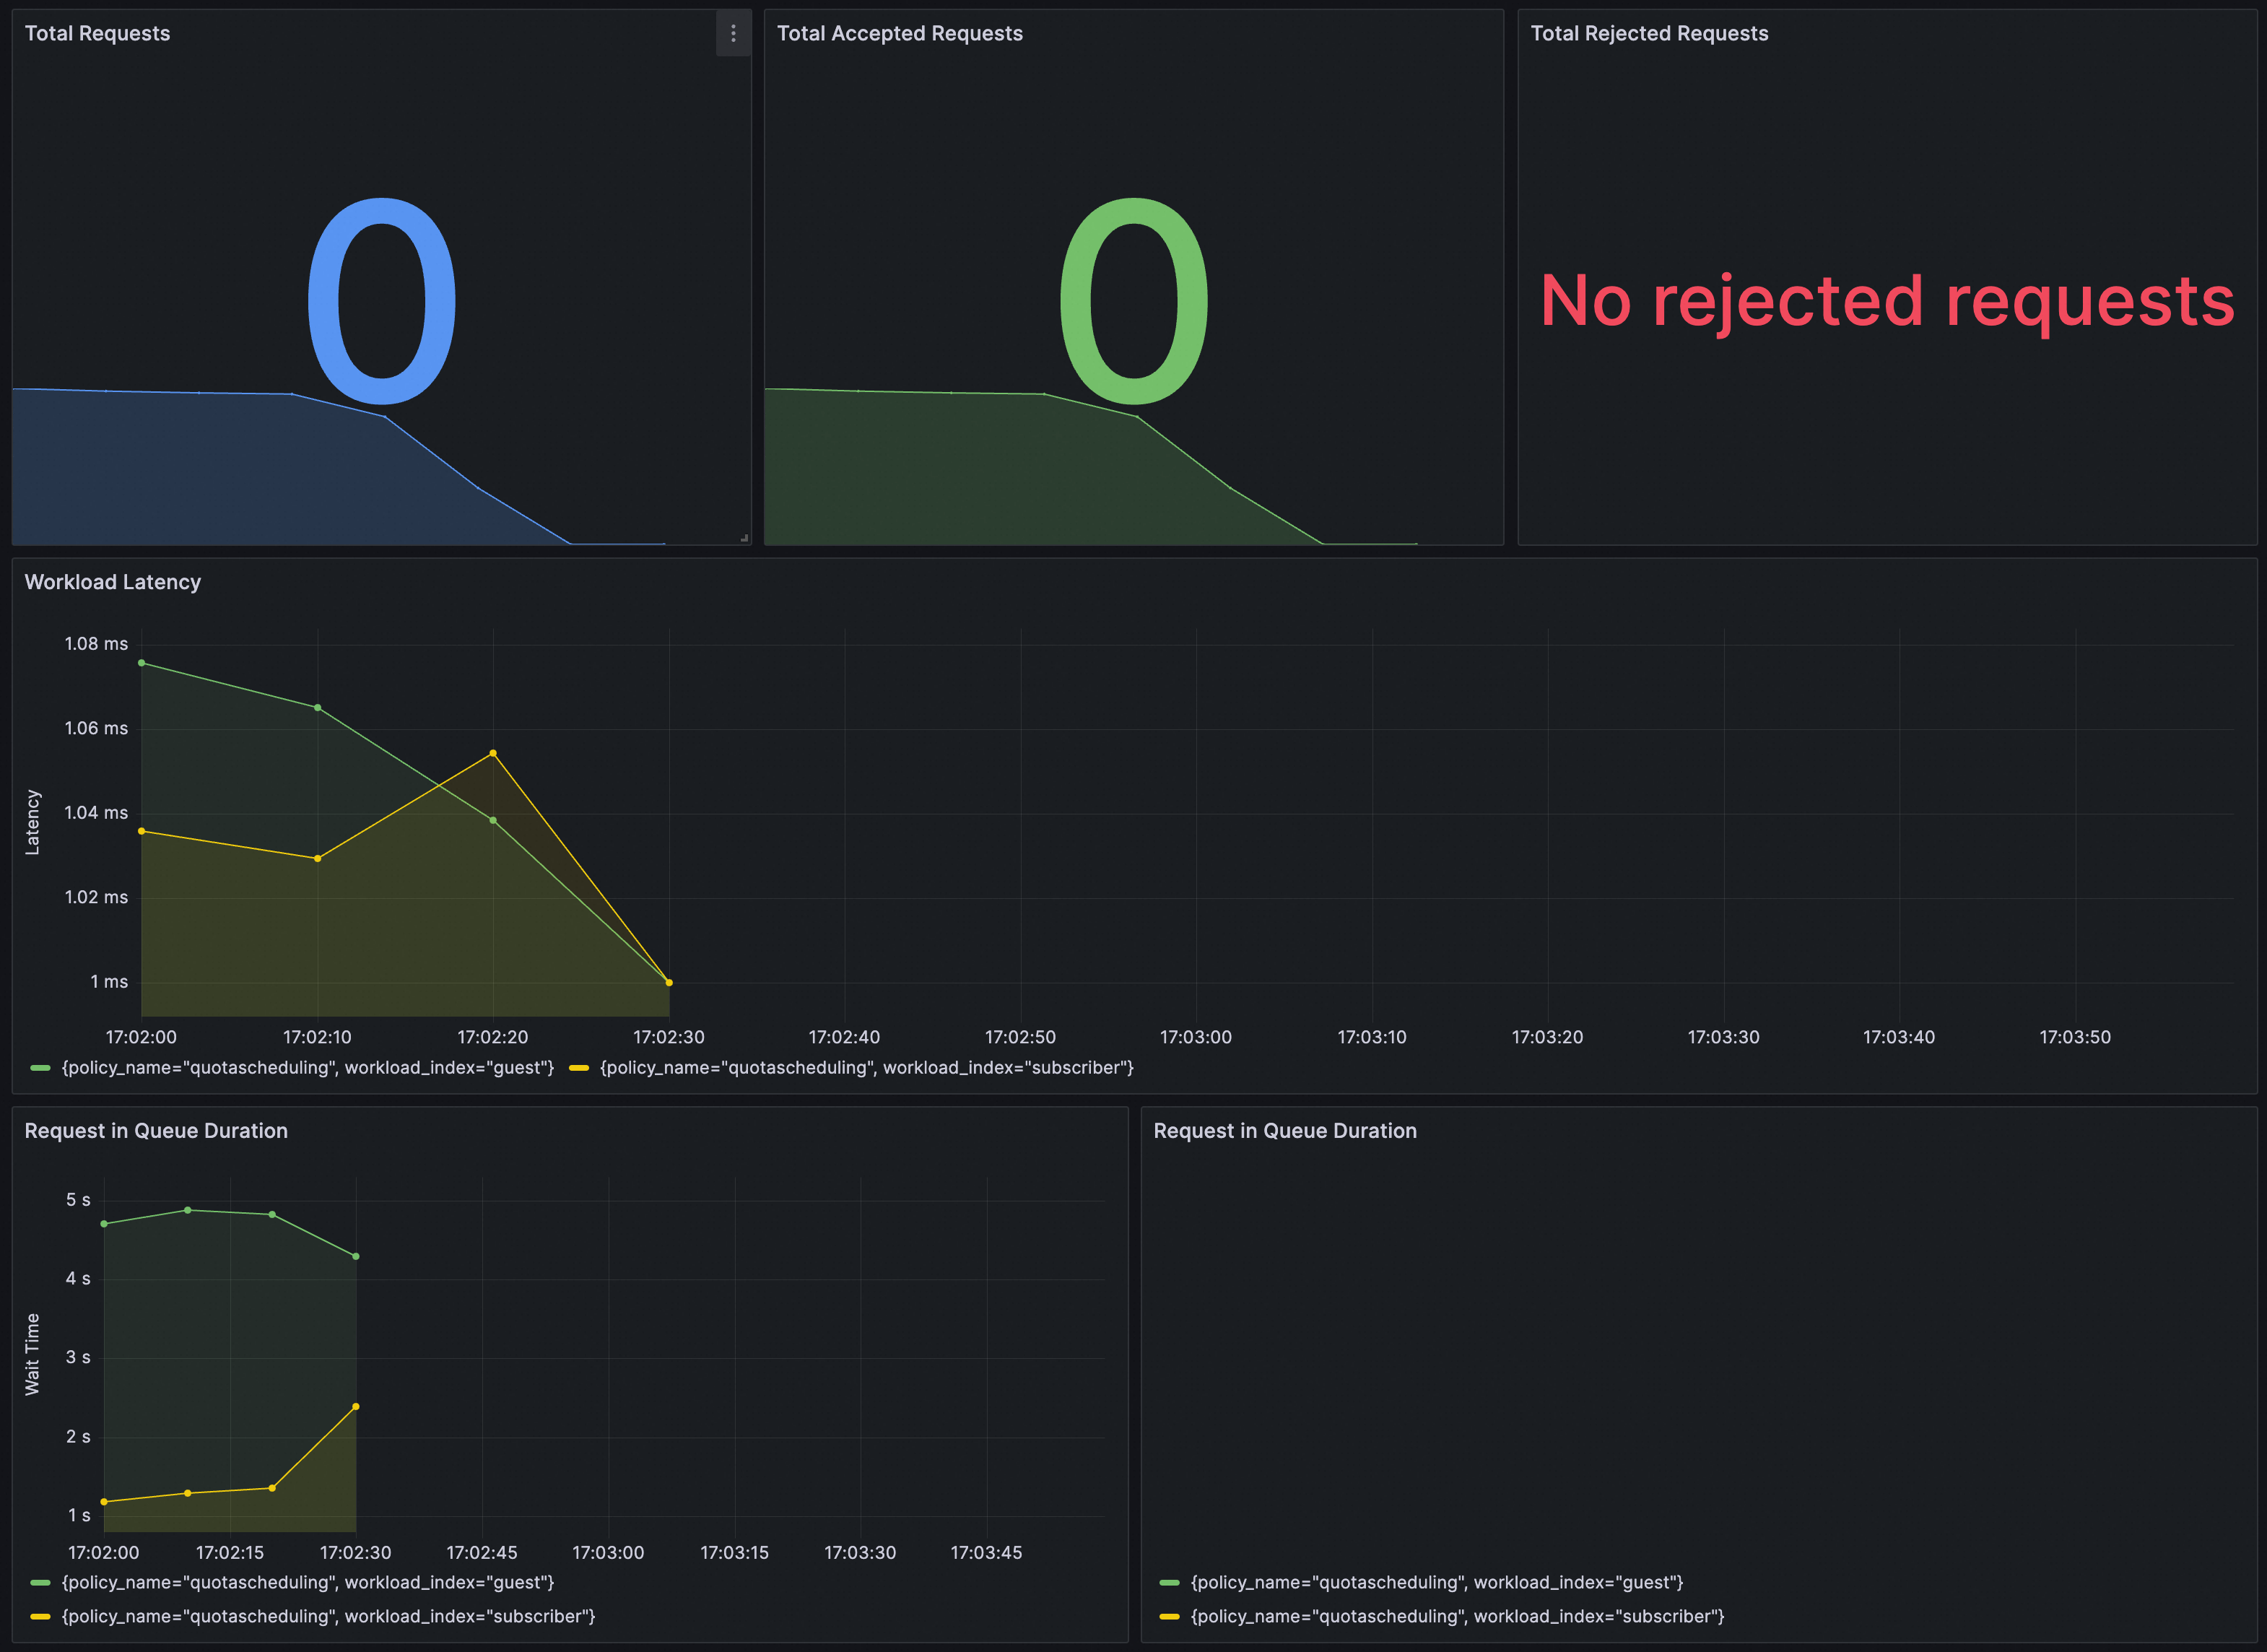
You can verify whether QuotaSchedulingPolicy takes effect in Grafana. Make sure the Prometheus instance for Grafana is configured with ASM traffic scheduling suite.

Import the following content into Grafana to create a QuotaSchedulingPolicy dashboard.

Click to view details

{
  "annotations": {
    "list": [
      {
        "builtIn": 1,
        "datasource": {
          "type": "grafana",
          "uid": "-- Grafana --"
        },
        "enable": true,
        "hide": true,
        "iconColor": "rgba(0, 211, 255, 1)",
        "name": "Annotations & Alerts",
        "type": "dashboard"
      }
    ]
  },
  "editable": true,
  "fiscalYearStartMonth": 0,
  "graphTooltip": 0,
  "id": 44,
  "links": [],
  "liveNow": false,
  "panels": [
    {
      "datasource": {
        "type": "prometheus",
        "uid": "${datasource}"
      },
      "description": "Signal derived from periodic execution of query: (sum(rate(workload_requests_total{policy_name=\"quotascheduling\",component_id=\"root.0\",decision_type=\"DECISION_TYPE_ACCEPTED\"}[30s])) / sum(rate(workload_requests_total{policy_name=\"quotascheduling\",component_id=\"root.0\"}[30s]))) * 100",
      "fieldConfig": {
        "defaults": {
          "color": {
            "mode": "palette-classic"
          },
          "custom": {
            "axisCenteredZero": false,
            "axisColorMode": "text",
            "axisLabel": "",
            "axisPlacement": "auto",
            "barAlignment": 0,
            "drawStyle": "line",
            "fillOpacity": 10,
            "gradientMode": "none",
            "hideFrom": {
              "legend": false,
              "tooltip": false,
              "viz": false
            },
            "lineInterpolation": "linear",
            "lineWidth": 1,
            "pointSize": 5,
            "scaleDistribution": {
              "type": "linear"
            },
            "showPoints": "auto",
            "spanNulls": false,
            "stacking": {
              "group": "A",
              "mode": "none"
            },
            "thresholdsStyle": {
              "mode": "off"
            }
          },
          "mappings": [],
          "thresholds": {
            "mode": "absolute",
            "steps": [
              {
                "color": "green",
                "value": null
              },
              {
                "color": "red",
                "value": 80
              }
            ]
          },
          "unit": ""
        },
        "overrides": []
      },
      "gridPos": {
        "h": 10,
        "w": 24,
        "x": 0,
        "y": 0
      },
      "id": 1,
      "interval": "10s",
      "options": {
        "legend": {
          "calcs": [],
          "displayMode": "list",
          "placement": "bottom",
          "showLegend": true
        },
        "tooltip": {
          "mode": "single",
          "sort": "none"
        }
      },
      "pluginVersion": "v10.1.0",
      "targets": [
        {
          "datasource": {
            "type": "prometheus",
            "uid": "${datasource}"
          },
          "editorMode": "code",
          "expr": "(sum by (policy_name)(rate(workload_requests_total{component_id=\"root.0\",decision_type=\"DECISION_TYPE_ACCEPTED\"}[30s])) / sum by (policy_name)(rate(workload_requests_total{component_id=\"root.0\"}[30s]))) * 100",
          "intervalFactor": 1,
          "legendFormat": "policy={{policy_name}}",
          "range": true,
          "refId": "A"
        }
      ],
      "title": "ACCEPT_PERCENTAGE - runs every 10s, metrics: workload_requests_total",
      "type": "timeseries"
    },
    {
      "datasource": {
        "type": "prometheus",
        "uid": "${datasource}"
      },
      "description": "",
      "fieldConfig": {
        "defaults": {
          "color": {
            "mode": "palette-classic"
          },
          "custom": {
            "axisCenteredZero": false,
            "axisColorMode": "text",
            "axisLabel": "Decisions",
            "axisPlacement": "auto",
            "barAlignment": 0,
            "drawStyle": "line",
            "fillOpacity": 10,
            "gradientMode": "none",
            "hideFrom": {
              "legend": false,
              "tooltip": false,
              "viz": false
            },
            "lineInterpolation": "linear",
            "lineWidth": 1,
            "pointSize": 5,
            "scaleDistribution": {
              "type": "linear"
            },
            "showPoints": "auto",
            "spanNulls": false,
            "stacking": {
              "group": "A",
              "mode": "none"
            },
            "thresholdsStyle": {
              "mode": "off"
            }
          },
          "mappings": [],
          "thresholds": {
            "mode": "absolute",
            "steps": [
              {
                "color": "green",
                "value": null
              },
              {
                "color": "red",
                "value": 80
              }
            ]
          },
          "unit": "reqps"
        },
        "overrides": []
      },
      "gridPos": {
        "h": 10,
        "w": 24,
        "x": 0,
        "y": 10
      },
      "id": 2,
      "interval": "10s",
      "options": {
        "legend": {
          "calcs": [],
          "displayMode": "list",
          "placement": "bottom",
          "showLegend": true
        },
        "tooltip": {
          "mode": "single",
          "sort": "none"
        }
      },
      "pluginVersion": "v10.1.0",
      "targets": [
        {
          "datasource": {
            "type": "prometheus",
            "uid": "${datasource}"
          },
          "expr": "sum by(decision_type) (rate(workload_requests_total{component_id=\"root.0\",policy_name=\"quotascheduling\"}[$__rate_interval]))",
          "intervalFactor": 1,
          "refId": "A"
        }
      ],
      "title": "Workload Decisions",
      "type": "timeseries"
    },
    {
      "datasource": {
        "type": "prometheus",
        "uid": "${datasource}"
      },
      "description": "",
      "fieldConfig": {
        "defaults": {
          "color": {
            "mode": "palette-classic"
          },
          "custom": {
            "axisCenteredZero": false,
            "axisColorMode": "text",
            "axisLabel": "Decisions",
            "axisPlacement": "auto",
            "barAlignment": 0,
            "drawStyle": "line",
            "fillOpacity": 10,
            "gradientMode": "none",
            "hideFrom": {
              "legend": false,
              "tooltip": false,
              "viz": false
            },
            "lineInterpolation": "linear",
            "lineWidth": 1,
            "pointSize": 5,
            "scaleDistribution": {
              "type": "linear"
            },
            "showPoints": "auto",
            "spanNulls": false,
            "stacking": {
              "group": "A",
              "mode": "none"
            },
            "thresholdsStyle": {
              "mode": "off"
            }
          },
          "mappings": [],
          "thresholds": {
            "mode": "absolute",
            "steps": [
              {
                "color": "green",
                "value": null
              },
              {
                "color": "red",
                "value": 80
              }
            ]
          },
          "unit": "reqps"
        },
        "overrides": []
      },
      "gridPos": {
        "h": 10,
        "w": 24,
        "x": 0,
        "y": 20
      },
      "id": 3,
      "interval": "10s",
      "options": {
        "legend": {
          "calcs": [],
          "displayMode": "list",
          "placement": "bottom",
          "showLegend": true
        },
        "tooltip": {
          "mode": "single",
          "sort": "none"
        }
      },
      "pluginVersion": "v10.1.0",
      "targets": [
        {
          "datasource": {
            "type": "prometheus",
            "uid": "${datasource}"
          },
          "expr": "sum by(workload_index, decision_type) (rate(workload_requests_total{component_id=\"root.0\",policy_name=\"quotascheduling\",decision_type=\"DECISION_TYPE_ACCEPTED\"}[$__rate_interval]))",
          "intervalFactor": 1,
          "refId": "A"
        }
      ],
      "title": "Workload Decisions (accepted)",
      "type": "timeseries"
    },
    {
      "datasource": {
        "type": "prometheus",
        "uid": "${datasource}"
      },
      "description": "",
      "fieldConfig": {
        "defaults": {
          "color": {
            "mode": "palette-classic"
          },
          "custom": {
            "axisCenteredZero": false,
            "axisColorMode": "text",
            "axisLabel": "Decisions",
            "axisPlacement": "auto",
            "barAlignment": 0,
            "drawStyle": "line",
            "fillOpacity": 10,
            "gradientMode": "none",
            "hideFrom": {
              "legend": false,
              "tooltip": false,
              "viz": false
            },
            "lineInterpolation": "linear",
            "lineWidth": 1,
            "pointSize": 5,
            "scaleDistribution": {
              "type": "linear"
            },
            "showPoints": "auto",
            "spanNulls": false,
            "stacking": {
              "group": "A",
              "mode": "none"
            },
            "thresholdsStyle": {
              "mode": "off"
            }
          },
          "mappings": [],
          "thresholds": {
            "mode": "absolute",
            "steps": [
              {
                "color": "green",
                "value": null
              },
              {
                "color": "red",
                "value": 80
              }
            ]
          },
          "unit": "reqps"
        },
        "overrides": []
      },
      "gridPos": {
        "h": 10,
        "w": 24,
        "x": 0,
        "y": 30
      },
      "id": 4,
      "interval": "10s",
      "options": {
        "legend": {
          "calcs": [],
          "displayMode": "list",
          "placement": "bottom",
          "showLegend": true
        },
        "tooltip": {
          "mode": "single",
          "sort": "none"
        }
      },
      "pluginVersion": "v10.1.0",
      "targets": [
        {
          "datasource": {
            "type": "prometheus",
            "uid": "${datasource}"
          },
          "editorMode": "code",
          "expr": "sum by(workload_index, decision_type, policy_name) (rate(workload_requests_total{component_id=\"root.0\",decision_type=\"DECISION_TYPE_REJECTED\"}[$__rate_interval]))",
          "intervalFactor": 1,
          "range": true,
          "refId": "A"
        }
      ],
      "title": "Workload Decisions (rejected)",
      "type": "timeseries"
    },
    {
      "datasource": {
        "type": "prometheus",
        "uid": "${datasource}"
      },
      "fieldConfig": {
        "defaults": {
          "color": {
            "mode": "thresholds"
          },
          "mappings": [],
          "noValue": "No data",
          "thresholds": {
            "mode": "absolute",
            "steps": [
              {
                "color": "blue",
                "value": null
              }
            ]
          },
          "unit": "short"
        },
        "overrides": []
      },
      "gridPos": {
        "h": 10,
        "w": 8,
        "x": 0,
        "y": 40
      },
      "id": 5,
      "options": {
        "colorMode": "value",
        "graphMode": "area",
        "justifyMode": "center",
        "orientation": "horizontal",
        "reduceOptions": {
          "calcs": [
            "lastNotNull"
          ],
          "fields": "",
          "values": false
        },
        "textMode": "auto"
      },
      "pluginVersion": "10.0.9",
      "targets": [
        {
          "datasource": {
            "type": "prometheus",
            "uid": "${datasource}"
          },
          "editorMode": "code",
          "expr": "sum by (policy_name)(increase(workload_requests_total{component_id=\"root.0\"}[$__range]))",
          "instant": false,
          "intervalFactor": 1,
          "legendFormat": "{{ policy_name }}",
          "range": true,
          "refId": "A"
        }
      ],
      "title": "Total Requests",
      "type": "stat"
    },
    {
      "datasource": {
        "type": "prometheus",
        "uid": "${datasource}"
      },
      "fieldConfig": {
        "defaults": {
          "color": {
            "mode": "thresholds"
          },
          "mappings": [],
          "noValue": "No data",
          "thresholds": {
            "mode": "absolute",
            "steps": [
              {
                "color": "green",
                "value": null
              }
            ]
          },
          "unit": "short"
        },
        "overrides": []
      },
      "gridPos": {
        "h": 10,
        "w": 8,
        "x": 8,
        "y": 40
      },
      "id": 6,
      "options": {
        "colorMode": "value",
        "graphMode": "area",
        "justifyMode": "center",
        "orientation": "horizontal",
        "reduceOptions": {
          "calcs": [
            "lastNotNull"
          ],
          "fields": "",
          "values": false
        },
        "textMode": "auto"
      },
      "pluginVersion": "10.0.9",
      "targets": [
        {
          "datasource": {
            "type": "prometheus",
            "uid": "${datasource}"
          },
          "editorMode": "code",
          "expr": "sum by (policy_name)(increase(workload_requests_total{component_id=\"root.0\",decision_type=\"DECISION_TYPE_ACCEPTED\"}[$__range]))",
          "instant": false,
          "intervalFactor": 1,
          "legendFormat": "{{ policy_name }}",
          "range": true,
          "refId": "A"
        }
      ],
      "title": "Total Accepted Requests",
      "type": "stat"
    },
    {
      "datasource": {
        "type": "prometheus",
        "uid": "${datasource}"
      },
      "fieldConfig": {
        "defaults": {
          "color": {
            "mode": "thresholds"
          },
          "mappings": [],
          "noValue": "No rejected requests",
          "thresholds": {
            "mode": "absolute",
            "steps": [
              {
                "color": "red",
                "value": null
              }
            ]
          },
          "unit": "short"
        },
        "overrides": []
      },
      "gridPos": {
        "h": 10,
        "w": 8,
        "x": 16,
        "y": 40
      },
      "id": 7,
      "options": {
        "colorMode": "value",
        "graphMode": "area",
        "justifyMode": "center",
        "orientation": "horizontal",
        "reduceOptions": {
          "calcs": [
            "lastNotNull"
          ],
          "fields": "",
          "values": false
        },
        "textMode": "auto"
      },
      "pluginVersion": "10.0.9",
      "targets": [
        {
          "datasource": {
            "type": "prometheus",
            "uid": "${datasource}"
          },
          "editorMode": "code",
          "expr": "sum by (policy_name)(increase(workload_requests_total{component_id=\"root.0\",decision_type=\"DECISION_TYPE_REJECTED\"}[$__range]))",
          "instant": false,
          "intervalFactor": 1,
          "legendFormat": "{{ policy_name }}",
          "range": true,
          "refId": "A"
        }
      ],
      "title": "Total Rejected Requests",
      "type": "stat"
    },
    {
      "datasource": {
        "type": "prometheus",
        "uid": "${datasource}"
      },
      "description": "",
      "fieldConfig": {
        "defaults": {
          "color": {
            "mode": "palette-classic"
          },
          "custom": {
            "axisCenteredZero": false,
            "axisColorMode": "text",
            "axisLabel": "Latency",
            "axisPlacement": "auto",
            "barAlignment": 0,
            "drawStyle": "line",
            "fillOpacity": 10,
            "gradientMode": "none",
            "hideFrom": {
              "legend": false,
              "tooltip": false,
              "viz": false
            },
            "lineInterpolation": "linear",
            "lineWidth": 1,
            "pointSize": 5,
            "scaleDistribution": {
              "type": "linear"
            },
            "showPoints": "auto",
            "spanNulls": false,
            "stacking": {
              "group": "A",
              "mode": "none"
            },
            "thresholdsStyle": {
              "mode": "off"
            }
          },
          "mappings": [],
          "thresholds": {
            "mode": "absolute",
            "steps": [
              {
                "color": "green",
                "value": null
              },
              {
                "color": "red",
                "value": 80
              }
            ]
          },
          "unit": "ms"
        },
        "overrides": []
      },
      "gridPos": {
        "h": 10,
        "w": 24,
        "x": 0,
        "y": 50
      },
      "id": 8,
      "interval": "10s",
      "options": {
        "legend": {
          "calcs": [],
          "displayMode": "list",
          "placement": "bottom",
          "showLegend": true
        },
        "tooltip": {
          "mode": "single",
          "sort": "none"
        }
      },
      "pluginVersion": "v10.1.0",
      "targets": [
        {
          "datasource": {
            "type": "prometheus",
            "uid": "${datasource}"
          },
          "editorMode": "code",
          "expr": "(sum by (workload_index, policy_name) (increase(workload_latency_ms_sum{component_id=\"root.0\"}[$__rate_interval])))/(sum by (workload_index, policy_name) (increase(workload_latency_ms_count{component_id=\"root.0\"}[$__rate_interval])))",
          "intervalFactor": 1,
          "range": true,
          "refId": "A"
        }
      ],
      "title": "Workload Latency",
      "type": "timeseries"
    },
    {
      "datasource": {
        "type": "prometheus",
        "uid": "${datasource}"
      },
      "description": "",
      "fieldConfig": {
        "defaults": {
          "color": {
            "mode": "palette-classic"
          },
          "custom": {
            "axisCenteredZero": false,
            "axisColorMode": "text",
            "axisLabel": "Wait Time",
            "axisPlacement": "auto",
            "barAlignment": 0,
            "drawStyle": "line",
            "fillOpacity": 10,
            "gradientMode": "none",
            "hideFrom": {
              "legend": false,
              "tooltip": false,
              "viz": false
            },
            "lineInterpolation": "linear",
            "lineWidth": 1,
            "pointSize": 5,
            "scaleDistribution": {
              "type": "linear"
            },
            "showPoints": "auto",
            "spanNulls": false,
            "stacking": {
              "group": "A",
              "mode": "none"
            },
            "thresholdsStyle": {
              "mode": "off"
            }
          },
          "mappings": [],
          "thresholds": {
            "mode": "absolute",
            "steps": [
              {
                "color": "green",
                "value": null
              },
              {
                "color": "red",
                "value": 80
              }
            ]
          },
          "unit": "ms"
        },
        "overrides": []
      },
      "gridPos": {
        "h": 10,
        "w": 12,
        "x": 0,
        "y": 60
      },
      "id": 9,
      "interval": "10s",
      "options": {
        "legend": {
          "calcs": [],
          "displayMode": "list",
          "placement": "bottom",
          "showLegend": true
        },
        "tooltip": {
          "mode": "single",
          "sort": "none"
        }
      },
      "pluginVersion": "v10.1.0",
      "targets": [
        {
          "datasource": {
            "type": "prometheus",
            "uid": "${datasource}"
          },
          "editorMode": "code",
          "expr": "(sum by (workload_index, policy_name) (increase(request_in_queue_duration_ms_sum{component_id=\"root.0\"}[$__rate_interval])))/ ((sum by (workload_index, policy_name) (increase(request_in_queue_duration_ms_count{component_id=\"root.0\"}[$__rate_interval]))) != 0)",
          "intervalFactor": 1,
          "range": true,
          "refId": "A"
        }
      ],
      "title": "Request in Queue Duration",
      "type": "timeseries"
    },
    {
      "datasource": {
        "type": "prometheus",
        "uid": "${datasource}"
      },
      "fieldConfig": {
        "defaults": {
          "color": {
            "mode": "palette-classic"
          },
          "custom": {
            "axisCenteredZero": false,
            "axisColorMode": "text",
            "axisGridShow": true,
            "axisLabel": "",
            "axisPlacement": "hidden",
            "fillOpacity": 80,
            "gradientMode": "none",
            "hideFrom": {
              "legend": false,
              "tooltip": false,
              "viz": false
            },
            "lineWidth": 1,
            "scaleDistribution": {
              "type": "linear"
            },
            "thresholdsStyle": {
              "mode": "off"
            }
          },
          "mappings": [],
          "thresholds": {
            "mode": "absolute",
            "steps": [
              {
                "color": "green",
                "value": null
              },
              {
                "color": "red",
                "value": 80
              }
            ]
          },
          "unit": "ms"
        },
        "overrides": []
      },
      "gridPos": {
        "h": 10,
        "w": 12,
        "x": 12,
        "y": 60
      },
      "id": 10,
      "options": {
        "barRadius": 0,
        "barWidth": 0.97,
        "colorByField": "",
        "fullHighlight": false,
        "groupWidth": 0.7,
        "legend": {
          "calcs": [],
          "displayMode": "list",
          "placement": "bottom",
          "showLegend": true
        },
        "orientation": "horizontal",
        "showValue": "auto",
        "stacking": "none",
        "tooltip": {
          "mode": "single",
          "sort": "sort"
        },
        "xTickLabelRotation": 0,
        "xTickLabelSpacing": 0
      },
      "pluginVersion": "v10.1.0",
      "targets": [
        {
          "datasource": {
            "type": "prometheus",
            "uid": "${datasource}"
          },
          "editorMode": "code",
          "expr": "topk(10, (sum by(workload_index, policy_name) (increase(request_in_queue_duration_ms_sum{component_id=\"root.0\"}[$__range])) ) / ((sum by(workload_index, policy_name) (increase(request_in_queue_duration_ms_count{component_id=\"root.0\"}[$__range])) )) != 0)",
          "format": "time_series",
          "instant": true,
          "intervalFactor": 1,
          "legendFormat": "",
          "range": false,
          "refId": "A"
        }
      ],
      "title": "Request in Queue Duration",
      "type": "barchart"
    },
    {
      "datasource": {
        "type": "prometheus",
        "uid": "${datasource}"
      },
      "description": "",
      "fieldConfig": {
        "defaults": {
          "color": {
            "mode": "palette-classic"
          },
          "custom": {
            "axisCenteredZero": false,
            "axisColorMode": "text",
            "axisLabel": "Token Rate",
            "axisPlacement": "auto",
            "barAlignment": 0,
            "drawStyle": "line",
            "fillOpacity": 10,
            "gradientMode": "none",
            "hideFrom": {
              "legend": false,
              "tooltip": false,
              "viz": false
            },
            "lineInterpolation": "linear",
            "lineWidth": 1,
            "pointSize": 5,
            "scaleDistribution": {
              "type": "linear"
            },
            "showPoints": "auto",
            "spanNulls": false,
            "stacking": {
              "group": "A",
              "mode": "none"
            },
            "thresholdsStyle": {
              "mode": "off"
            }
          },
          "mappings": [],
          "thresholds": {
            "mode": "absolute",
            "steps": [
              {
                "color": "green",
                "value": null
              },
              {
                "color": "red",
                "value": 80
              }
            ]
          },
          "unit": ""
        },
        "overrides": []
      },
      "gridPos": {
        "h": 8,
        "w": 12,
        "x": 0,
        "y": 70
      },
      "id": 13,
      "interval": "10s",
      "options": {
        "legend": {
          "calcs": [],
          "displayMode": "list",
          "placement": "bottom",
          "showLegend": true
        },
        "tooltip": {
          "mode": "single",
          "sort": "none"
        }
      },
      "pluginVersion": "v10.1.0",
      "targets": [
        {
          "datasource": {
            "type": "prometheus",
            "uid": "${datasource}"
          },
          "editorMode": "code",
          "expr": "sum by (policy_name)(rate(incoming_tokens_total{component_id=\"root.0\"}[$__rate_interval]))",
          "intervalFactor": 1,
          "range": true,
          "refId": "A"
        }
      ],
      "title": "Incoming Token Rate",
      "type": "timeseries"
    },
    {
      "datasource": {
        "type": "prometheus",
        "uid": "${datasource}"
      },
      "description": "",
      "fieldConfig": {
        "defaults": {
          "color": {
            "mode": "palette-classic"
          },
          "custom": {
            "axisCenteredZero": false,
            "axisColorMode": "text",
            "axisLabel": "Token Rate",
            "axisPlacement": "auto",
            "barAlignment": 0,
            "drawStyle": "line",
            "fillOpacity": 10,
            "gradientMode": "none",
            "hideFrom": {
              "legend": false,
              "tooltip": false,
              "viz": false
            },
            "lineInterpolation": "linear",
            "lineWidth": 1,
            "pointSize": 5,
            "scaleDistribution": {
              "type": "linear"
            },
            "showPoints": "auto",
            "spanNulls": false,
            "stacking": {
              "group": "A",
              "mode": "none"
            },
            "thresholdsStyle": {
              "mode": "off"
            }
          },
          "mappings": [],
          "thresholds": {
            "mode": "absolute",
            "steps": [
              {
                "color": "green",
                "value": null
              },
              {
                "color": "red",
                "value": 80
              }
            ]
          },
          "unit": ""
        },
        "overrides": []
      },
      "gridPos": {
        "h": 8,
        "w": 12,
        "x": 12,
        "y": 70
      },
      "id": 14,
      "interval": "10s",
      "options": {
        "legend": {
          "calcs": [],
          "displayMode": "list",
          "placement": "bottom",
          "showLegend": true
        },
        "tooltip": {
          "mode": "single",
          "sort": "none"
        }
      },
      "pluginVersion": "v10.1.0",
      "targets": [
        {
          "datasource": {
            "type": "prometheus",
            "uid": "${datasource}"
          },
          "editorMode": "code",
          "expr": "sum by (policy_name)(rate(accepted_tokens_total{component_id=\"root.0\"}[$__rate_interval]))",
          "intervalFactor": 1,
          "legendFormat": "Accepted Token Rate",
          "range": true,
          "refId": "A"
        },
        {
          "datasource": {
            "type": "prometheus",
            "uid": "${datasource}"
          },
          "editorMode": "code",
          "expr": "sum by (policy_name)(rate(rejected_tokens_total{component_id=\"root.0\"}[$__rate_interval]))",
          "intervalFactor": 1,
          "legendFormat": "Rejected Token Rate",
          "range": true,
          "refId": "B"
        }
      ],
      "title": "Accepted Token Rate vs Rejected Token Rate",
      "type": "timeseries"
    },
    {
      "datasource": {
        "type": "prometheus",
        "uid": "${datasource}"
      },
      "fieldConfig": {
        "defaults": {
          "color": {
            "mode": "thresholds"
          },
          "mappings": [],
          "noValue": "No data",
          "thresholds": {
            "mode": "absolute",
            "steps": [
              {
                "color": "blue",
                "value": null
              }
            ]
          },
          "unit": "short"
        },
        "overrides": []
      },
      "gridPos": {
        "h": 10,
        "w": 8,
        "x": 0,
        "y": 78
      },
      "id": 15,
      "options": {
        "colorMode": "value",
        "graphMode": "area",
        "justifyMode": "center",
        "orientation": "horizontal",
        "reduceOptions": {
          "calcs": [
            "lastNotNull"
          ],
          "fields": "",
          "values": false
        },
        "textMode": "auto"
      },
      "pluginVersion": "10.0.9",
      "targets": [
        {
          "datasource": {
            "type": "prometheus",
            "uid": "${datasource}"
          },
          "editorMode": "code",
          "expr": "sum by (policy_name)(increase(incoming_tokens_total{component_id=\"root.0\"}[$__range]))",
          "instant": false,
          "intervalFactor": 1,
          "legendFormat": "{{ instance }} - {{ policy_name }}",
          "range": true,
          "refId": "A"
        }
      ],
      "title": "Total Incoming Tokens",
      "type": "stat"
    },
    {
      "datasource": {
        "type": "prometheus",
        "uid": "${datasource}"
      },
      "fieldConfig": {
        "defaults": {
          "color": {
            "mode": "thresholds"
          },
          "mappings": [],
          "noValue": "No data",
          "thresholds": {
            "mode": "absolute",
            "steps": [
              {
                "color": "green",
                "value": null
              }
            ]
          },
          "unit": "short"
        },
        "overrides": []
      },
      "gridPos": {
        "h": 10,
        "w": 8,
        "x": 8,
        "y": 78
      },
      "id": 16,
      "options": {
        "colorMode": "value",
        "graphMode": "area",
        "justifyMode": "center",
        "orientation": "horizontal",
        "reduceOptions": {
          "calcs": [
            "lastNotNull"
          ],
          "fields": "",
          "values": false
        },
        "textMode": "auto"
      },
      "pluginVersion": "10.0.9",
      "targets": [
        {
          "datasource": {
            "type": "prometheus",
            "uid": "${datasource}"
          },
          "editorMode": "code",
          "expr": "sum by (policy_name)(increase(accepted_tokens_total{component_id=\"root.0\"}[$__range]))",
          "instant": false,
          "intervalFactor": 1,
          "legendFormat": "{{ instance }} - {{ policy_name }}",
          "range": true,
          "refId": "A"
        }
      ],
      "title": "Total Accepted Tokens",
      "type": "stat"
    },
    {
      "datasource": {
        "type": "prometheus",
        "uid": "${datasource}"
      },
      "fieldConfig": {
        "defaults": {
          "color": {
            "mode": "thresholds"
          },
          "mappings": [],
          "noValue": "No data",
          "thresholds": {
            "mode": "absolute",
            "steps": [
              {
                "color": "red",
                "value": null
              }
            ]
          },
          "unit": "short"
        },
        "overrides": []
      },
      "gridPos": {
        "h": 10,
        "w": 8,
        "x": 16,
        "y": 78
      },
      "id": 17,
      "options": {
        "colorMode": "value",
        "graphMode": "area",
        "justifyMode": "center",
        "orientation": "horizontal",
        "reduceOptions": {
          "calcs": [
            "lastNotNull"
          ],
          "fields": "",
          "values": false
        },
        "textMode": "auto"
      },
      "pluginVersion": "10.0.9",
      "targets": [
        {
          "datasource": {
            "type": "prometheus",
            "uid": "${datasource}"
          },
          "editorMode": "code",
          "expr": "sum by (policy_name)(increase(rejected_tokens_total{component_id=\"root.0\"}[$__range]))",
          "instant": false,
          "intervalFactor": 1,
          "legendFormat": "{{ instance }} - {{ policy_name }}",
          "range": true,
          "refId": "A"
        }
      ],
      "title": "Total Rejected Tokens",
      "type": "stat"
    }
  ],
  "refresh": false,
  "schemaVersion": 38,
  "style": "dark",
  "tags": [],
  "templating": {
    "list": [
      {
        "hide": 0,
        "includeAll": false,
        "label": "Data Source",
        "multi": false,
        "name": "datasource",
        "options": [],
        "query": "prometheus",
        "refresh": 1,
        "regex": "",
        "skipUrlSync": false,
        "type": "datasource"
      }
    ]
  },
  "time": {
    "from": "now-5m",
    "to": "now"
  },
  "timepicker": {},
  "timezone": "browser",
  "title": "Policy Summary - quotascheduling",
  "version": 1,
  "weekStart": ""
}

The dashboard is as follows:

image