Service Mesh (ASM) exports distributed tracing data from its sidecar proxies to Managed Service for OpenTelemetry. This gives you end-to-end visibility into request flows, service dependencies, and latency across your microservices.
Prerequisites
Before you begin, make sure that you have:
An ASM instance. For more information, see Create an ASM instance
A Container Service for Kubernetes (ACK) cluster added to the ASM instance. For more information, see Add a cluster to an ASM instance and Update an ASM instance
Managed Service for OpenTelemetry activated for your Alibaba Cloud account. For billing details, see Billing rules
Set up tracing
The setup differs by ASM instance version. Select the tab that matches yours.
Set up tracing for ASM 1.18 or later
This version requires an OpenTelemetry Collector deployed in your ACK cluster. The Collector receives traces from ASM sidecar proxies and forwards them to Managed Service for OpenTelemetry over gRPC.
Step 1: Deploy the OpenTelemetry Operator
Connect to your ACK cluster with kubectl and create the namespace:
kubectl create namespace opentelemetry-operator-systemInstall the OpenTelemetry Operator with Helm: This skips cert-manager and auto-generates certificates for the admission webhooks.
   helm repo add open-telemetry https://open-telemetry.github.io/opentelemetry-helm-charts
   helm install --namespace=opentelemetry-operator-system opentelemetry-operator open-telemetry/opentelemetry-operator \
     --set "manager.collectorImage.repository=otel/opentelemetry-collector-k8s" \
     --set admissionWebhooks.certManager.enabled=false \
     --set admissionWebhooks.autoGenerateCert.enabled=true
Verify the Operator pod is running: Expected output: Both containers in the pod should show
Runningstatus.kubectl get pod -n opentelemetry-operator-systemNAME READY STATUS RESTARTS AGE opentelemetry-operator-854fb558b5-pvllj 2/2 Running 0 1m
Step 2: Create an OpenTelemetry Collector
Create a
collector.yamlfile with the following content.Replace the placeholders with your actual values:
Placeholder Description Reference ${ENDPOINT}VPC endpoint that supports gRPC Connect to Managed Service for OpenTelemetry and authenticate clients ${TOKEN}Authentication token Connect to Managed Service for OpenTelemetry and authenticate clients Key configuration details:
The
sidecar.istio.io/inject: "false"annotation prevents ASM from injecting a sidecar into the Collector pod, which would cause a routing loop.The
debugexporter logs trace data to stdout for troubleshooting. Remove it after verifying the setup.The trace pipeline routes spans from the OTLP receiver to both the OTLP exporter (Managed Service for OpenTelemetry) and the debug exporter.
Deploy the Collector:
kubectl apply -f collector.yamlVerify the Collector pod is running: Expected output:
kubectl get pod -n opentelemetry-operator-systemNAME READY STATUS RESTARTS AGE opentelemetry-operator-854fb558b5-pvllj 2/2 Running 0 3m default-collector-5cbb4497f4-2hjqv 1/1 Running 0 30sVerify the Collector service exists: Expected output: The
default-collectorservice on port4317receives trace data from ASM.kubectl get svc -n opentelemetry-operator-systemopentelemetry-operator ClusterIP 172.16.138.165 <none> 8443/TCP,8080/TCP 3m opentelemetry-operator-webhook ClusterIP 172.16.127.0 <none> 443/TCP 3m default-collector ClusterIP 172.16.145.93 <none> 4317/TCP 30s default-collector-headless ClusterIP None <none> 4317/TCP 30s default-collector-monitoring ClusterIP 172.16.136.5 <none> 8888/TCP 30s
Step 3: Configure tracing in the ASM console
Log on to the ASM console. In the left-side navigation pane, choose Service Mesh > Mesh Management.
On the Mesh Management page, click your ASM instance name. In the left-side navigation pane, choose Observability Management Center > Observability Settings.
In the Tracing Analysis Settings section, set Sampling Percentage to 100 and click Submit.
In the left-side navigation pane, choose Observability Management Center > Tracing Analysis. Configure the following fields:
Field Value OpenTelemetry Service Address/Domain Name default-collector.opentelemetry-operator-system.svc.cluster.localOpenTelemetry Service Port 4317Click Collect ASM Tracing Data to Managed Service for OpenTelemetry.
Step 4: Verify the setup
Deploy the Bookinfo and sleep test applications. For more information, see Deploy an application in an ACK cluster that is added to an ASM instance.
sleep.yaml
Send a test request through the mesh:
kubectl exec -it deploy/sleep -c sleep -- curl productpage:9080/productpage?u=normalCheck the Collector logs for exported spans: This confirms the Collector received and exported trace data.
2023-11-20T08:44:27.531Z info TracesExporter {"kind": "exporter", "data_type": "traces", "name": "debug", "resource spans": 1, "spans": 3}View traces in the Application Real-Time Monitoring Service (ARMS) console:
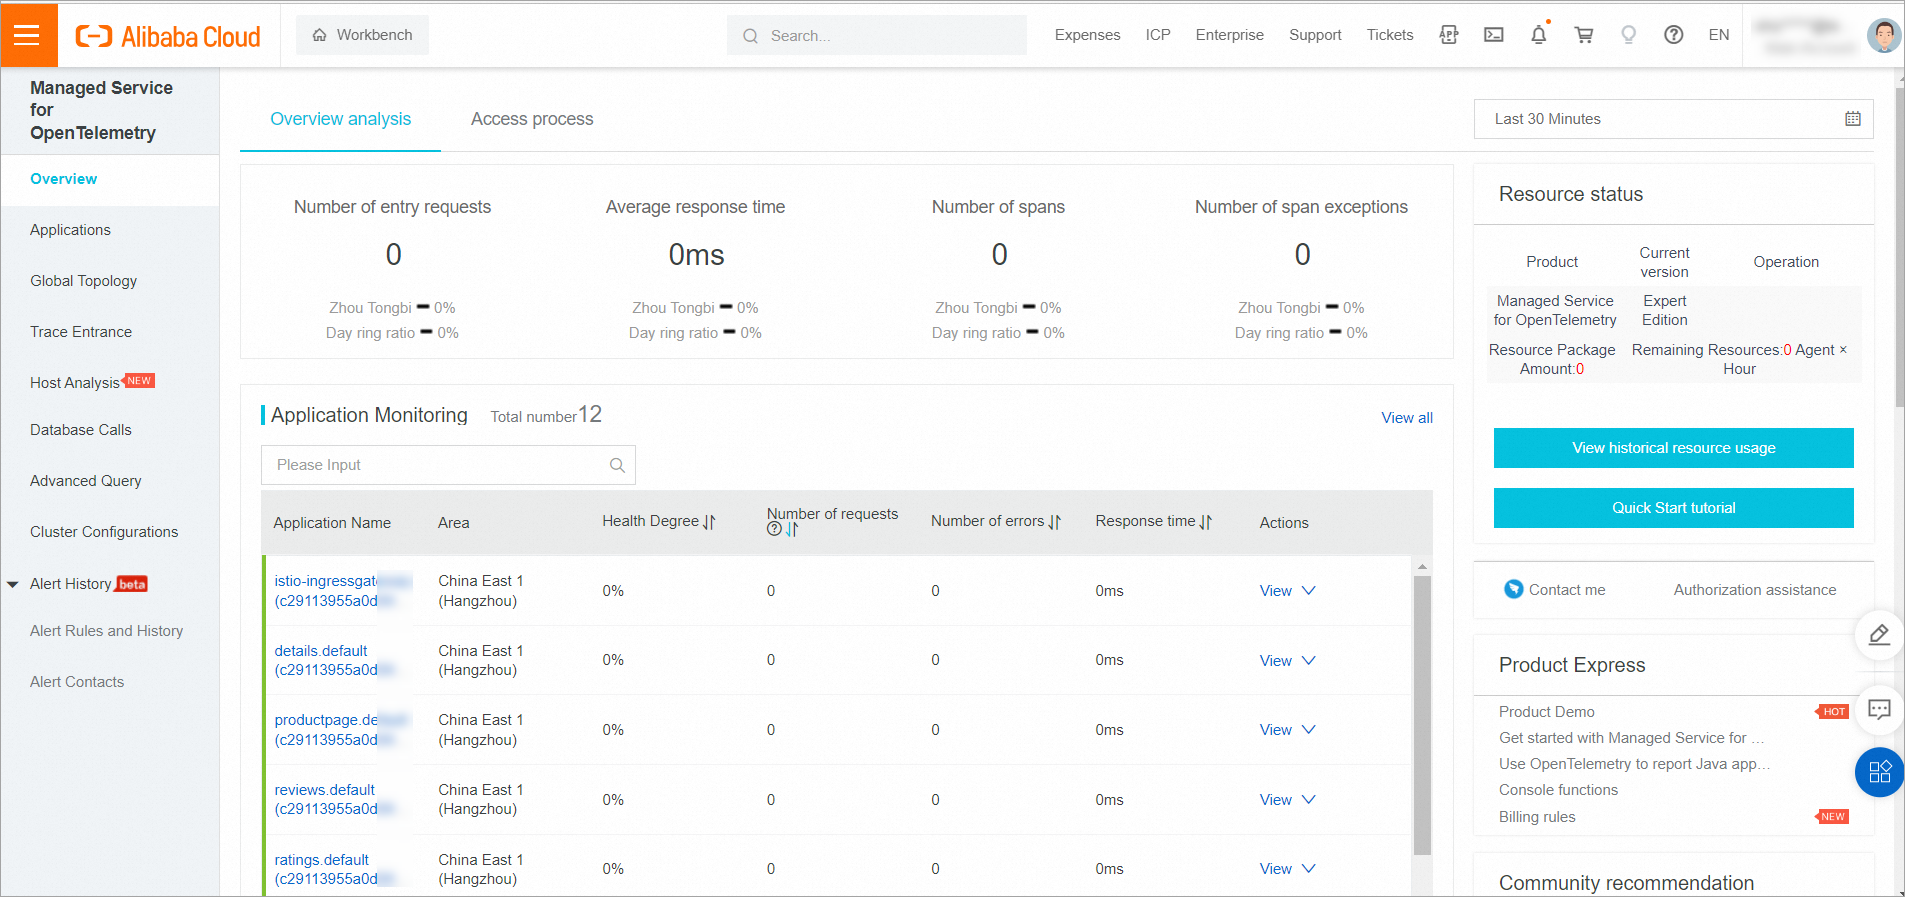
Log on to the ARMS console.
In the left-side navigation pane, choose Application Monitoring > Trace Explorer. Select your region in the upper-left corner.
In the Service Name section, select the sleep application. Tracing data appears on the right. ASM injects a sidecar proxy into the sleep application. When the application sends a request, the sidecar acts as the egress gateway and generates a span for each outbound call.
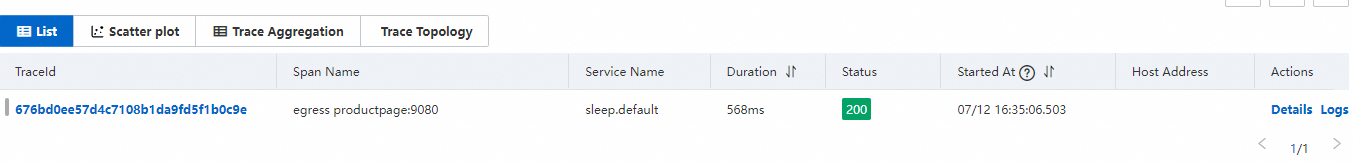
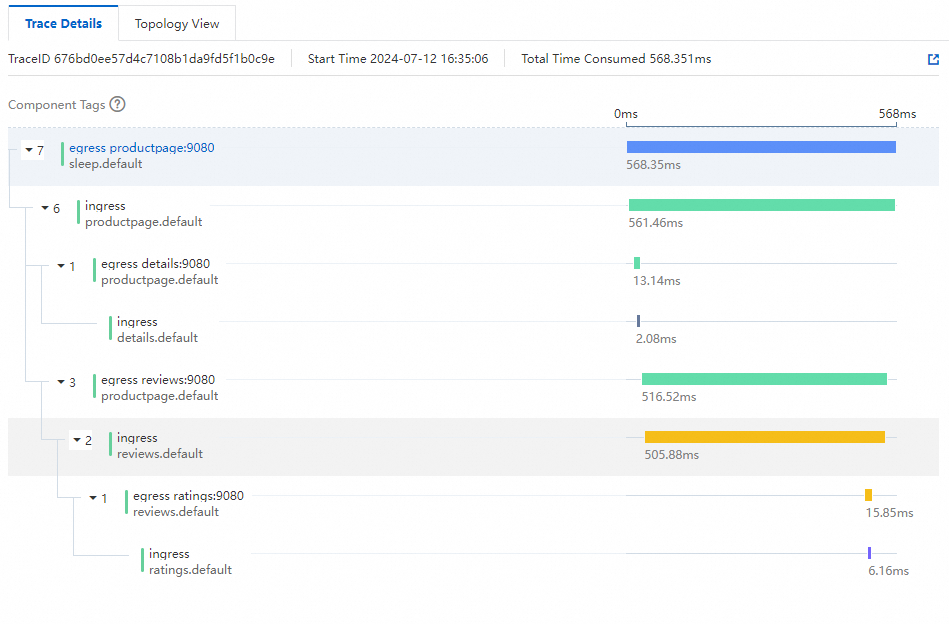
Find a trace ID and click Details in the Actions column to view the full trace with span-level latency.
Set up tracing for ASM 1.17.2.35 to 1.18.0.124
Log on to the ASM console. In the left-side navigation pane, choose Service Mesh > Mesh Management.
On the Mesh Management page, click your ASM instance name. In the left-side navigation pane, choose Observability Management Center > Tracing Analysis.
On the Tracing Analysis page, click Collect ASM Tracing Data to Managed Service for OpenTelemetry. In the Submit dialog, click OK.
Click Open the Managed Service for OpenTelemetry Console to view tracing data.
For more information about Managed Service for OpenTelemetry, see What is Managed Service for OpenTelemetry?
Set up tracing for ASM earlier than 1.17.2.35
Log on to the ASM console. In the left-side navigation pane, choose Service Mesh > Mesh Management.
On the Mesh Management page, click your ASM instance name. In the left-side navigation pane, choose ASM Instance > Base Information.
On the Base Information page, click Settings. In the Settings Update panel:
Select Enable Tracing Analysis.
Set Sampling Percentage to your desired value.
Select Enable Managed Service for OpenTelemetry for Sampling Method.
Click OK.
In the left-side navigation pane, choose Observability Management Center > Tracing Analysis to view tracing data in the Managed Service for OpenTelemetry console.
For more information about Managed Service for OpenTelemetry, see What is Managed Service for OpenTelemetry?