All Products
Search
Document Center

Alibaba Cloud Service Mesh:Use AverageLatencySchedulingPolicy to implement priority-based request scheduling

Last Updated:Jun 22, 2026

The traffic scheduling suite of Service Mesh (ASM) supports priority-based request scheduling policies. When the system is overloaded, high-priority requests are processed first. You can use AverageLatencySchedulingPolicy to prioritize requests based on configurable priority levels.

Background information

A priority-based request scheduling policy compares real-time latency with the historical average to detect traffic overload, then uses token bucket and priority mechanisms to schedule requests. The workflow is as follows:

  1. Overload detection: This policy compares the average latency in the past period with the current latency to determine whether the system is overloaded.

  2. Adjustment of the token issuance rate: If an overload occurs, the monitoring data obtained in the previous step is sent to a dedicated controller, which will control the fill rate of the token bucket.

  3. Request scheduling: Different requests have different priorities. When an overload occurs, requests with higher priorities have a greater chance of obtaining tokens.

This policy queues requests when services are congested due to high concurrency and rising response latencies. Unlike standard throttling policies that directly reject requests, this policy places them in a priority queue. The token bucket mechanism limits the request rate, and request processing order is adjusted based on priority levels.

Prerequisites

Step 1: Create AverageLatencySchedulingPolicy

  1. Use kubectl to connect to the ASM instance. For more information, see Access Istio resources with kubectl.

  2. Create an AverageLatencySchedulingPolicy.yaml file that contains the following content:

    apiVersion: istio.alibabacloud.com/v1
    kind: AverageLatencySchedulingPolicy
    metadata:
      name: workload-prioritization
      namespace: istio-system
    spec:
      load_scheduling_core:
        aimd_load_scheduler:
          load_scheduler:
            workload_latency_based_tokens: true
            selectors:
              - service: httpbin.default.svc.cluster.local
            scheduler:
              workloads:
                - label_matcher:
                    match_labels:
                      http.request.header.user_type: "guest"
                  parameters:
                    priority: 50.0
                  name: "guest"
                - label_matcher:
                    match_labels:
                      http.request.header.user_type: "subscriber"
                  parameters:
                    priority: 200.0
                  name: "subscriber"
                  

    The following table describes some of the fields.

    Field

    Description

    workload_latency_based_tokens

    Indicates whether to dynamically adjust the number of tokens based on the average latency of the workload. The time window for estimating the average latency is the last 30 minutes.

    service

    The service on which the scheduling policy takes effect.

    workloads

    Two types of requests are defined based on user_type in the request headers: guest and subscriber. The priority of a request of the guest type is 50, and that of a request of the subscriber type is 200.

    For more information about the fields supported by AverageLatencySchedulingPolicy, see AverageLatencySchedulingPolicy field reference.

Step 2: Perform tests

In this example, the load testing tool fortio is used. For more information, see Install fortio.

First, simulate normal service requests to establish a baseline average latency:

fortio load -c 20 -qps 100000 -t 60m http://${IP address of the ASM gateway}/status/200

Three minutes after running the preceding command, open two new terminals and send test requests. Keep the fortio process running throughout the test and do not close its terminal.

In the two terminals, run the following load testing commands. Start both tests at the same time.

fortio load -c 40 -qps 100000  -H "user_type:guest" -t 3m http://${IP address of the ASM gateway}/status/201
fortio load -c 40 -qps 100000  -H "user_type:subscriber" -t 3m http://${IP address of the ASM gateway}/status/202

The two commands use different request paths so that you can distinguish the test results in access logs.

Step 3: Analyze the test results

The following code blocks show the last few lines of the test output in the current environment:

Code 201 : 26852 (97.8 %)
Code 503 : 601 (2.2 %)
Response Header Sizes : count 27453 avg 242.91564 +/- 36.35 min 0 max 249 sum 6668763
Response Body/Total Sizes : count 27453 avg 246.17754 +/- 14.56 min 149 max 249 sum 6758312
All done 27453 calls (plus 40 warmup) 262.318 ms avg, 152.4 qps
Code 202 : 52765 (100.0 %)
Response Header Sizes : count 52765 avg 248.86358 +/- 0.5951 min 248 max 250 sum 13131287
Response Body/Total Sizes : count 52765 avg 248.86358 +/- 0.5951 min 248 max 250 sum 13131287
All done 52765 calls (plus 40 warmup) 136.472 ms avg, 292.9 qps

The results indicate that:

  • All subscriber requests succeeded with no HTTP 503 errors, while 2.2% of guest requests returned HTTP 503.

  • The average latency for subscriber requests was about 136 ms, compared to about 262 ms for guest requests. The queries per second (QPS) also differed significantly between the two user types.

This confirms that AverageLatencySchedulingPolicy prioritizes subscriber requests when latency increases.

Important

The test results in this topic are for reference only. Actual data depends on your environment. Only the relative differences between the data points are analyzed here.

(Optional) Step 4: Analyze the test results based on the access logs of the ASM gateway

  1. Log on to the ASM console. In the left-side navigation pane, choose Service Mesh > Mesh Management.

  2. On the Mesh Management page, click the name of the ASM instance. In the left-side navigation pane, choose ASM Gateways > Ingress Gateway.

  3. Click the name of the ASM gateway to go to the Gateway overview page. Then, click Gateway Logs to view the access logs of the ASM gateway.

  4. The access paths of the guest and subscriber users are different. You can use the access paths to retrieve the access results of the two users respectively:

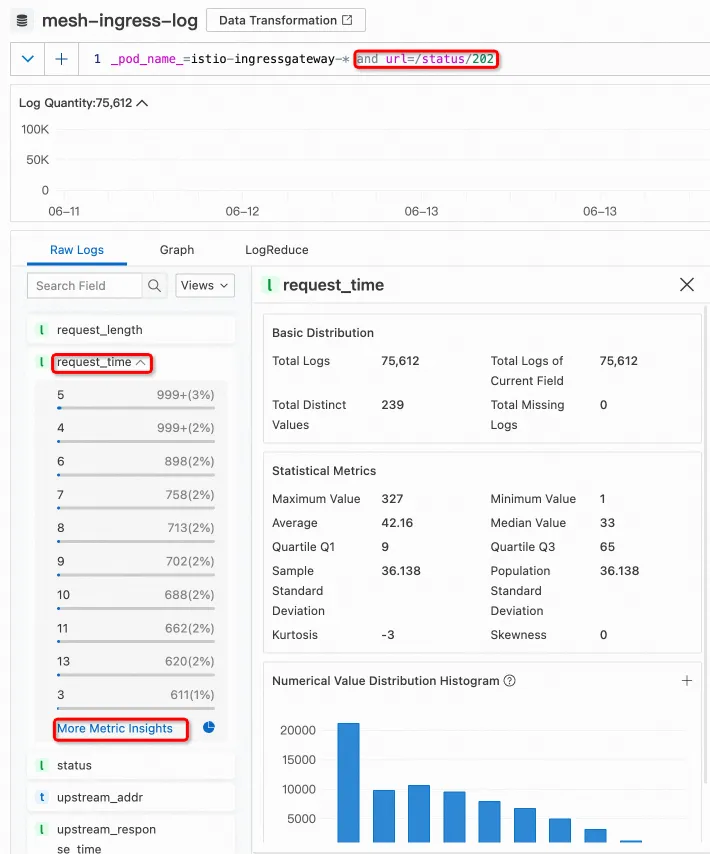
image.png

image.png

References

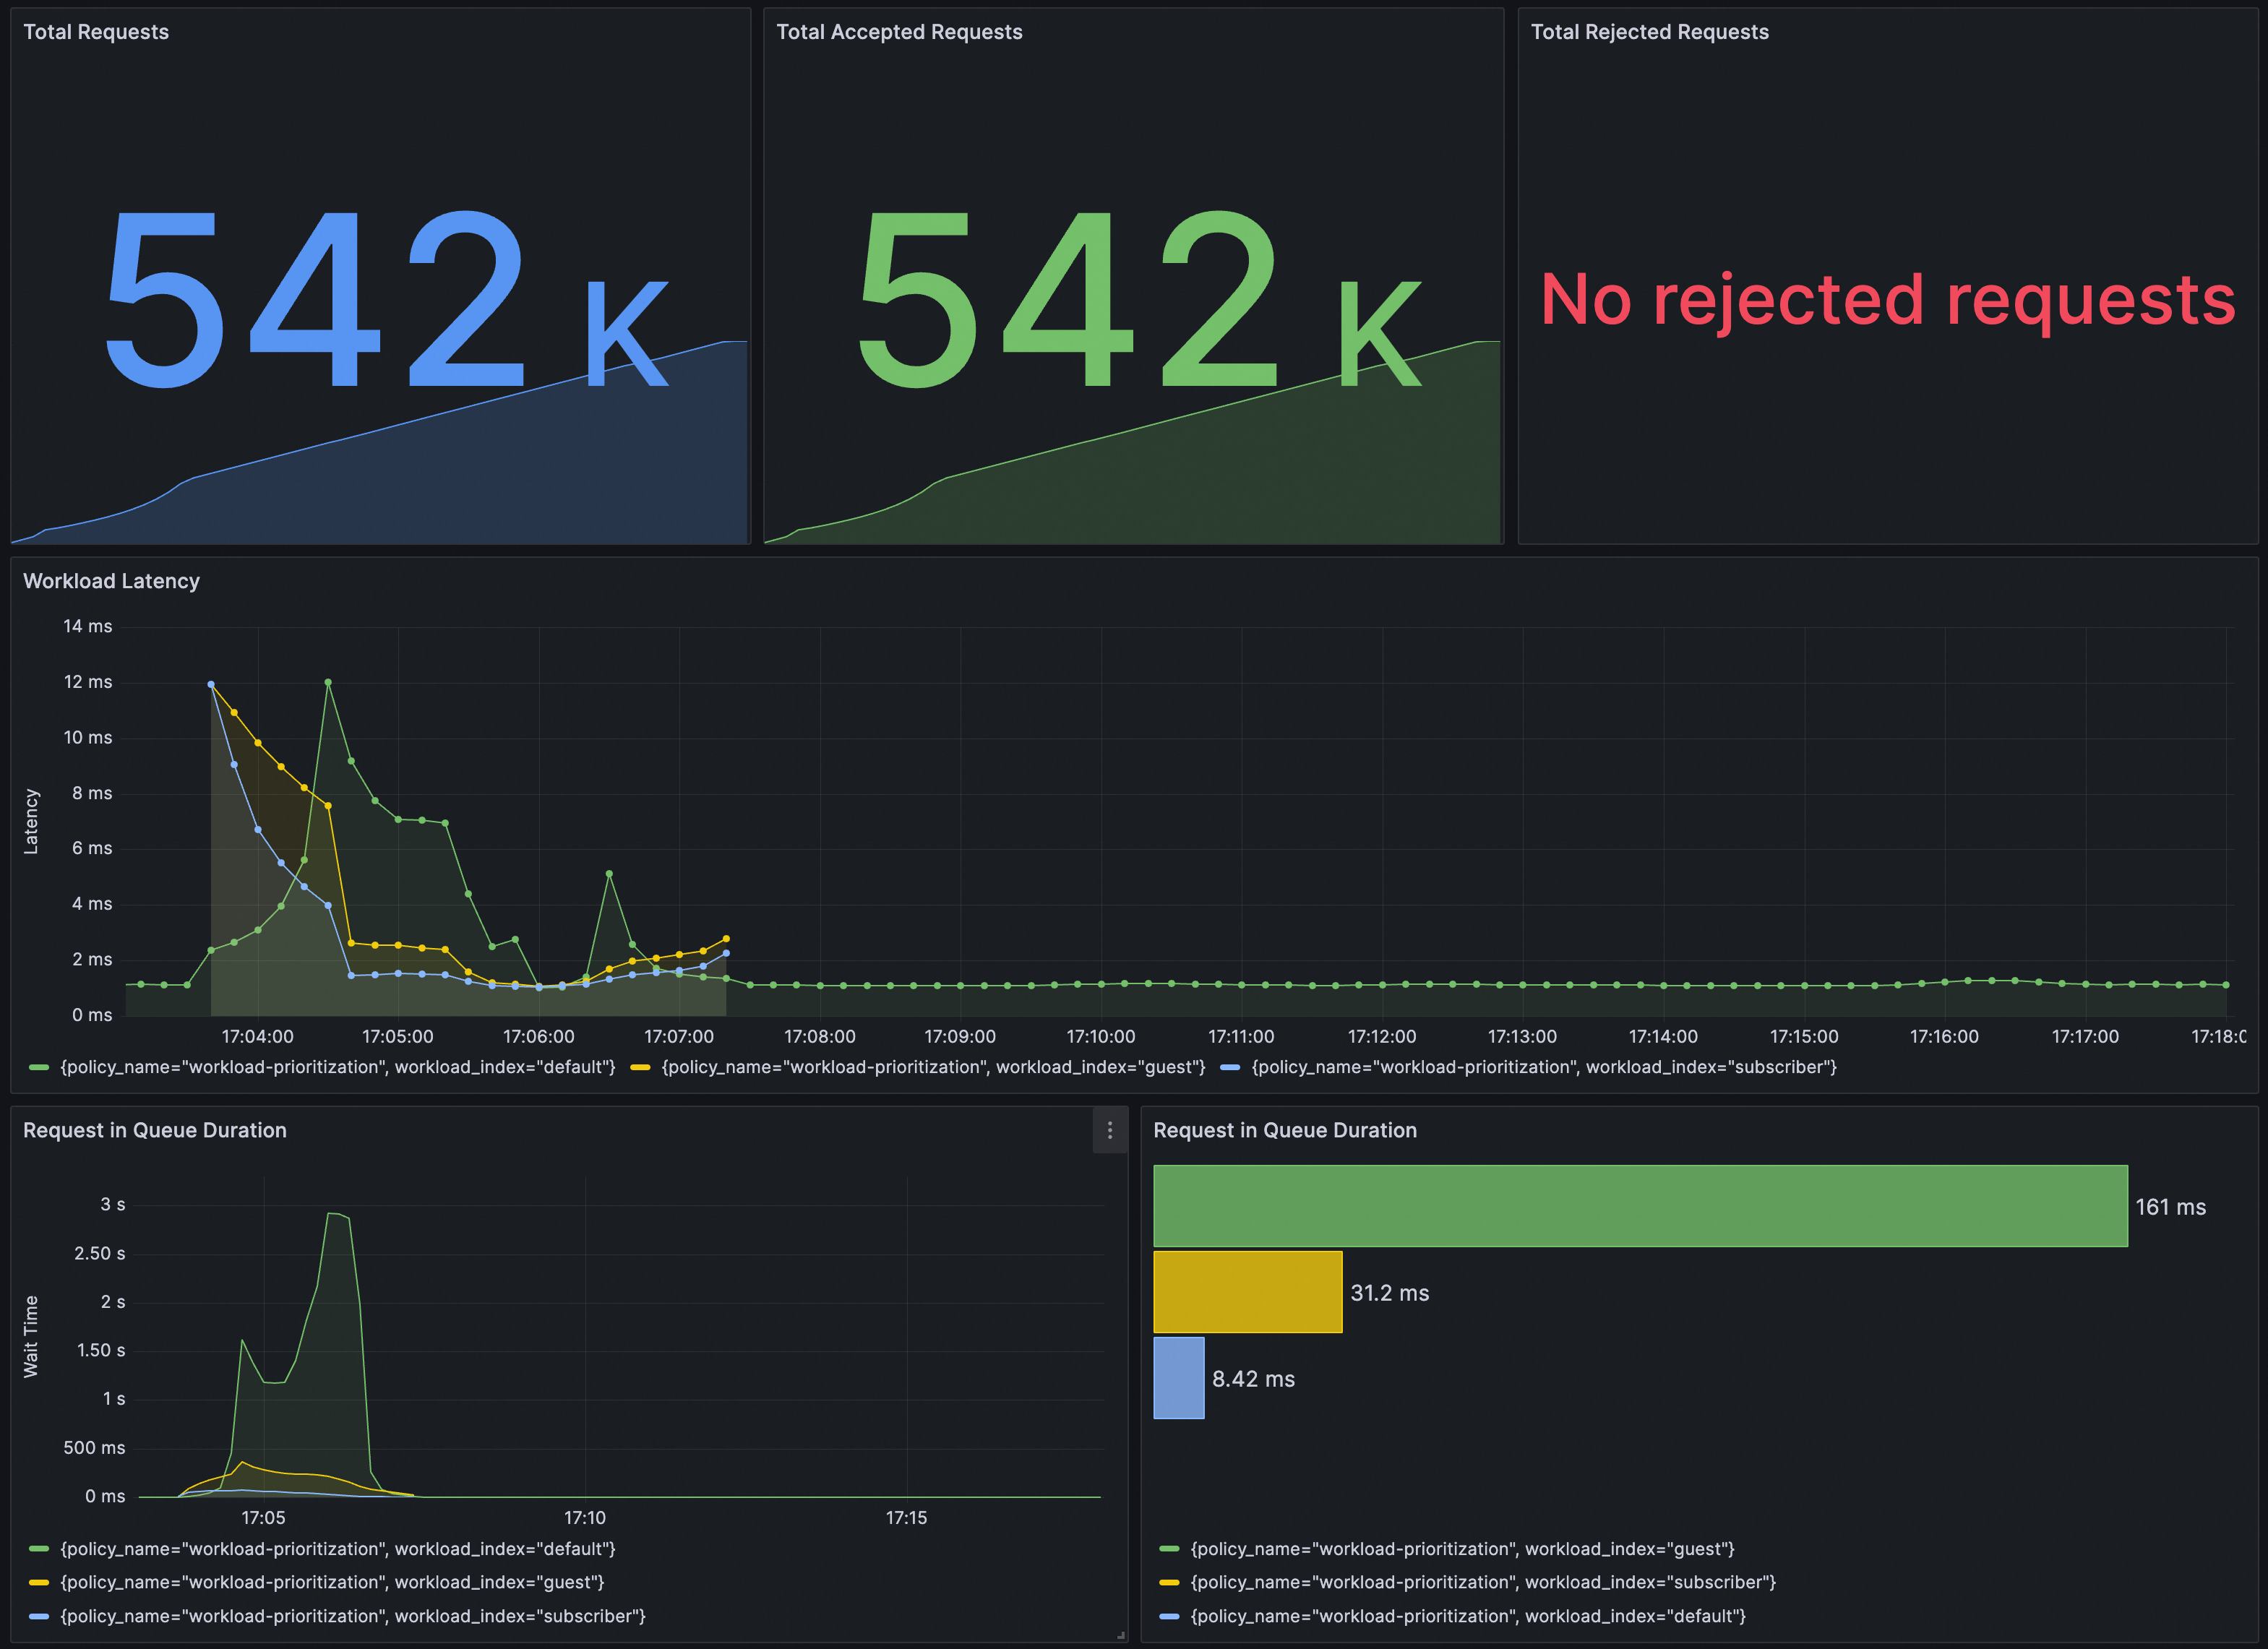
You can verify whether AverageLatencySchedulingPolicy takes effect in Grafana. Make sure the Prometheus instance for Grafana is configured with the ASM traffic scheduling suite.

Import the following content into Grafana to create a dashboard for AverageLatencySchedulingPolicy.

Click to view details

{
  "annotations": {
    "list": [
      {
        "builtIn": 1,
        "datasource": {
          "type": "grafana",
          "uid": "-- Grafana --"
        },
        "enable": true,
        "hide": true,
        "iconColor": "rgba(0, 211, 255, 1)",
        "name": "Annotations & Alerts",
        "type": "dashboard"
      }
    ]
  },
  "editable": true,
  "fiscalYearStartMonth": 0,
  "graphTooltip": 0,
  "id": 40,
  "links": [],
  "liveNow": false,
  "panels": [
    {
      "datasource": {
        "type": "prometheus",
        "uid": "${datasource}"
      },
      "description": "",
      "fieldConfig": {
        "defaults": {
          "color": {
            "mode": "palette-classic"
          },
          "custom": {
            "axisCenteredZero": false,
            "axisColorMode": "text",
            "axisLabel": "Decisions",
            "axisPlacement": "auto",
            "barAlignment": 0,
            "drawStyle": "line",
            "fillOpacity": 10,
            "gradientMode": "none",
            "hideFrom": {
              "legend": false,
              "tooltip": false,
              "viz": false
            },
            "lineInterpolation": "linear",
            "lineWidth": 1,
            "pointSize": 5,
            "scaleDistribution": {
              "type": "linear"
            },
            "showPoints": "auto",
            "spanNulls": false,
            "stacking": {
              "group": "A",
              "mode": "none"
            },
            "thresholdsStyle": {
              "mode": "off"
            }
          },
          "mappings": [],
          "thresholds": {
            "mode": "absolute",
            "steps": [
              {
                "color": "green",
                "value": null
              },
              {
                "color": "red",
                "value": 80
              }
            ]
          },
          "unit": "reqps"
        },
        "overrides": []
      },
      "gridPos": {
        "h": 10,
        "w": 24,
        "x": 0,
        "y": 0
      },
      "id": 1,
      "interval": "10s",
      "options": {
        "legend": {
          "calcs": [],
          "displayMode": "list",
          "placement": "bottom",
          "showLegend": true
        },
        "tooltip": {
          "mode": "single",
          "sort": "none"
        }
      },
      "pluginVersion": "v10.1.0",
      "targets": [
        {
          "datasource": {
            "type": "prometheus",
            "uid": "${datasource}"
          },
          "editorMode": "code",
          "expr": "sum by(decision_type, policy_name) (rate(workload_requests_total{component_id=\"root.0.4\"}[$__rate_interval]))",
          "intervalFactor": 1,
          "range": true,
          "refId": "A"
        }
      ],
      "title": "Workload Decisions",
      "type": "timeseries"
    },
    {
      "datasource": {
        "type": "prometheus",
        "uid": "${datasource}"
      },
      "description": "",
      "fieldConfig": {
        "defaults": {
          "color": {
            "mode": "palette-classic"
          },
          "custom": {
            "axisCenteredZero": false,
            "axisColorMode": "text",
            "axisLabel": "Decisions",
            "axisPlacement": "auto",
            "barAlignment": 0,
            "drawStyle": "line",
            "fillOpacity": 10,
            "gradientMode": "none",
            "hideFrom": {
              "legend": false,
              "tooltip": false,
              "viz": false
            },
            "lineInterpolation": "linear",
            "lineWidth": 1,
            "pointSize": 5,
            "scaleDistribution": {
              "type": "linear"
            },
            "showPoints": "auto",
            "spanNulls": false,
            "stacking": {
              "group": "A",
              "mode": "none"
            },
            "thresholdsStyle": {
              "mode": "off"
            }
          },
          "mappings": [],
          "thresholds": {
            "mode": "absolute",
            "steps": [
              {
                "color": "green",
                "value": null
              },
              {
                "color": "red",
                "value": 80
              }
            ]
          },
          "unit": "reqps"
        },
        "overrides": []
      },
      "gridPos": {
        "h": 10,
        "w": 24,
        "x": 0,
        "y": 10
      },
      "id": 2,
      "interval": "10s",
      "options": {
        "legend": {
          "calcs": [],
          "displayMode": "list",
          "placement": "bottom",
          "showLegend": true
        },
        "tooltip": {
          "mode": "single",
          "sort": "none"
        }
      },
      "pluginVersion": "v10.1.0",
      "targets": [
        {
          "datasource": {
            "type": "prometheus",
            "uid": "${datasource}"
          },
          "editorMode": "code",
          "expr": "sum by(workload_index, decision_type, policy_name) (rate(workload_requests_total{component_id=\"root.0.4\",decision_type=\"DECISION_TYPE_ACCEPTED\"}[$__rate_interval]))",
          "intervalFactor": 1,
          "range": true,
          "refId": "A"
        }
      ],
      "title": "Workload Decisions (accepted)",
      "type": "timeseries"
    },
    {
      "datasource": {
        "type": "prometheus",
        "uid": "${datasource}"
      },
      "description": "",
      "fieldConfig": {
        "defaults": {
          "color": {
            "mode": "palette-classic"
          },
          "custom": {
            "axisCenteredZero": false,
            "axisColorMode": "text",
            "axisLabel": "Decisions",
            "axisPlacement": "auto",
            "barAlignment": 0,
            "drawStyle": "line",
            "fillOpacity": 10,
            "gradientMode": "none",
            "hideFrom": {
              "legend": false,
              "tooltip": false,
              "viz": false
            },
            "lineInterpolation": "linear",
            "lineWidth": 1,
            "pointSize": 5,
            "scaleDistribution": {
              "type": "linear"
            },
            "showPoints": "auto",
            "spanNulls": false,
            "stacking": {
              "group": "A",
              "mode": "none"
            },
            "thresholdsStyle": {
              "mode": "off"
            }
          },
          "mappings": [],
          "thresholds": {
            "mode": "absolute",
            "steps": [
              {
                "color": "green",
                "value": null
              },
              {
                "color": "red",
                "value": 80
              }
            ]
          },
          "unit": "reqps"
        },
        "overrides": []
      },
      "gridPos": {
        "h": 10,
        "w": 24,
        "x": 0,
        "y": 20
      },
      "id": 3,
      "interval": "10s",
      "options": {
        "legend": {
          "calcs": [],
          "displayMode": "list",
          "placement": "bottom",
          "showLegend": true
        },
        "tooltip": {
          "mode": "single",
          "sort": "none"
        }
      },
      "pluginVersion": "v10.1.0",
      "targets": [
        {
          "datasource": {
            "type": "prometheus",
            "uid": "${datasource}"
          },
          "editorMode": "code",
          "expr": "sum by(workload_index, decision_type, policy_name) (rate(workload_requests_total{component_id=\"root.0.4\",decision_type=\"DECISION_TYPE_REJECTED\"}[$__rate_interval]))",
          "intervalFactor": 1,
          "range": true,
          "refId": "A"
        }
      ],
      "title": "Workload Decisions (rejected)",
      "type": "timeseries"
    },
    {
      "datasource": {
        "type": "prometheus",
        "uid": "${datasource}"
      },
      "fieldConfig": {
        "defaults": {
          "color": {
            "mode": "thresholds"
          },
          "mappings": [],
          "noValue": "No data",
          "thresholds": {
            "mode": "absolute",
            "steps": [
              {
                "color": "blue",
                "value": null
              }
            ]
          },
          "unit": "short"
        },
        "overrides": []
      },
      "gridPos": {
        "h": 10,
        "w": 8,
        "x": 0,
        "y": 30
      },
      "id": 4,
      "options": {
        "colorMode": "value",
        "graphMode": "area",
        "justifyMode": "center",
        "orientation": "horizontal",
        "reduceOptions": {
          "calcs": [
            "lastNotNull"
          ],
          "fields": "",
          "values": false
        },
        "textMode": "auto"
      },
      "pluginVersion": "10.0.9",
      "targets": [
        {
          "datasource": {
            "type": "prometheus",
            "uid": "${datasource}"
          },
          "editorMode": "code",
          "expr": "sum by (policy_name) (increase(workload_requests_total{component_id=\"root.0.4\"}[$__range]))",
          "instant": false,
          "intervalFactor": 1,
          "legendFormat": "{{ instance }} - {{ policy_name }}",
          "range": true,
          "refId": "A"
        }
      ],
      "title": "Total Requests",
      "type": "stat"
    },
    {
      "datasource": {
        "type": "prometheus",
        "uid": "${datasource}"
      },
      "fieldConfig": {
        "defaults": {
          "color": {
            "mode": "thresholds"
          },
          "mappings": [],
          "noValue": "No data",
          "thresholds": {
            "mode": "absolute",
            "steps": [
              {
                "color": "green",
                "value": null
              }
            ]
          },
          "unit": "short"
        },
        "overrides": []
      },
      "gridPos": {
        "h": 10,
        "w": 8,
        "x": 8,
        "y": 30
      },
      "id": 5,
      "options": {
        "colorMode": "value",
        "graphMode": "area",
        "justifyMode": "center",
        "orientation": "horizontal",
        "reduceOptions": {
          "calcs": [
            "lastNotNull"
          ],
          "fields": "",
          "values": false
        },
        "textMode": "auto"
      },
      "pluginVersion": "10.0.9",
      "targets": [
        {
          "datasource": {
            "type": "prometheus",
            "uid": "${datasource}"
          },
          "editorMode": "code",
          "expr": "sum by (policy_name)(increase(workload_requests_total{component_id=\"root.0.4\", decision_type=\"DECISION_TYPE_ACCEPTED\"}[$__range]))",
          "instant": false,
          "intervalFactor": 1,
          "legendFormat": "{{ instance }} - {{ policy_name }}",
          "range": true,
          "refId": "A"
        }
      ],
      "title": "Total Accepted Requests",
      "type": "stat"
    },
    {
      "datasource": {
        "type": "prometheus",
        "uid": "${datasource}"
      },
      "fieldConfig": {
        "defaults": {
          "color": {
            "mode": "thresholds"
          },
          "mappings": [],
          "noValue": "No rejected requests",
          "thresholds": {
            "mode": "absolute",
            "steps": [
              {
                "color": "red",
                "value": null
              }
            ]
          },
          "unit": "short"
        },
        "overrides": []
      },
      "gridPos": {
        "h": 10,
        "w": 8,
        "x": 16,
        "y": 30
      },
      "id": 6,
      "options": {
        "colorMode": "value",
        "graphMode": "area",
        "justifyMode": "center",
        "orientation": "horizontal",
        "reduceOptions": {
          "calcs": [
            "lastNotNull"
          ],
          "fields": "",
          "values": false
        },
        "textMode": "auto"
      },
      "pluginVersion": "10.0.9",
      "targets": [
        {
          "datasource": {
            "type": "prometheus",
            "uid": "${datasource}"
          },
          "editorMode": "code",
          "expr": "sum by (policy_name) (increase(workload_requests_total{component_id=\"root.0.4\", decision_type=\"DECISION_TYPE_REJECTED\"}[$__range]))",
          "instant": false,
          "intervalFactor": 1,
          "legendFormat": "{{ instance }} - {{ policy_name }}",
          "range": true,
          "refId": "A"
        }
      ],
      "title": "Total Rejected Requests",
      "type": "stat"
    },
    {
      "datasource": {
        "type": "prometheus",
        "uid": "${datasource}"
      },
      "description": "",
      "fieldConfig": {
        "defaults": {
          "color": {
            "mode": "palette-classic"
          },
          "custom": {
            "axisCenteredZero": false,
            "axisColorMode": "text",
            "axisLabel": "Latency",
            "axisPlacement": "auto",
            "barAlignment": 0,
            "drawStyle": "line",
            "fillOpacity": 10,
            "gradientMode": "none",
            "hideFrom": {
              "legend": false,
              "tooltip": false,
              "viz": false
            },
            "lineInterpolation": "linear",
            "lineWidth": 1,
            "pointSize": 5,
            "scaleDistribution": {
              "type": "linear"
            },
            "showPoints": "auto",
            "spanNulls": false,
            "stacking": {
              "group": "A",
              "mode": "none"
            },
            "thresholdsStyle": {
              "mode": "off"
            }
          },
          "mappings": [],
          "thresholds": {
            "mode": "absolute",
            "steps": [
              {
                "color": "green",
                "value": null
              },
              {
                "color": "red",
                "value": 80
              }
            ]
          },
          "unit": "ms"
        },
        "overrides": []
      },
      "gridPos": {
        "h": 10,
        "w": 24,
        "x": 0,
        "y": 40
      },
      "id": 7,
      "interval": "10s",
      "options": {
        "legend": {
          "calcs": [],
          "displayMode": "list",
          "placement": "bottom",
          "showLegend": true
        },
        "tooltip": {
          "mode": "single",
          "sort": "none"
        }
      },
      "pluginVersion": "v10.1.0",
      "targets": [
        {
          "datasource": {
            "type": "prometheus",
            "uid": "${datasource}"
          },
          "editorMode": "code",
          "expr": "(sum by (workload_index, policy_name) (increase(workload_latency_ms_sum{component_id=\"root.0.4\"}[$__rate_interval])))/(sum by (workload_index, policy_name) (increase(workload_latency_ms_count{component_id=\"root.0.4\"}[$__rate_interval])))",
          "intervalFactor": 1,
          "range": true,
          "refId": "A"
        }
      ],
      "title": "Workload Latency",
      "type": "timeseries"
    },
    {
      "datasource": {
        "type": "prometheus",
        "uid": "${datasource}"
      },
      "description": "",
      "fieldConfig": {
        "defaults": {
          "color": {
            "mode": "palette-classic"
          },
          "custom": {
            "axisCenteredZero": false,
            "axisColorMode": "text",
            "axisLabel": "Wait Time",
            "axisPlacement": "auto",
            "barAlignment": 0,
            "drawStyle": "line",
            "fillOpacity": 10,
            "gradientMode": "none",
            "hideFrom": {
              "legend": false,
              "tooltip": false,
              "viz": false
            },
            "lineInterpolation": "linear",
            "lineWidth": 1,
            "pointSize": 5,
            "scaleDistribution": {
              "type": "linear"
            },
            "showPoints": "auto",
            "spanNulls": false,
            "stacking": {
              "group": "A",
              "mode": "none"
            },
            "thresholdsStyle": {
              "mode": "off"
            }
          },
          "mappings": [],
          "thresholds": {
            "mode": "absolute",
            "steps": [
              {
                "color": "green",
                "value": null
              },
              {
                "color": "red",
                "value": 80
              }
            ]
          },
          "unit": "ms"
        },
        "overrides": []
      },
      "gridPos": {
        "h": 10,
        "w": 12,
        "x": 0,
        "y": 50
      },
      "id": 8,
      "interval": "10s",
      "options": {
        "legend": {
          "calcs": [],
          "displayMode": "list",
          "placement": "bottom",
          "showLegend": true
        },
        "tooltip": {
          "mode": "single",
          "sort": "none"
        }
      },
      "pluginVersion": "v10.1.0",
      "targets": [
        {
          "datasource": {
            "type": "prometheus",
            "uid": "${datasource}"
          },
          "editorMode": "code",
          "expr": "(sum by (workload_index, policy_name) (increase(request_in_queue_duration_ms_sum{component_id=\"root.0.4\"}[$__rate_interval])))/ ((sum by (workload_index, policy_name) (increase(request_in_queue_duration_ms_count{component_id=\"root.0.4\"}[$__rate_interval]))) != 0)",
          "intervalFactor": 1,
          "range": true,
          "refId": "A"
        }
      ],
      "title": "Request in Queue Duration",
      "type": "timeseries"
    },
    {
      "datasource": {
        "type": "prometheus",
        "uid": "${datasource}"
      },
      "fieldConfig": {
        "defaults": {
          "color": {
            "mode": "palette-classic"
          },
          "custom": {
            "axisCenteredZero": false,
            "axisColorMode": "text",
            "axisGridShow": true,
            "axisLabel": "",
            "axisPlacement": "hidden",
            "fillOpacity": 80,
            "gradientMode": "none",
            "hideFrom": {
              "legend": false,
              "tooltip": false,
              "viz": false
            },
            "lineWidth": 1,
            "scaleDistribution": {
              "type": "linear"
            },
            "thresholdsStyle": {
              "mode": "off"
            }
          },
          "mappings": [],
          "thresholds": {
            "mode": "absolute",
            "steps": [
              {
                "color": "green",
                "value": null
              },
              {
                "color": "red",
                "value": 80
              }
            ]
          },
          "unit": "ms"
        },
        "overrides": []
      },
      "gridPos": {
        "h": 10,
        "w": 12,
        "x": 12,
        "y": 50
      },
      "id": 9,
      "options": {
        "barRadius": 0,
        "barWidth": 0.97,
        "colorByField": "",
        "fullHighlight": false,
        "groupWidth": 0.7,
        "legend": {
          "calcs": [],
          "displayMode": "list",
          "placement": "bottom",
          "showLegend": true
        },
        "orientation": "horizontal",
        "showValue": "auto",
        "stacking": "none",
        "tooltip": {
          "mode": "single",
          "sort": "sort"
        },
        "xTickLabelRotation": 0,
        "xTickLabelSpacing": 0
      },
      "pluginVersion": "v10.1.0",
      "targets": [
        {
          "datasource": {
            "type": "prometheus",
            "uid": "${datasource}"
          },
          "editorMode": "code",
          "expr": "topk(10, (sum by(workload_index, policy_name) (increase(request_in_queue_duration_ms_sum{component_id=\"root.0.4\"}[$__range])) ) / ((sum by(workload_index, policy_name) (increase(request_in_queue_duration_ms_count{component_id=\"root.0.4\"}[$__range])) )) != 0)",
          "format": "time_series",
          "instant": true,
          "intervalFactor": 1,
          "legendFormat": "",
          "range": false,
          "refId": "A"
        }
      ],
      "title": "Request in Queue Duration",
      "type": "barchart"
    },
    {
      "datasource": {
        "type": "prometheus",
        "uid": "${datasource}"
      },
      "description": "",
      "fieldConfig": {
        "defaults": {
          "color": {
            "mode": "palette-classic"
          },
          "custom": {
            "axisCenteredZero": false,
            "axisColorMode": "text",
            "axisLabel": "Token Rate",
            "axisPlacement": "auto",
            "barAlignment": 0,
            "drawStyle": "line",
            "fillOpacity": 10,
            "gradientMode": "none",
            "hideFrom": {
              "legend": false,
              "tooltip": false,
              "viz": false
            },
            "lineInterpolation": "linear",
            "lineWidth": 1,
            "pointSize": 5,
            "scaleDistribution": {
              "type": "linear"
            },
            "showPoints": "auto",
            "spanNulls": false,
            "stacking": {
              "group": "A",
              "mode": "none"
            },
            "thresholdsStyle": {
              "mode": "off"
            }
          },
          "mappings": [],
          "thresholds": {
            "mode": "absolute",
            "steps": [
              {
                "color": "green",
                "value": null
              },
              {
                "color": "red",
                "value": 80
              }
            ]
          },
          "unit": ""
        },
        "overrides": []
      },
      "gridPos": {
        "h": 8,
        "w": 12,
        "x": 0,
        "y": 60
      },
      "id": 12,
      "interval": "10s",
      "options": {
        "legend": {
          "calcs": [],
          "displayMode": "list",
          "placement": "bottom",
          "showLegend": true
        },
        "tooltip": {
          "mode": "single",
          "sort": "none"
        }
      },
      "pluginVersion": "v10.1.0",
      "targets": [
        {
          "datasource": {
            "type": "prometheus",
            "uid": "${datasource}"
          },
          "editorMode": "code",
          "expr": "sum by (policy_name) (rate(incoming_tokens_total{component_id=\"root.0.4\"}[$__rate_interval]))",
          "intervalFactor": 1,
          "range": true,
          "refId": "A"
        }
      ],
      "title": "Incoming Token Rate",
      "type": "timeseries"
    },
    {
      "datasource": {
        "type": "prometheus",
        "uid": "${datasource}"
      },
      "description": "",
      "fieldConfig": {
        "defaults": {
          "color": {
            "mode": "palette-classic"
          },
          "custom": {
            "axisCenteredZero": false,
            "axisColorMode": "text",
            "axisLabel": "Token Rate",
            "axisPlacement": "auto",
            "barAlignment": 0,
            "drawStyle": "line",
            "fillOpacity": 10,
            "gradientMode": "none",
            "hideFrom": {
              "legend": false,
              "tooltip": false,
              "viz": false
            },
            "lineInterpolation": "linear",
            "lineWidth": 1,
            "pointSize": 5,
            "scaleDistribution": {
              "type": "linear"
            },
            "showPoints": "auto",
            "spanNulls": false,
            "stacking": {
              "group": "A",
              "mode": "none"
            },
            "thresholdsStyle": {
              "mode": "off"
            }
          },
          "mappings": [],
          "thresholds": {
            "mode": "absolute",
            "steps": [
              {
                "color": "green",
                "value": null
              },
              {
                "color": "red",
                "value": 80
              }
            ]
          },
          "unit": ""
        },
        "overrides": []
      },
      "gridPos": {
        "h": 8,
        "w": 12,
        "x": 12,
        "y": 60
      },
      "id": 13,
      "interval": "10s",
      "options": {
        "legend": {
          "calcs": [],
          "displayMode": "list",
          "placement": "bottom",
          "showLegend": true
        },
        "tooltip": {
          "mode": "single",
          "sort": "none"
        }
      },
      "pluginVersion": "v10.1.0",
      "targets": [
        {
          "datasource": {
            "type": "prometheus",
            "uid": "${datasource}"
          },
          "editorMode": "code",
          "expr": "sum by (policy_name) (rate(accepted_tokens_total{component_id=\"root.0.4\"}[$__rate_interval]))",
          "intervalFactor": 1,
          "legendFormat": "Accepted Token Rate",
          "range": true,
          "refId": "A"
        },
        {
          "datasource": {
            "type": "prometheus",
            "uid": "${datasource}"
          },
          "expr": "sum(rate(rejected_tokens_total{component_id=\"root.0.4\",policy_name=\"workload-prioritization\"}[$__rate_interval]))",
          "intervalFactor": 1,
          "legendFormat": "Rejected Token Rate",
          "refId": "B"
        }
      ],
      "title": "Accepted Token Rate vs Rejected Token Rate",
      "type": "timeseries"
    },
    {
      "datasource": {
        "type": "prometheus",
        "uid": "${datasource}"
      },
      "fieldConfig": {
        "defaults": {
          "color": {
            "mode": "thresholds"
          },
          "mappings": [],
          "noValue": "No data",
          "thresholds": {
            "mode": "absolute",
            "steps": [
              {
                "color": "blue",
                "value": null
              }
            ]
          },
          "unit": "short"
        },
        "overrides": []
      },
      "gridPos": {
        "h": 10,
        "w": 8,
        "x": 0,
        "y": 68
      },
      "id": 14,
      "options": {
        "colorMode": "value",
        "graphMode": "area",
        "justifyMode": "center",
        "orientation": "horizontal",
        "reduceOptions": {
          "calcs": [
            "lastNotNull"
          ],
          "fields": "",
          "values": false
        },
        "textMode": "auto"
      },
      "pluginVersion": "10.0.9",
      "targets": [
        {
          "datasource": {
            "type": "prometheus",
            "uid": "${datasource}"
          },
          "editorMode": "code",
          "expr": "sum by (policy_name) (increase(incoming_tokens_total{component_id=\"root.0.4\"}[$__range]))",
          "instant": false,
          "intervalFactor": 1,
          "legendFormat": "{{ instance }} - {{ policy_name }}",
          "range": true,
          "refId": "A"
        }
      ],
      "title": "Total Incoming Tokens",
      "type": "stat"
    },
    {
      "datasource": {
        "type": "prometheus",
        "uid": "${datasource}"
      },
      "fieldConfig": {
        "defaults": {
          "color": {
            "mode": "thresholds"
          },
          "mappings": [],
          "noValue": "No data",
          "thresholds": {
            "mode": "absolute",
            "steps": [
              {
                "color": "green",
                "value": null
              }
            ]
          },
          "unit": "short"
        },
        "overrides": []
      },
      "gridPos": {
        "h": 10,
        "w": 8,
        "x": 8,
        "y": 68
      },
      "id": 15,
      "options": {
        "colorMode": "value",
        "graphMode": "area",
        "justifyMode": "center",
        "orientation": "horizontal",
        "reduceOptions": {
          "calcs": [
            "lastNotNull"
          ],
          "fields": "",
          "values": false
        },
        "textMode": "auto"
      },
      "pluginVersion": "10.0.9",
      "targets": [
        {
          "datasource": {
            "type": "prometheus",
            "uid": "${datasource}"
          },
          "editorMode": "code",
          "expr": "sum by (policy_name) (increase(accepted_tokens_total{component_id=\"root.0.4\"}[$__range]))",
          "instant": false,
          "intervalFactor": 1,
          "legendFormat": "{{ instance }} - {{ policy_name }}",
          "range": true,
          "refId": "A"
        }
      ],
      "title": "Total Accepted Tokens",
      "type": "stat"
    },
    {
      "datasource": {
        "type": "prometheus",
        "uid": "${datasource}"
      },
      "fieldConfig": {
        "defaults": {
          "color": {
            "mode": "thresholds"
          },
          "mappings": [],
          "noValue": "No data",
          "thresholds": {
            "mode": "absolute",
            "steps": [
              {
                "color": "red",
                "value": null
              }
            ]
          },
          "unit": "short"
        },
        "overrides": []
      },
      "gridPos": {
        "h": 10,
        "w": 8,
        "x": 16,
        "y": 68
      },
      "id": 16,
      "options": {
        "colorMode": "value",
        "graphMode": "area",
        "justifyMode": "center",
        "orientation": "horizontal",
        "reduceOptions": {
          "calcs": [
            "lastNotNull"
          ],
          "fields": "",
          "values": false
        },
        "textMode": "auto"
      },
      "pluginVersion": "10.0.9",
      "targets": [
        {
          "datasource": {
            "type": "prometheus",
            "uid": "${datasource}"
          },
          "editorMode": "code",
          "expr": "sum by (policy_name) (increase(rejected_tokens_total{component_id=\"root.0.4\"}[$__range]))",
          "instant": false,
          "intervalFactor": 1,
          "legendFormat": "{{ instance }} - {{ policy_name }}",
          "range": true,
          "refId": "A"
        }
      ],
      "title": "Total Rejected Tokens",
      "type": "stat"
    }
  ],
  "refresh": "5s",
  "schemaVersion": 38,
  "style": "dark",
  "tags": [],
  "templating": {
    "list": [
      {
        "hide": 0,
        "includeAll": false,
        "label": "Data Source",
        "multi": false,
        "name": "datasource",
        "options": [],
        "query": "prometheus",
        "refresh": 1,
        "regex": "",
        "skipUrlSync": false,
        "type": "datasource"
      }
    ]
  },
  "time": {
    "from": "now-15m",
    "to": "now"
  },
  "timepicker": {},
  "timezone": "browser",
  "title": "Policy Summary - workload-prioritization",
  "version": 1,
  "weekStart": ""
}

The dashboard is as follows.

image