Managed Service for OpenTelemetry offers developers of distributed applications a comprehensive toolset, including trace visualization, request volume statistics, application topology, and dependency analysis. This topic describes how to use headers to implement gRPC tracing in ASM.
Prerequisites
-
You have created an ASM instance. For more information, see Create an ASM instance.
-
You have activated Managed Service for OpenTelemetry. For information about billing, see Billing.
Sample project
The sample gRPC project is available at hello-servicemesh-grpc. All directories mentioned in this topic are in the hello-servicemesh-grpc repository.
gRPC header programming practices
Retrieve headers on the server
-
Basic methods
-
Java: Retrieve headers on the server.
Implement the
ServerInterceptorinterface'sinterceptCall(ServerCall<ReqT, RespT> call,final Metadata m,ServerCallHandler<ReqT, RespT> h)method. UseString v = m.get(k)to obtain header information. Thegetmethod's parameter type isMetadata.Key<String>. -
Go: Retrieve headers on the server.
metadata.FromIncomingContext(ctx)(md MD, ok bool), where MD is amap[string][]string. -
Node.js: Retrieve headers on the server.
The return type of
call.metadata.getMap()is[key: string]: MetadataValue, and theMetadataValuetype is defined asstring/Buffer. -
Python: Retrieve headers on the server.
context.invocation_metadata()returns an array of 2-tuples of the form('k','v'). Usem.key, m.valueto obtain the key-value pair.
-
-
Unary RPC
-
Java: Retrieve headers for unary RPC.
The method is unaware of headers.
-
Go: Retrieve headers for unary RPC.
In the method, directly call
metadata.FromIncomingContext(ctx). The context parameterctxis from the input parameter of theTalkmethod. -
Node.js: Retrieve headers for unary RPC.
Directly call
call.metadata.getMap()within the method. -
Python: Retrieve headers for unary RPC.
Directly call
context.invocation_metadata()within the method.
-
-
Server streaming RPC
-
Java: Retrieve headers for server streaming RPC.
The method is unaware of headers.
-
Go: Retrieve headers for server streaming RPC.
In the method, directly call
metadata.FromIncomingContext(ctx). The context parameterctxis obtained from thestreaminput parameter ofTalkOneAnswerMoreby callingstream.Context(). -
Node.js: Retrieve headers for server streaming RPC.
Call
call.metadata.getMap()directly within the method. -
Python: Retrieve headers for server streaming RPC.
Directly call
context.invocation_metadata()within the method.
-
-
Client streaming RPC
-
Java: Retrieve headers for client streaming RPC.
The method is unaware of headers.
-
Go: Retrieve headers for client streaming RPC.
In the method, directly call
metadata.FromIncomingContext(ctx). The context parameterctxis obtained by callingstream.Context()on thestreaminput parameter of theTalkMoreAnswerOnemethod. -
Node.js: Retrieve headers for client streaming RPC.
Directly call
call.metadata.getMap()within the method. -
Python: Retrieve headers for client streaming RPC.
Directly call
context.invocation_metadata()within the method.
-
-
Bidirectional streaming RPC
-
Java: Retrieve headers for bidirectional streaming RPC.
The method is unaware of headers.
-
Go: Retrieve headers for bidirectional streaming RPC.
In the method, directly call
metadata.FromIncomingContext(ctx). The context parameterctxis obtained fromstream.Context(), which is called on thestreaminput parameter of theTalkBidirectionalmethod. -
Node.js: Retrieve headers for bidirectional streaming RPC.
Directly call
call.metadata.getMap()within the method. -
Python: Retrieve headers for bidirectional streaming RPC.
Directly call
context.invocation_metadata()in the method.
-
Send headers from the client
-
Basic methods
-
Java: Send headers from the client.
Implement the
ClientInterceptorinterface'sinterceptCall(MethodDescriptor<ReqT, RespT> m,CallOptions o, Channel c)method, and in the returnedClientCall<ReqT,RespT>object, implement thestart((Listener<RespT> l, Metadata h))method. Useh.put(k, v)to add header information. For theputmethod, the parameterkis of typeMetadata.Key<String>, andvis of typeString. -
Go: Send headers from the client.
metadata.AppendToOutgoingContext(ctx,kv ...) context.Context -
Node.js: Send headers from the client.
metadata=call.metadata.getMap()metadata.add(key, headers[key]) -
Python: Send headers from the client.
The
metadata_dict = {}variable is populated withmetadata_dict[c.key] = c.value, and is finally converted to thelist tupletypelist(metadata_dict.items()).
-
-
Unary RPC
-
Java: Send headers for unary RPC.
The method is unaware of headers.
-
Go: Send headers for unary RPC.
In the method, directly call
metadata.AppendToOutgoingContext(ctx,kv). -
Node.js: Send headers for unary RPC.
Use the basic method directly within your RPC method.
-
Python: Send headers for unary RPC.
Use the basic method directly within your RPC method.
-
-
Server streaming RPC
-
Java: Send headers for server streaming RPC.
The method is unaware of headers.
-
Go: Send headers for server streaming RPC.
Directly call
metadata.AppendToOutgoingContext(ctx,kv)in the method. -
Node.js: Send headers for server streaming RPC.
Use the basic method directly within your RPC method.
-
Python: Send headers for server streaming RPC.
Use the basic method directly within your RPC method.
-
-
Client streaming RPC
-
Java: Send headers for client streaming RPC.
The method is unaware of headers.
-
Go: Send headers for client streaming RPC.
Directly call
metadata.AppendToOutgoingContext(ctx,kv)in the method. -
Node.js: Send headers for client streaming RPC.
Use the basic method directly within your RPC method.
-
Python: Send headers for client streaming RPC.
Use the basic method directly within your RPC method.
-
-
Bidirectional streaming RPC
-
Java: Send headers for bidirectional streaming RPC.
The method is unaware of headers.
-
Go: Send headers for bidirectional streaming RPC.
Directly call
metadata.AppendToOutgoingContext(ctx,kv)in the method. -
Node.js: Send headers for bidirectional streaming RPC.
Use the basic method directly within your RPC method.
-
Python: Send headers for bidirectional streaming RPC.
Use the basic method directly within your RPC method.
-
Propagate headers
For end-to-end tracing to work, trace metadata from an upstream service must be passed to downstream services to form a complete trace. This requires that tracing-related headers received by the server are propagated to the client making the downstream request.
In Go, Node.js, and Python, the communication model methods are aware of headers. This allows you to read, pass, and send headers sequentially within the same RPC method.
In Java, reading and writing headers are handled by two separate interceptors. This prevents implementing header propagation in a single sequential process. Due to concurrency and the read interceptor's exclusive access to the unique trace ID, you cannot use a simple caching mechanism to bridge the two interceptors.
Java provides a Metadata-Context Propagation mechanism to solve this problem.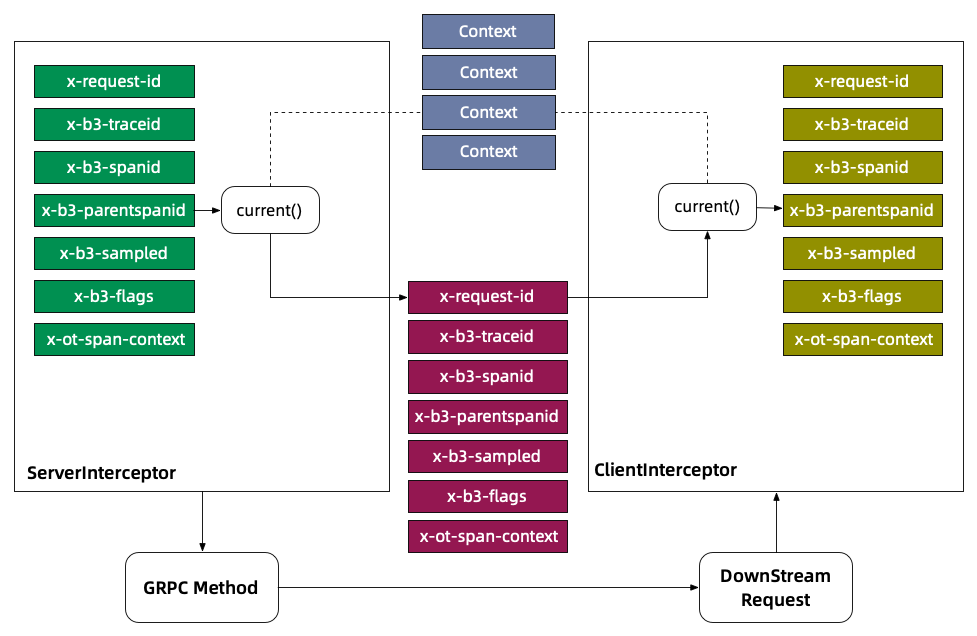
In the server interceptor, store the Metadata/Header in the Context by using ctx.withValue(key, metadata), where key is of the Context.Key<String> type. Then, in the client interceptor, retrieve the Metadata from the Context by using key.get(). The get method uses the Context.current() context by default, which ensures that the headers for a single request are read from and written to the same context.
With this propagation mechanism in place, you can reliably implement tracing for gRPC-based services.
Deploy and verify the mesh topology
Before you implement gRPC tracing, you must deploy and verify the mesh topology to ensure that all services can communicate with each other.
Navigate to the tracing directory in the sample project. This directory contains deployment scripts for all four programming languages. The following example uses the Go version to deploy and verify the mesh topology.
cd go
# Deploy the topology
sh apply.sh
# Verify the topology
sh test.sh
If no errors are reported, the mesh topology is communicating correctly.
The post-deployment Service Mesh topology is shown in the following figure.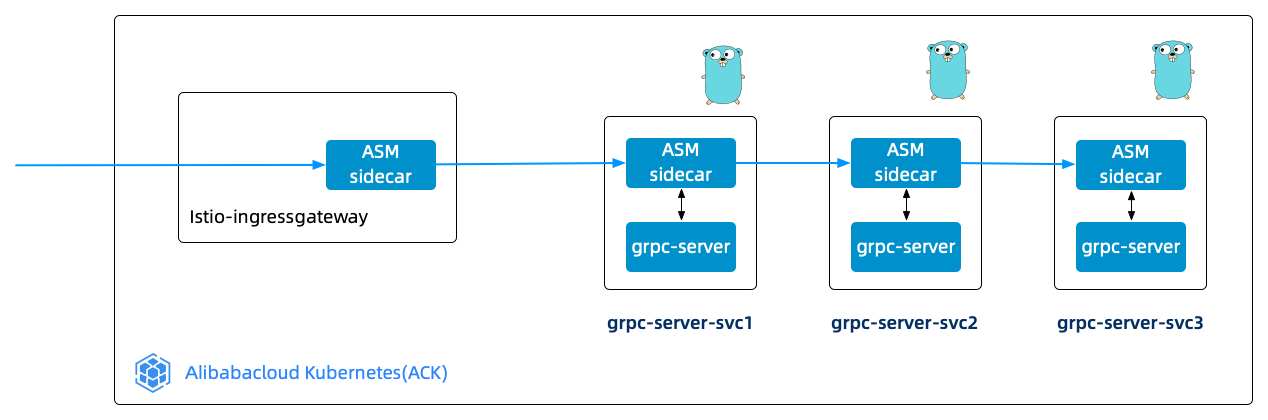
View traces
-
Configure your ASM instance to report trace data to Managed Service for OpenTelemetry. For more information, see Configure ASM to report trace data.
-
Log on to the Managed Service for OpenTelemetry console. In the left-side navigation pane, click Trace Entrance.
-
On the Trace Entrance page, find your target application and click Application Topology.
You can see the full trace, which includes the path from the local request client to Ingressgateway, and then to grpc-server-svc1, grpc-server-svc2, and grpc-server-svc3. The page displays a vertical topology of the service call chain for the target application (such as
istio-ingressgateway), showing the call relationships fromistio-ingressgatewayto multiple layers ofgrpc-serverservices. Each node is labeled with its success rate and call multiplier. -
On the End-to-End Aggregation page, click the End-to-End Aggregation tab to view the end-to-end aggregation.
The End-to-End Aggregation page displays aggregated trace information in a hierarchical table. The columns include Span name, Application name, Requests/request ratio, Spans/request, Avg. self duration/ratio, Avg. duration, and Errors/error ratio. You can expand each level of the call hierarchy to view the performance metrics for each Span.
-
On the End-to-End Aggregation tab, click a trace under the Span name column to view its details.
The top of the trace details page displays metadata, including Start time, Duration, Applications, Trace depth, and Total spans. The table below shows a hierarchical view of each Span, with columns for Span name, a Timeline visualization, Application name, Start time, IP address, and Status. This allows you to visualize the call hierarchy and duration distribution among services.