Envoy sidecars in Service Mesh (ASM) generate distributed trace spans for every request. You can export these spans to Alibaba Cloud Managed Service for OpenTelemetry or to a self-managed backend such as Zipkin or SkyWalking. The export method depends on your ASM version.
How it works
When tracing is enabled, every Envoy sidecar generates trace spans for inbound and outbound requests. ASM forwards these spans through one of two paths:
Direct export (versions earlier than 1.18.0.124, and 1.22.6.89 or later) -- ASM sends spans directly to Managed Service for OpenTelemetry. Enable this in the ASM console.
Collector-based export (versions 1.18.0.124 to earlier than 1.22.6.89) -- Deploy an OpenTelemetry Collector in the Container Service for Kubernetes (ACK) cluster, then point ASM at the Collector. The Collector forwards spans to Managed Service for OpenTelemetry over gRPC.
Envoy sidecars generate independent spans. To join spans into end-to-end traces, your application must propagate trace context headers between services. Forward the following headers in every request:
x-request-idtraceparentandtracestate(W3C Trace Context)For Zipkin:
x-b3-traceid,x-b3-spanid,x-b3-parentspanid,x-b3-sampled,x-b3-flags(B3 format) Without header propagation, traces appear as disconnected spans rather than a single correlated trace.
Prerequisites
Before you begin, make sure that you have:
An ACK cluster added to an ASM instance. See Add a cluster to an ASM instance
Managed Service for OpenTelemetry activated for your Alibaba Cloud account. For billing information, see Billing rules
An ingress gateway created in the ASM instance. See Create an ingress gateway
Check your ASM version
Configuration steps differ by ASM version. To check your version:
Log on to the ASM console.
In the left-side navigation pane, choose Service Mesh > Mesh Management.
Click the name of your ASM instance. The version appears on the Base Information page.
To upgrade, see Update an ASM instance.
Export to Managed Service for OpenTelemetry
Choose the procedure that matches your ASM version.
Versions earlier than 1.17.2.35
Log on to the ASM console. In the left-side navigation pane, choose Service Mesh > Mesh Management.
Click the name of the target ASM instance. In the left-side navigation pane, choose ASM Instance > Base Information.
On the Base Information page, click Settings. In the Settings Update panel:
Select Enable Tracing Analysis.
Set the Sampling Percentage.
For Sampling Method, select Enable Managed Service for OpenTelemetry.
Click OK.
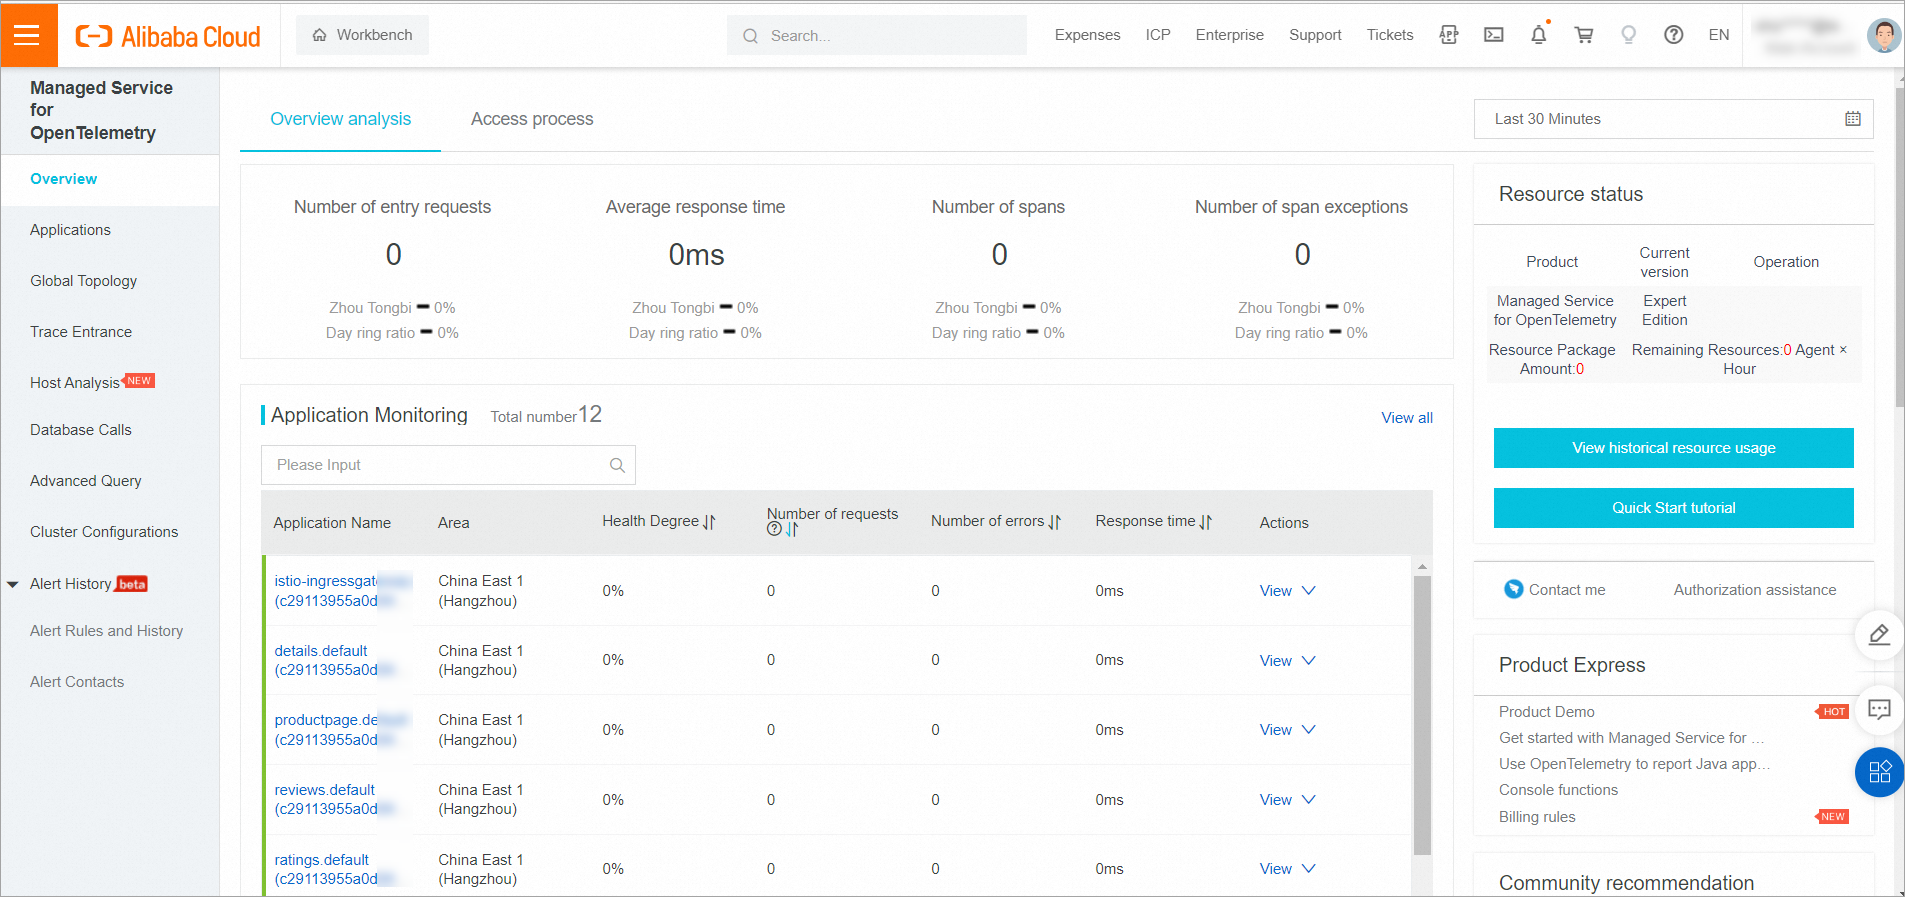
In the left-side navigation pane, choose Observability Management Center > Tracing Analysis. The Managed Service for OpenTelemetry console opens and displays the ASM tracing data.
For more information about Managed Service for OpenTelemetry, see What is Managed Service for OpenTelemetry?
Versions 1.17.2.35 to earlier than 1.18.0.124
Log on to the ASM console. In the left-side navigation pane, choose Service Mesh > Mesh Management.
Click the name of the target ASM instance. In the left-side navigation pane, choose Observability Management Center > Tracing Analysis.
Click Collect ASM Tracing Data to Managed Service for OpenTelemetry. In the Submit dialog, click OK.
Click Open the Managed Service for OpenTelemetry Console to view the tracing data.
For more information about Managed Service for OpenTelemetry, see What is Managed Service for OpenTelemetry?
Versions 1.18.0.124 to earlier than 1.22.6.89
In this version range, the ASM console does not offer built-in Managed Service for OpenTelemetry integration. Instead, deploy an OpenTelemetry Collector in the ACK cluster and configure ASM to send spans to it.
Step 1: Deploy the OpenTelemetry Operator
Connect to the ACK cluster with kubectl. Create the
opentelemetry-operator-systemnamespace:kubectl create namespace opentelemetry-operator-systemInstall the OpenTelemetry Operator with Helm:
   helm repo add open-telemetry https://open-telemetry.github.io/opentelemetry-helm-charts
   helm install --namespace=opentelemetry-operator-system opentelemetry-operator open-telemetry/opentelemetry-operator \
     --set "manager.collectorImage.repository=otel/opentelemetry-collector-k8s" \
     --set admissionWebhooks.certManager.enabled=false \
     --set admissionWebhooks.autoGenerateCert.enabled=true
Verify the Operator is running: Expected output: A
STATUSofRunningconfirms that the Operator is ready.kubectl get pod -n opentelemetry-operator-systemNAME READY STATUS RESTARTS AGE opentelemetry-operator-854fb558b5-pvllj 2/2 Running 0 1m
Step 2: Deploy the OpenTelemetry Collector
Create a file named
collector.yamlwith the following content. Replace the two placeholders before applying:Note This sample configuration deploys a single-replica Collector without persistent storage. For production workloads, increase the replica count and configure appropriate resource requests and limits.Placeholder Description How to obtain ${ENDPOINT}VPC gRPC access point for Managed Service for OpenTelemetry See Access and authentication instructions ${TOKEN}Authentication token See Access and authentication instructions Apply the Collector to the cluster:
kubectl apply -f collector.yamlVerify the Collector pod is running: Expected output:
kubectl get pod -n opentelemetry-operator-systemNAME READY STATUS RESTARTS AGE opentelemetry-operator-854fb558b5-pvllj 2/2 Running 0 3m default-collector-5cbb4497f4-2hjqv 1/1 Running 0 30sVerify the Collector service exists: Expected output: The
default-collectorservice listening on port 4317 confirms a successful deployment.kubectl get svc -n opentelemetry-operator-systemopentelemetry-operator ClusterIP 172.16.138.165 <none> 8443/TCP,8080/TCP 3m opentelemetry-operator-webhook ClusterIP 172.16.127.0 <none> 443/TCP 3m default-collector ClusterIP 172.16.145.93 <none> 4317/TCP 30s default-collector-headless ClusterIP None <none> 4317/TCP 30s default-collector-monitoring ClusterIP 172.16.136.5 <none> 8888/TCP 30s
Step 3: Enable tracing in the ASM console
Log on to the ASM console. In the left-side navigation pane, choose Service Mesh > Mesh Management.
Click the name of the target ASM instance. In the left-side navigation pane, choose Observability Management Center > Observability Settings.
On the Observability Configuration page, in the Link Tracking Settings section, set Sampling Percentage to 100, then click Submit.
In the left-side navigation pane, choose Observability Management Center > Link Tracking. Configure the following fields:
Field Value Opentelemetry Service Address/domain Name default-collector.opentelemetry-operator-system.svc.cluster.localOpentelemetry Service Port 4317Click Collect Service Mesh Link Tracking Data To Opentelemetry.
Versions 1.22.6.89 or later (recommended)
Log on to the ASM console. In the left-side navigation pane, choose Service Mesh > Mesh Management.
Click the name of the target ASM instance. In the left-side navigation pane, choose Observability Management Center > Tracing Analysis.
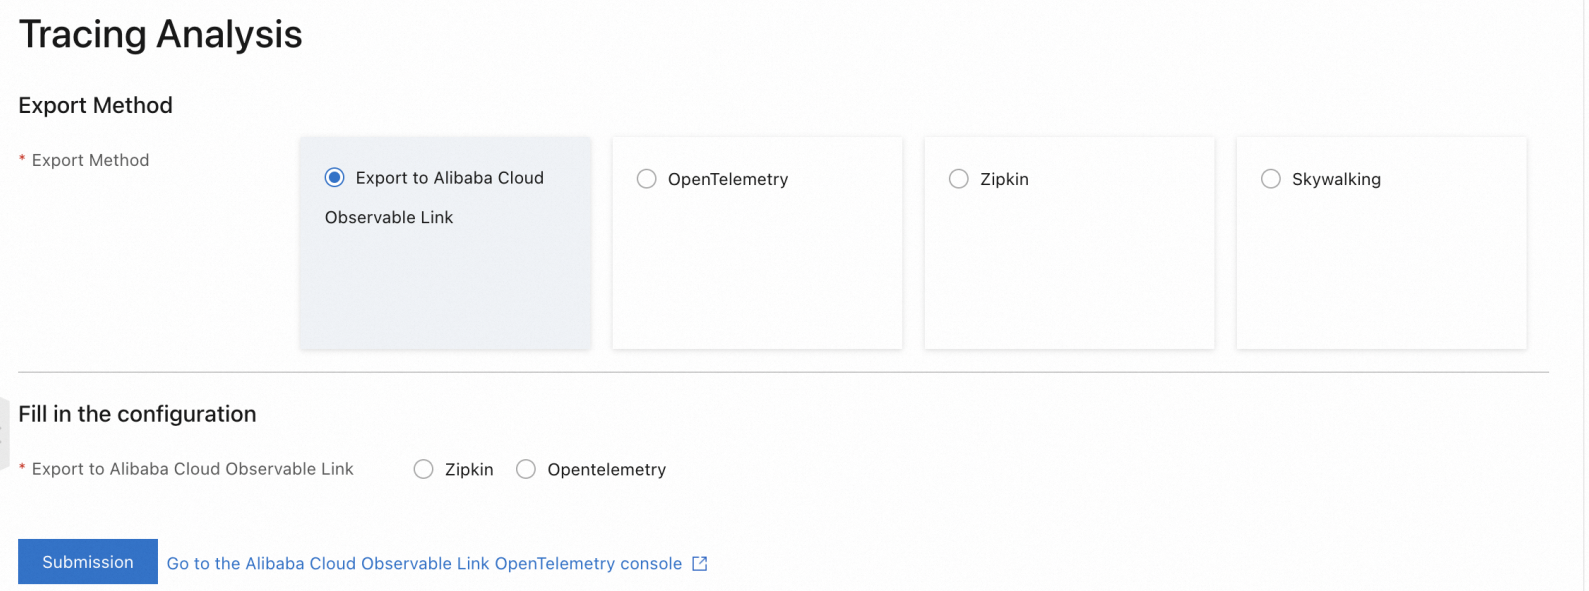
On the Tracing Analysis page, set Export Method to Export to Alibaba Cloud Observable link, choose a data submission protocol under Fill in the configuration (for example, Zipkin), then click Submission.
Click Go To Alibaba Cloud Observable link OpenTelemetry console to view the tracing data. For more information, see What is Managed Service for OpenTelemetry?
 Note To disable tracing, click Disable Collection on the Tracing Analysis page. In the Submit dialog, click OK.
Export to a self-managed tracing system
If you run a self-managed OpenTelemetry-compatible backend, Zipkin, or SkyWalking instance, configure ASM to export spans directly to it.
Versions earlier than 1.18.0.124
Earlier than 1.17.2.28: Log on to the ASM console. On the Basic Information page, click Settings, select Enable Tracing Analysis, configure the settings, then click OK.
1.17.2.28 to earlier than 1.18.0.124: See the Tracing Analysis settings section in "Configure observability settings".
Versions 1.18.0.124 to earlier than 1.22.6.89
Log on to the ASM console. Navigate to Observability Management Center > Link Tracking and configure the following parameters:
| Parameter | Description |
|---|---|
| OpenTelemetry Domain Name (FQDN) | Fully qualified domain name of the self-managed backend. Example: otel.istio-system.svc.cluster.local |
| OpenTelemetry Service Port | Service port of the self-managed backend. Example: 8090 |
Versions 1.22.6.89 or later
Log on to the ASM console. Navigate to Observability Management Center > Link Tracking, then select and configure a self-managed system.
The self-managed tracing backend must be deployed within the ASM instance or registered through a ServiceEntry. If the backend runs outside the mesh, create a ServiceEntry to make it accessible. See ServiceEntry.
The configuration parameters depend on the export protocol:
OpenTelemetry (gRPC)
| Parameter | Description |
|---|---|
| Service domain name (full FQDN) | FQDN of the backend. Example: otel.istio-system.svc.cluster.local |
| Service Port | Service port. Example: 8090 |
| Timeout | Optional. Request timeout in seconds. Example: 1. Disabled by default. |
| Request Header | Optional. Custom headers. Example: authentication: token-xxx. Empty by default. |
OpenTelemetry (HTTP)
| Parameter | Description |
|---|---|
| Service domain name (full FQDN) | FQDN of the backend. Example: otel.istio-system.svc.cluster.local |
| Service Port | Service port. Example: 8090 |
| Request Path | HTTP request path. Example: /api/v2/spans. Default: / |
| Timeout | Optional. Request timeout in seconds. Example: 1. Disabled by default. |
| Request Header | Optional. Custom headers. Example: authentication: token-xxx. Empty by default. |
Zipkin
| Parameter | Description |
|---|---|
| Service domain name (full FQDN) | FQDN of the backend. Example: zipkin.istio-system.svc.cluster.local |
| Service Port | Service port. Example: 8090 |
| Request Path | HTTP request path. Example: /api/v2/spans. Default: /api/v2/spans |
SkyWalking
| Parameter | Description |
|---|---|
| Service domain name (full FQDN) | FQDN of the backend. Example: skywalking.istio-system.svc.cluster.local |
| Service Port | Service port. Example: 8090 |
Verify tracing data
After configuration, generate traffic and confirm that traces appear in the backend.
Deploy sample applications
Deploy the Bookinfo and sleep applications to the data-plane cluster to generate traceable traffic.
Create a file named
bookinfo.yamland copy the following content to it.Deploy the Bookinfo application to the data-plane cluster:
kubectl --kubeconfig=${DATA_PLANE_KUBECONFIG} apply -f bookinfo.yamlCreate a file named
sleep.yamland copy the following content to it.Deploy the sleep application:
kubectl --kubeconfig=${DATA_PLANE_KUBECONFIG} apply -f sleep.yaml
Generate test traffic
From the sleep pod, send 100 requests to the Bookinfo productpage:
kubectl exec -it deploy/sleep -- sh -c 'for i in $(seq 1 100); do curl -s productpage:9080/productpage > /dev/null; done'View traces in Managed Service for OpenTelemetry
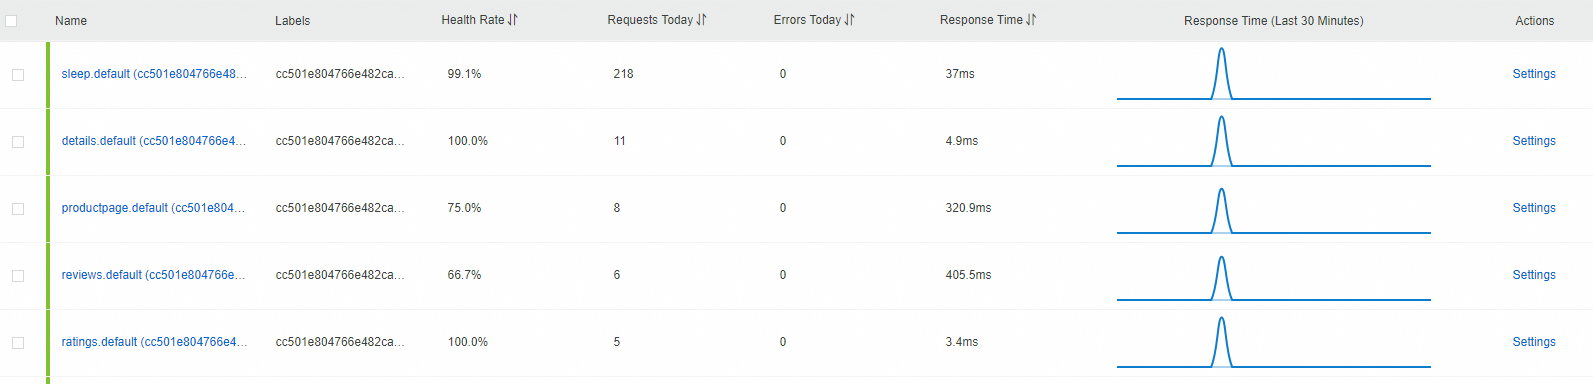
Log on to the Managed Service for OpenTelemetry console.
In the left-side navigation pane, click Application List. The Bookinfo services appear as separate applications, each showing incoming and outgoing spans.