Service Mesh (ASM) automatically generates traces for traffic between services inside the mesh. When a request originates from an application outside the mesh, the sidecar proxy alone cannot produce a unified end-to-end trace. Both the external application and the mesh must report tracing data to the same backend.
This tutorial walks through a concrete example: an external Python application (ExternalProxy) calls the Bookinfo Productpage service inside an ASM instance, and Managed Service for OpenTelemetry assembles the spans from both sides into a single distributed trace.
How it works
ExternalProxy runs outside the mesh. When it receives a request, it creates a root span, generates B3 trace headers, and forwards the request to the ASM ingress gateway.
The ingress gateway and sidecar proxies inside the mesh propagate the B3 headers and generate their own spans.
Both ExternalProxy and the mesh-side proxies report spans to Managed Service for OpenTelemetry through the Zipkin V1 API.
Managed Service for OpenTelemetry correlates spans by trace ID and assembles the complete call trace.
The sidecar proxy forwards all content received in a request, including HTTP headers and the request body, to the upstream service. For end-to-end traces to work, every application in the call chain must propagate tracing-related request headers to downstream requests per the Istio community specifications. The following B3 headers are required:
| Header | Purpose |
|---|---|
X-B3-TraceId | Unique identifier for the entire trace |
X-B3-SpanId | Identifier for the current span |
X-B3-ParentSpanId | Identifier for the parent span |
X-B3-Sampled | Sampling decision (1 = sampled) |
X-B3-Flags | Debug flag |
If any application in the chain drops these headers, the trace breaks into disconnected fragments.
Prerequisites
Before you begin, ensure that you have:
An ASM instance with an ACK cluster added. See Create an ASM instance and Add a cluster to an ASM instance
An ingress gateway deployed for the ASM instance. See Create an ingress gateway
Python 2.7 installed in the runtime environment where the external application runs
Managed Service for OpenTelemetry activated. See Collect ASM tracing data to Managed Service for OpenTelemetry
Usage notes
This tutorial uses Managed Service for OpenTelemetry as the tracing backend. If you use a custom Zipkin-compatible tracing system, skip Step 2: Get the Managed Service for OpenTelemetry endpoint and go directly to Step 3: Deploy the ExternalProxy application. Replace the Zipkin endpoint in the code with your own tracing system endpoint.
Step 1: Deploy the Bookinfo application inside the ASM instance
Deploy the Bookinfo sample application and its networking resources into the ACK cluster managed by the ASM instance.
Deploy the Bookinfo application in the ACK cluster. Download the YAML file from GitHub, then run:
kubectl --kubeconfig=${DATA_PLANE_KUBECONFIG} apply -f bookinfo.yamlDeploy virtual services for the Bookinfo application. Download the YAML file from GitHub, then run:
kubectl --kubeconfig=${ASM_KUBECONFIG} apply -f virtual-service-all-v1.yamlDeploy destination rules for the Bookinfo application. Download the YAML file from GitHub, then run:
kubectl --kubeconfig=${ASM_KUBECONFIG} apply -f destination-rule-all.yamlDeploy a gateway for the Bookinfo application. Download the YAML file from GitHub, then run:
kubectl --kubeconfig=${ASM_KUBECONFIG} apply -f bookinfo-gateway.yaml
Replace the following placeholders with your actual values:
| Placeholder | Description |
|---|---|
${DATA_PLANE_KUBECONFIG} | Path to the kubeconfig file for the ACK cluster (data plane) |
${ASM_KUBECONFIG} | Path to the kubeconfig file for the ASM control plane |
Step 2: Get the Managed Service for OpenTelemetry endpoint
Retrieve the Zipkin V1 endpoint that ExternalProxy uses to report spans.
Log on to the Managed Service for OpenTelemetry console. In the left-side navigation pane, click Overview.
On the Overview page, click the Access process tab, and then click View access point information.
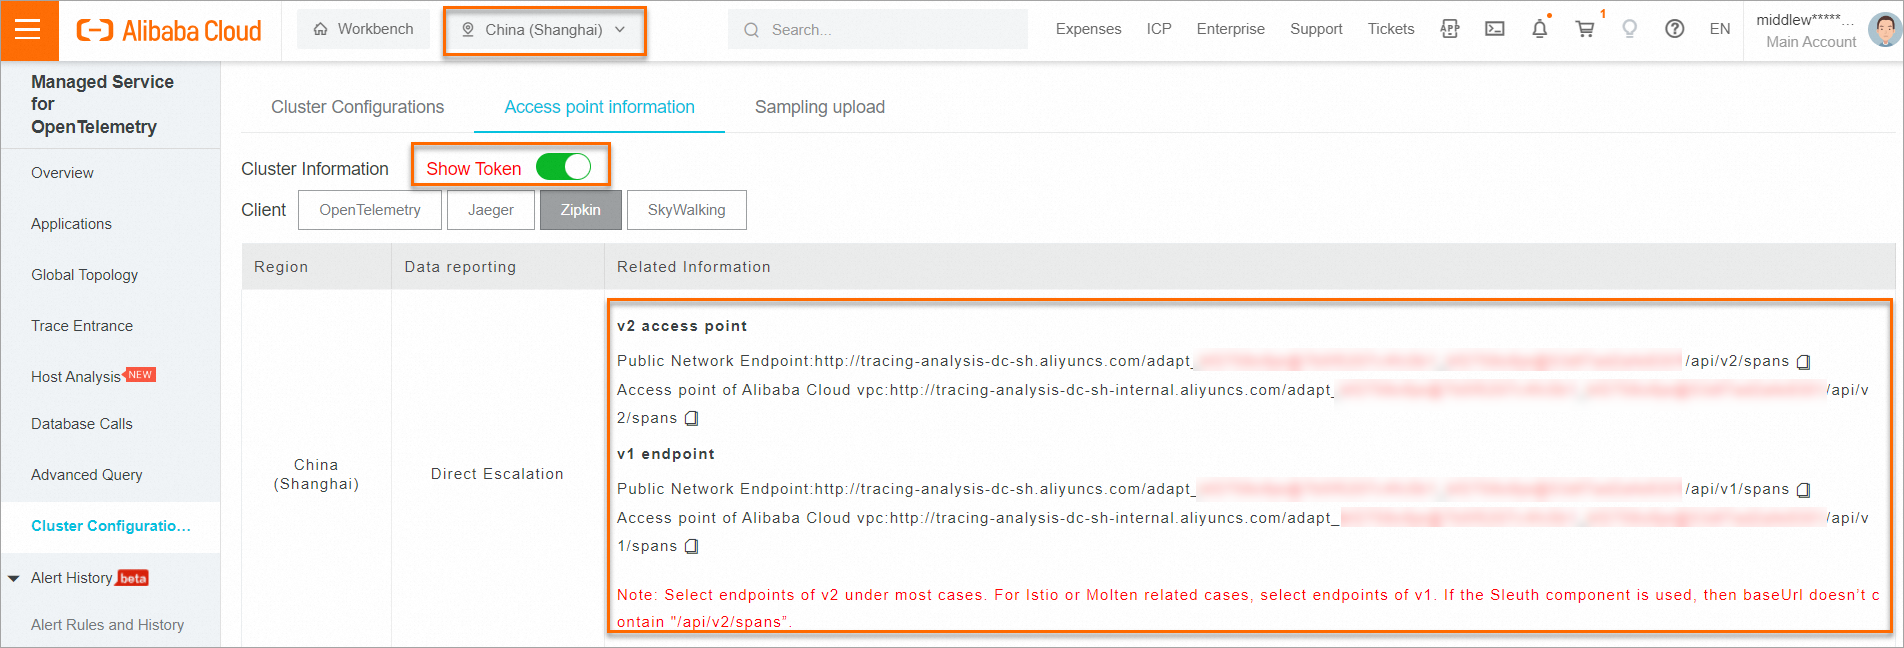
In the upper part of the page, select the region where the ACK cluster is deployed.
ImportantSelect the same region as the ACK cluster. If you select a different region, tracing data from the Bookinfo application cannot reach Managed Service for OpenTelemetry.
On the Access point information tab, turn on Show Token for the Cluster Information parameter. Copy the public or private endpoint for Zipkin V1 based on where ExternalProxy runs:
Public endpoint -- Use this if ExternalProxy runs outside the Alibaba Cloud network (for example, on your local machine).
Private endpoint -- Use this if ExternalProxy runs within the same Alibaba Cloud VPC.
Step 3: Deploy the ExternalProxy application
ExternalProxy is a Python Flask application that creates a Zipkin span for each incoming request and forwards it to the Bookinfo Productpage service through the ASM ingress gateway.
Create a file named
ExternalProxy.pywith the following content: Before running the application, replace the following placeholders:Placeholder Description ${XTRACE_ZIPKIN_V1_ENDPOINT}Zipkin V1 endpoint from Step 2. If you use a custom tracing system, use your own endpoint instead ${INGRESS_GATE_WAY_IP}IP address or hostname of the ASM ingress gateway NoteThe
sample_rate=100setting captures 100% of requests. This is suitable for testing and validation. In production, lower the sample rate (for example, to 1 or 10) to reduce performance overhead and tracing costs.Start ExternalProxy: Expected output:
python ExternalProxy.py* Serving Flask app "main" (lazy loading) * Environment: production WARNING: This is a development server. Do not use it in a production deployment. Use a production WSGI server instead. * Debug mode: on * Running on http://0.0.0.0:5000/ (Press CTRL+C to quit) * Restarting with stat * Debugger is active! * Debugger PIN: 317-792-686Send a test request to ExternalProxy: Expected output: This confirms that ExternalProxy successfully called the Bookinfo Productpage service through the ingress gateway.
curl localhost:5000OK
Step 4: View the trace
Both ExternalProxy and the mesh-side services report spans to Managed Service for OpenTelemetry. Verify the end-to-end trace in the console.
Log on to the Managed Service for OpenTelemetry console.
In the left-side navigation pane, click Applications. In the upper part of the page, select the region where the ACK cluster resides, then click ExternalProxy in the application list.
In the left-side navigation pane, click Application Details. Click the Traces tab, then click a trace ID to view the full call trace. The trace shows the complete request path: ExternalProxy (outside the mesh) to the Bookinfo Productpage service (inside the mesh), with each hop represented as a span. A connected end-to-end trace confirms that header propagation is working correctly.
Troubleshooting
| Symptom | Likely cause | Solution |
|---|---|---|
| ExternalProxy spans appear but are not connected to Bookinfo spans | B3 headers dropped during propagation | Verify that ExternalProxy forwards all five B3 headers (X-B3-TraceId, X-B3-SpanId, X-B3-ParentSpanId, X-B3-Sampled, X-B3-Flags) to the ingress gateway |
| No spans appear in the console | Wrong region selected, or endpoint misconfigured | Confirm the region in the console matches the ACK cluster region. Verify the Zipkin V1 endpoint in ExternalProxy.py |
ExternalProxy returns an error instead of OK | Ingress gateway unreachable | Check that ${INGRESS_GATE_WAY_IP} is correct and the gateway is accessible from the ExternalProxy runtime environment |