The Real User Monitoring (RUM) sub-service of Application Real-Time Monitoring Service (ARMS) allows you to configure alert rules for applications to improve the user experience. If an alert is triggered, alert notifications are sent to the contacts or DingTalk group chat based on the specified notification methods. This topic describes how to configure dynamic thresholds in RUM alerting.
Scenarios
Web & HTML5 application: You can configure static thresholds for web & HTML5 applications to monitor key performance metrics, such as Largest Contentful Paint (LCP), First Input Delay (FID), and Cumulative Layout Shift (CLS). If these metrics encounter anomalies, alerts are triggered to help you quickly locate and fix the anomalies, and improve user experience.
iOS and Android apps: You can configure static thresholds for iOS and Android apps to monitor key performance metrics, such as resource loading, API calls, crashes, and janks. Automatic reporting of abnormal stacks and crash logs helps you quickly locate and fix the anomalies and improve user experience.
Example:
After a new version of an app was released, the number of application janks significantly increased. In this case, you can configure a static threshold for the number of janks so that you can identify and fix them promptly, thus preventing more users from being affected.
Prerequisites
The application is monitored in RUM. For more information, see Integrate applications.
Procedure
Log on to the ARMS console.
In the left-side navigation pane, choose . On the page that appears, click Create an alert rule.
On the Create an alert rule page, specify an alert rule name and set the Alert Detection Type parameter to Interval Detection.
In the Alert Contact section, specify the application, metric type, and filter condition.

Parameter
Description
Select Applications
Select the application for which you want to create the alert rule. You can select only one application for anomaly detection.
Metric Type
Select the type of the metric that you want to detect. For more information, see Alert metrics.
After you select a metric type, the system automatically calculates the upper and lower boundaries and renders the metric trends in real time. You can preview the metric trends in the Alert Condition section.
NoteThe values of the Alert Condition and Filter Condition parameters vary with the value of the Metric Type parameter.
The initial rendering takes about 2 to 4 seconds.
For information about how the upper and lower boundaries are calculated, see the Threshold calculation section.
Filters
Further filter the metric data to narrow down the monitoring scope.
The condition for filtering data related to the dimension. Valid values:
Traverse: matches all alerts of the dimension.
=/!=: exactly matches or excludes alerts of the dimension based on one or more values.
Contain/Do Not Contain: fuzzily matches or excludes alerts of the dimension based on one or more values.
NoteIf you want to display information about a dimension in an alert notification, you must specify the dimension and filter condition. Otherwise, the data is aggregated in the metric query results.
In the Alert Rule section, configure the Alert Condition parameter.
Parameter
Description
Alert Triggering Mode
Valid value: Single Condition.
Alert Condition
Configure alert conditions based on the selected metric type.
Time period: Select the time period for triggering alerts. Example: 5.
Metric: Select the alert metric.
Condition: Select the condition for triggering alerts. Valid values: Greater Than or Equal To, Less Than or Equal To, Month-on-Month Increase %, Month-on-Month Decrease %, Hour-on-Hour Increase %, Hour-on-Hour Decrease %, Day-on-Day Increase %, and Day-on-Day Decrease %.
In the data preview section, the color blue represents data points, and the color green specifies an allowed data range.
NoteIn an alert notification, you can evaluate whether the specified dynamic thresholds are reasonable and check whether the thresholds have recently been triggered. For more information, see the View alert details section.
Tolerance
The tolerance value determines the data range. The higher the tolerance value, the larger the data range and alerts are less likely triggered. The lower the tolerance value, the smaller the data range and alerts are more easily triggered.
Alert Level
The system provides four built-in alert levels. You can configure a notification policy based on the alert level.
For example, you can configure phone calls for P1 alerts and DingTalk group notifications for others.
P1: critical
P2: error
P3: warning
P4: page
Alert Quantity Prediction
View the number of alerts that are expected to be triggered within the time period. Click the number to query the data that is expected to trigger the alerts at the historical points in time.
Each time you create or modify an alert rule, we recommend that you use the alert prediction feature. This feature uses an anomaly detection algorithm to analyze historical data and predict the number of alerts within the specified time period. Then, you can adjust dynamic thresholds based on the prediction results. For more information, see the Alert prediction section.
Configure the Notification Policy parameter and parameters in the Advanced Alert Settings section.
Parameter
Description
Notification Policy
Do Not Specify Notification Policy: If alerts are triggered, no notification is sent. Notifications are sent only when the matching rules of a notification policy is triggered.
Specify a notification policy: If you specify a notification policy, ARMS sends notifications by using the notification method specified in the notification policy. You can select an existing notification policy or create a notification policy. For more information, see Create and manage a notification policy.
Advanced Alert Settings
No data
This parameter is used to fix data anomalies, such as missing data, abnormal composite metrics, and abnormal period-over-period comparison results. If data anomalies can be fixed, the data is automatically changed to 0 or 1, or the alert is not triggered.
For more information, see Terms.
Click Save.
View alert details
After you receive an alert notification, you can view the alert details in the ARMS console. In the left-side navigation pane, choose .
In the following scenarios, the Alert Event History page does not support redirection to the RUM module:
The alert conditions contain aggregation metrics, such as the number of anomalies, the number of resources, or the number of janks.
The alert conditions contain period-over-period comparison, such as Month-on-Month Increase %, Month-on-Month Decrease %, Hour-on-Hour Increase %, Hour-on-Hour Decrease %, Day-on-Day Increase %, or Day-on-Day Decrease %.
Alert Event History
On the Alert Event History page, click the name of an alert event. In the panel that appears, you can view details of the alert. For more information, see View historical alert events.
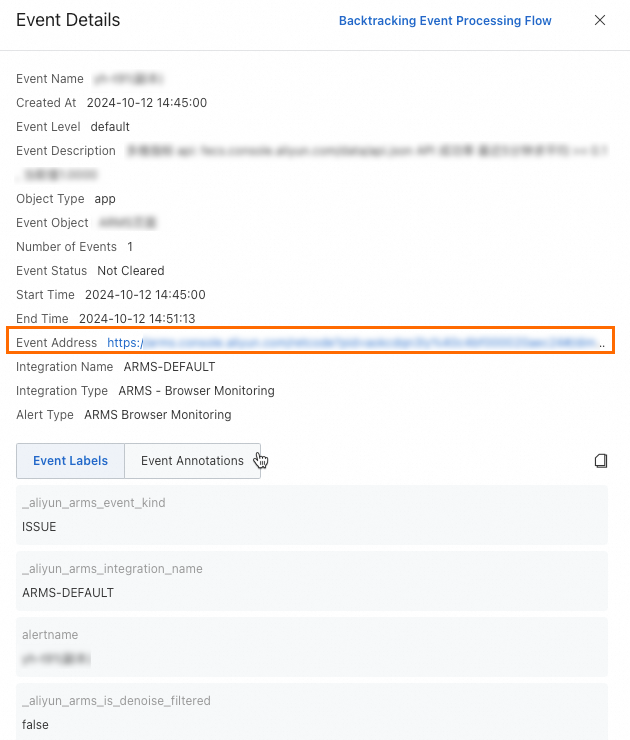
Click the URL of an event to go to the Data Exploration page of the RUM module to view the raw data that triggered the alert.

Threshold calculation
The dynamic thresholds of ARMS are mainly developed based on the Prophet algorithm. After dynamic thresholds are enabled, ARMS analyzes historical data of last 7 days every 24 hours, extracts the tendency and seasonality, and then draws a trend chart for the predicted data in the next 24 hours. At the same time, an expected data range is calculated based on the fluctuations of the metric. When you configure dynamic thresholds, you can preview the upper and lower boundaries calculated by the algorithm. In the following figure, the color blue represents data points, and the color green specifies an allowed data range.
Different from static thresholds, dynamic thresholds do not need to be updated by manually editing alert rules even if the expected data range of a metric changes over time. This is because ARMS analyzes metric trends once a day and predicts the upper and lower boundaries only of the next day.
Alert quantity prediction
The alert quantity prediction feature uses an algorithm to analyze historical data, display the time when historical alerts occur, and then predicts the number of alerts within a specified period of time. The feature helps you configure static thresholds or improve alert sensitivity for dynamic thresholds.
Implementation
Based on metric data in the last 24 hours, ARMS calculates the number of times that each threshold of a metric is exceeded to predict the quantity of alerts in the future. In addition, ARMS provides the metric details, including the specific time when each threshold is exceeded. You can adjust thresholds based on your business requirements.