Managed Service for Prometheus collects a default set of container cluster basic metrics through built-in collection jobs. Some component-level metrics, such as kube-state-metrics data, are not included in these defaults. To collect these metrics, create a custom collection task that targets the specific metrics your workloads require.
This topic uses the _kube-state-metrics job as an example to walk through the process.
Prerequisites
Before you begin, make sure that you have:
Integrated Container Observability
Step 1: Copy the reference configuration
Copy the existing collection configuration to use as a template.
Log on to the ARMS console. In the left-side navigation pane, click Integration Management.
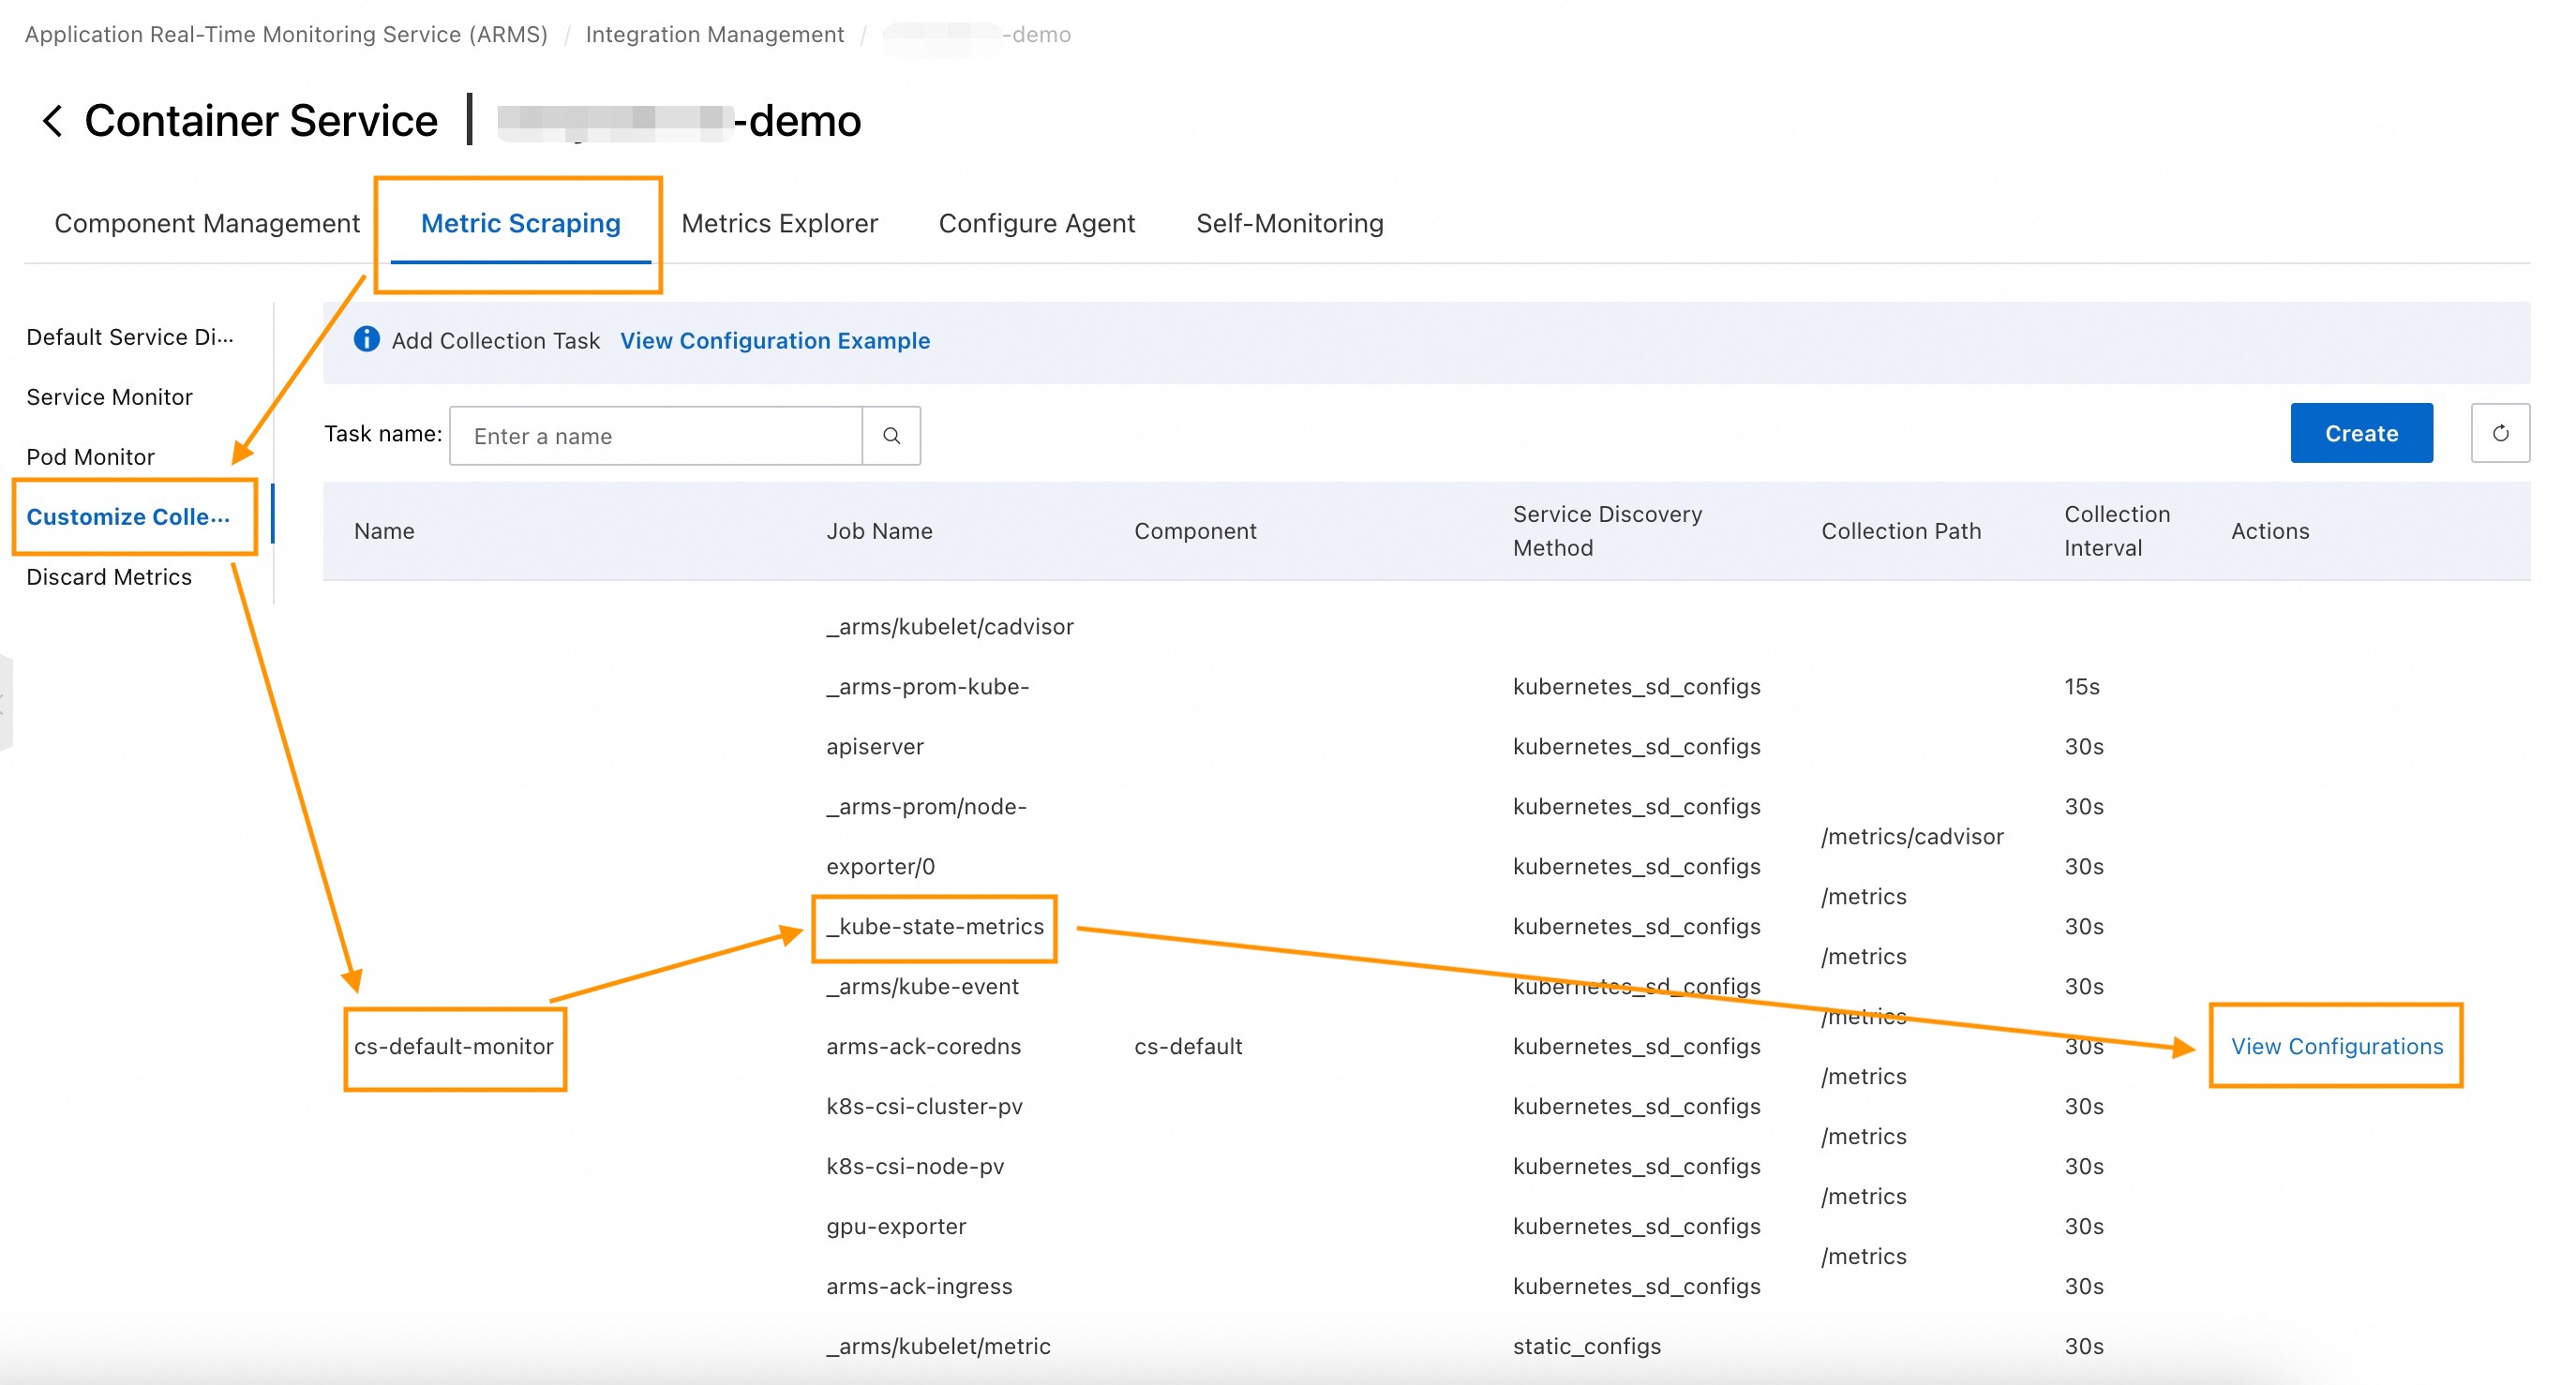
On the Access Management page, click the target access environment, and then click the Metric Collection tab.
In the left-side navigation pane, click Custom Collection, and then navigate to cs-default-monitor > _kube-state-metrics. Click View Configuration and copy the full configuration.
Step 2: Create a custom collection task
On the right side of the page, click Custom Collection, and then click Add.
On the Add Custom Collection Task page, set the following parameters.
Parameter
Description
Example
Task Name
Name of the custom task. Do not use uppercase letters.
ksm_demoCollection Configuration
Paste the configuration you copied in Step 1, then add a
metric_relabel_configsblock at the same level asrelabel_configsto filter for the metrics you need. See the following sample configuration.See below
Sample configuration
This configuration filters three kube-state-metrics values. Replace the metric names in the
regexfield with the ones your workloads require.scrape_configs: - job_name: ksm_job honor_timestamps: true scrape_interval: 30s scrape_timeout: 30s metrics_path: /metrics scheme: http follow_redirects: true ## Add this block to keep only the metrics you need metric_relabel_configs: - source_labels: - __name__ regex: (kube_cronjob_next_schedule_time|kube_job_status_start_time|kube_job_spec_completions) action: keep ## Replace the metric names above with the ones required by your workloads relabel_configs: - action: labelmap regex: .*label_o11y_aliyun_dev_(.*) replacement: $1 - source_labels: - __meta_kubernetes_service_label_app - __meta_kubernetes_service_label_k8s_app separator: ; regex: (kube-state-metrics);.*|.*;(kube-state-metrics) replacement: $1 action: keep - source_labels: - __meta_kubernetes_pod_container_port_number separator: ; regex: 8080 replacement: $1 action: keep - source_labels: - __address__ - __meta_kubernetes_pod_container_port_number separator: ; regex: ([^:]+)(?::\d+)?;(\d+) target_label: __address__ replacement: $1:$2 action: replace kubernetes_sd_configs: - api_server: https://kubernetes.default:8443 role: endpoints authorization: type: Bearer credentials_file: /var/run/secrets/kubernetes.io/serviceaccount/token tls_config: insecure_skip_verify: true follow_redirects: true namespaces: names: - cs-ask-c8034dddd2cf646318b63faf1********The key addition is the
metric_relabel_configsblock. It uses akeepaction with a regex that matches only the specified metric names insource_labels: [__name__]. All other metrics scraped by this job are dropped.Click Check And Create.
Step 3: Verify the collection task
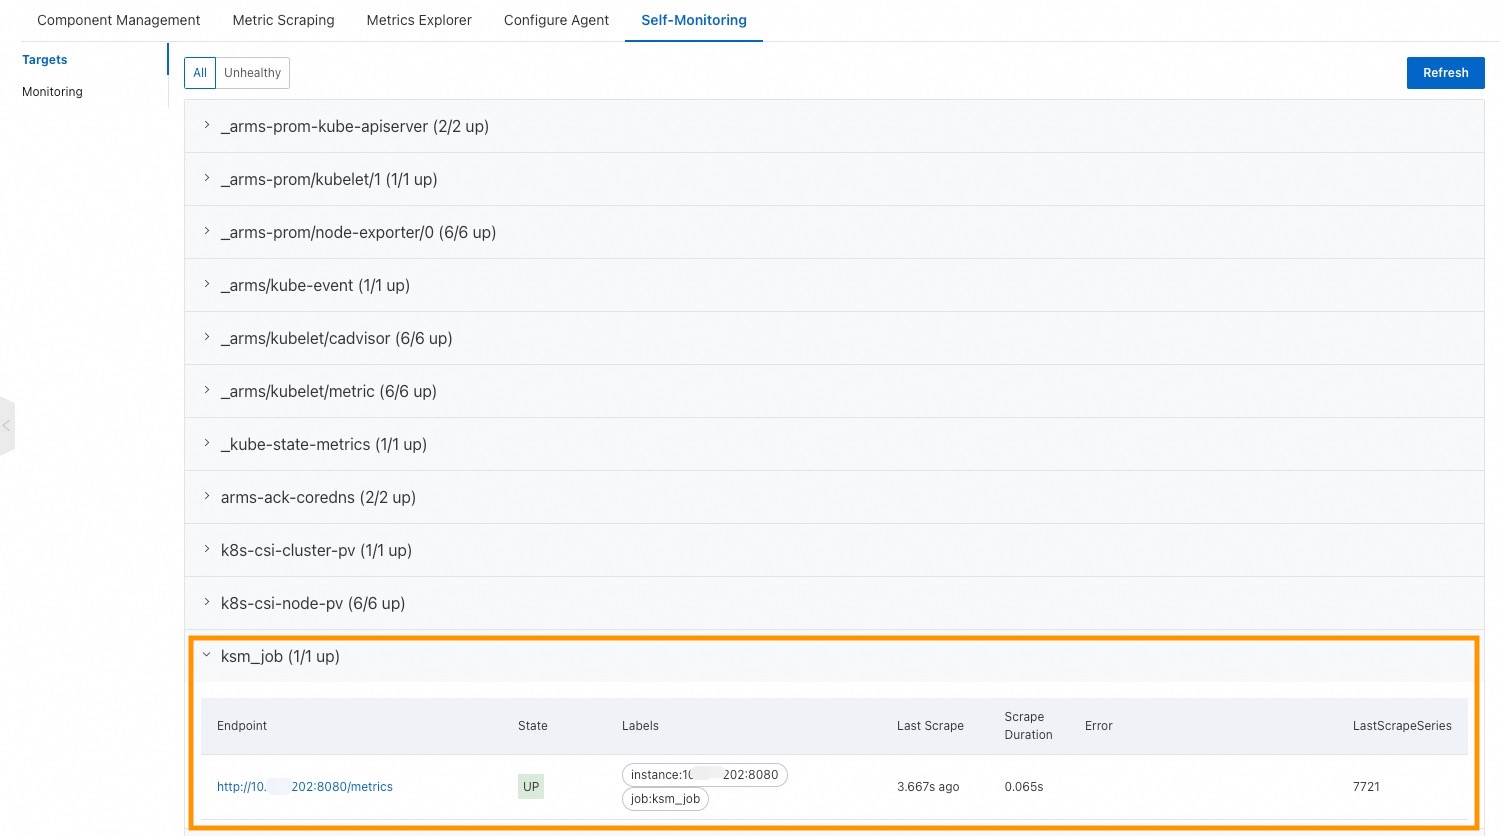
Click the Self-monitoring tab and confirm that the State of your new task shows UP.
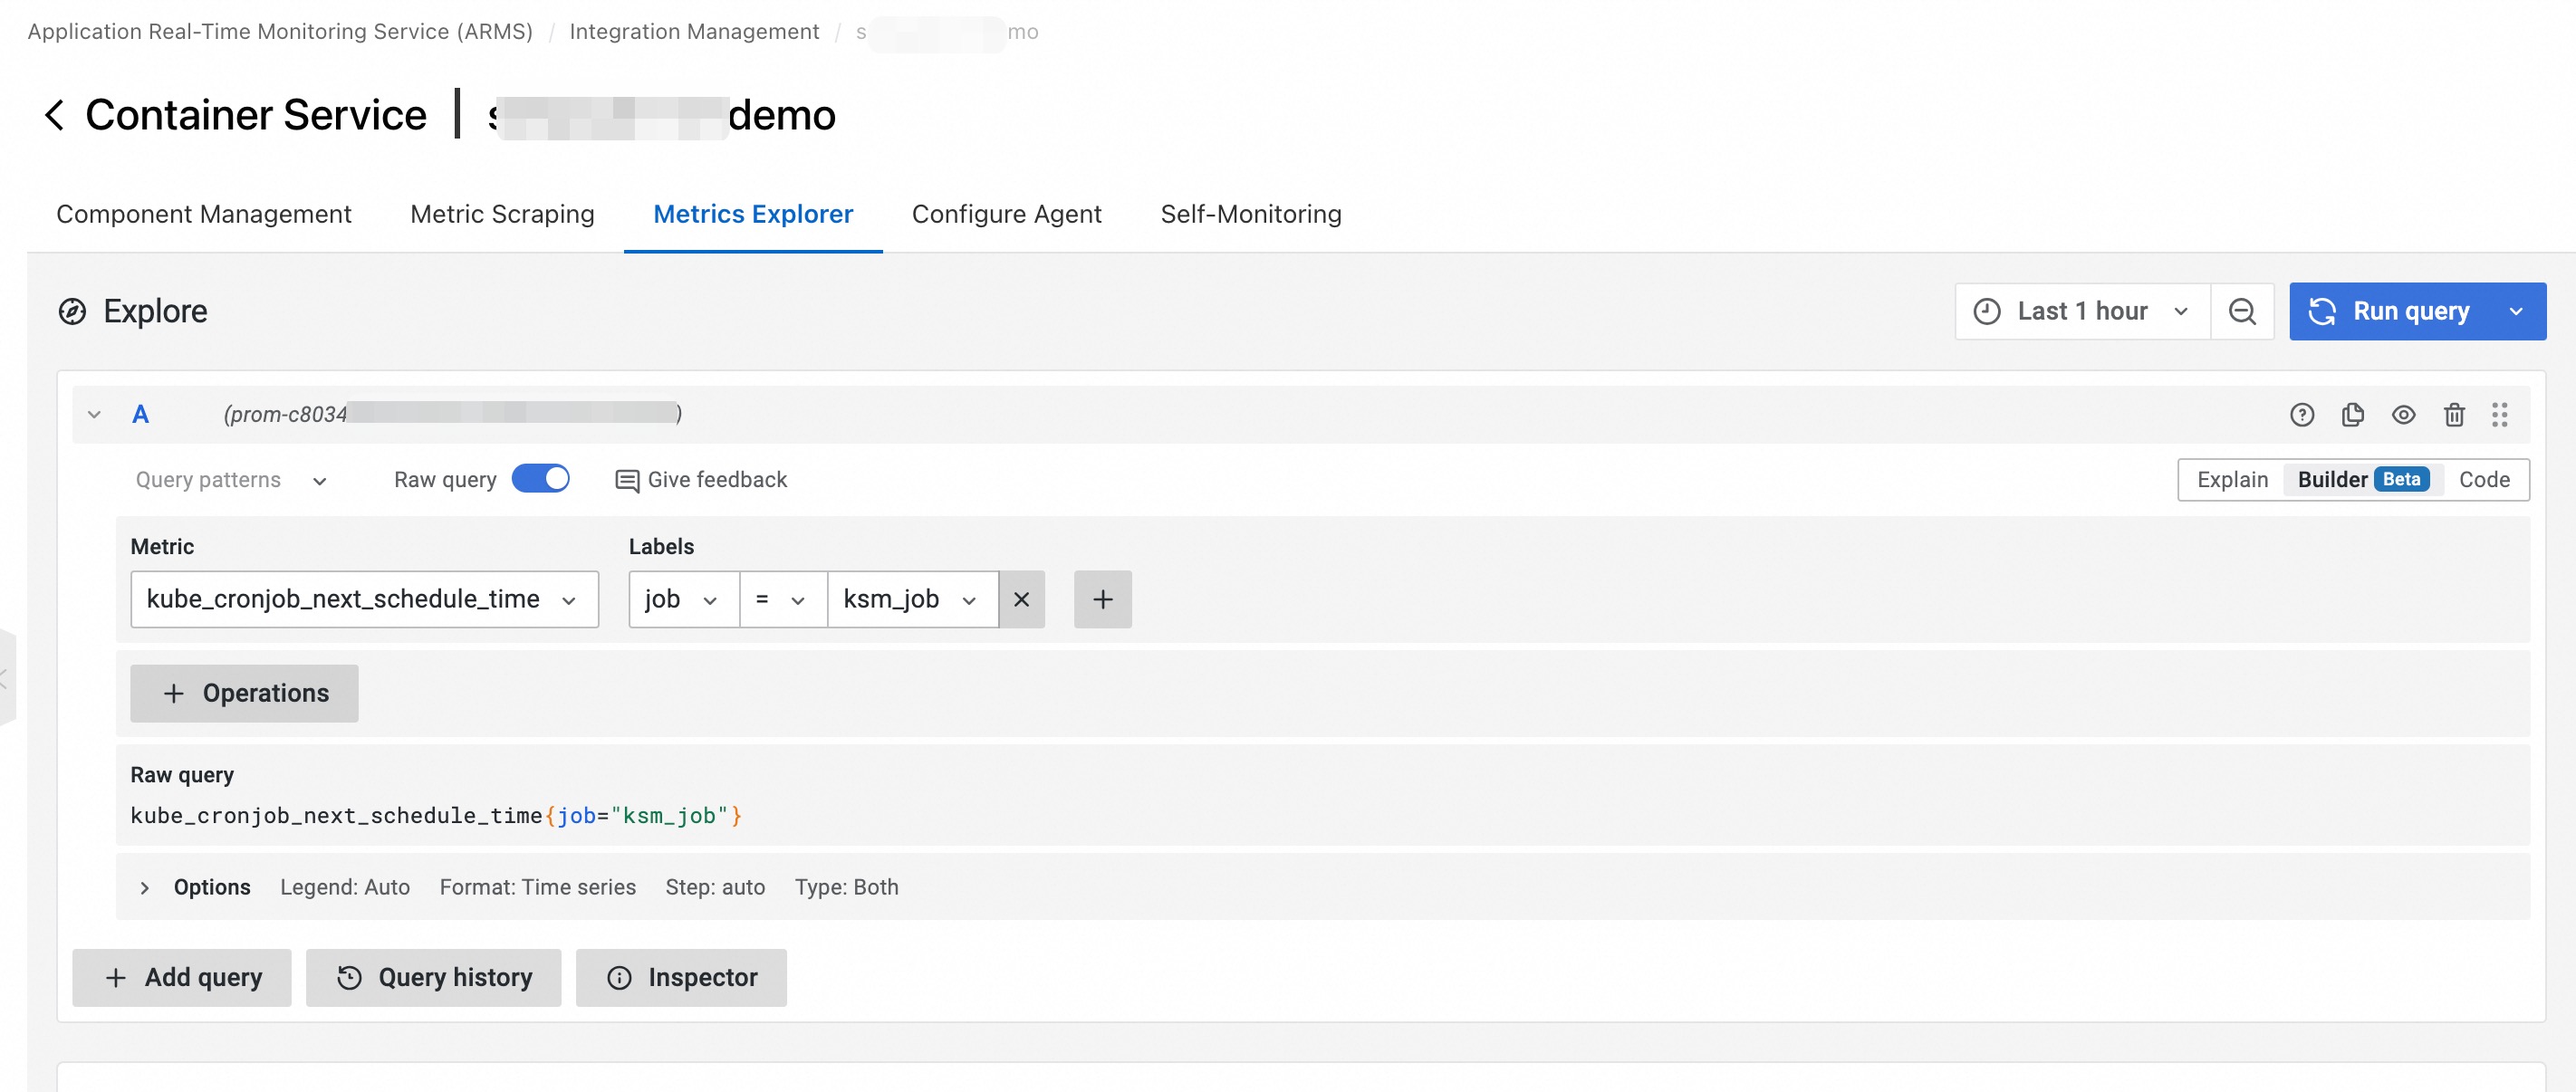
Click the Metric Explorer tab and query the metrics you configured. Use the job name from your custom task (for example,
ksm_job) as the filter value.NoteThe filter value corresponds to the job name specified in your custom collection task.