When a Prometheus agent lacks enough replicas to handle the scrape workload, it runs out of memory and restarts repeatedly, which causes delayed or lost monitoring data. Horizontal Pod Autoscaling (HPA) automatically adjusts the number of agent replicas based on your business requirements to prevent these failures.
How it works
After a Prometheus agent starts, it captures targets to obtain the number of time series, and then calculates the required number of replicas based on the collection capability of each replica. If multiple replicas are required by data collection, HPA transitions the agent from single-replica mode to multi-replica mode and distributes target collection across worker replicas.
Single-replica mode
The master replica handles both target discovery and metric collection. HPA switches to multi-replica mode when either condition is met:
Memory usage of the master replica exceeds 75%.
A sudden surge in targets causes an out of memory (OOM) error.
Multi-replica mode
After the transition, responsibilities split between replica types:
| Replica type | Responsibility |
|---|---|
| Master | Discovers targets only. |
| Worker | Collects metrics from assigned targets. |
When any worker replica's memory usage exceeds 60%, HPA reassigns targets across workers and adds more worker replicas to rebalance the load.
Scheduling limits
The multi-factor collaborative scheduling algorithm enforces these upper bounds:
| Limit | Value |
|---|---|
| Maximum targets per round x total metrics | 4 billion |
| Maximum memory usage per agent | 70% |
| Maximum metrics per agent | 4,000,000 |
Prerequisites
Before you begin, make sure that:
The Helm chart version is 1.0.0 or later. HPA is automatically enabled at this version. If your Helm version is older, upgrade it first. For upgrade instructions, see Component update: Helm v1.1.17 / Prometheus agent v4.0.0
Scaling behavior
| Behavior | Detail |
|---|---|
| Maximum replicas | 30 (default cap). Automatic scale-out does not exceed this limit. |
| Automatic scale-in | Not supported. Removing replicas during active collection can cause data loss. Reduce the replica count manually through the console. |
Adjust the replica count
Log on to the ARMS console.
On the Instances page, click the name of the target Prometheus instance.
In the left-side navigation pane, click Settings.
On the Settings tab, click Replicas in the Actions column.
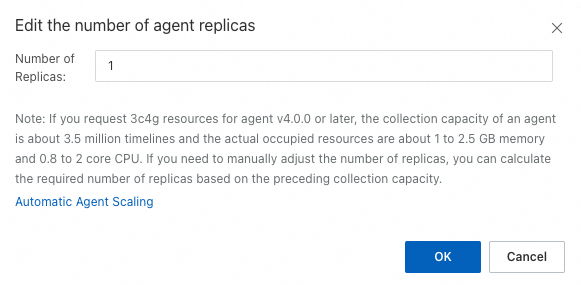
In the dialog box, specify the desired number of replicas and click OK.
Verify the replica count
After you adjust the replica count, confirm that the change took effect and that monitoring continues to work correctly.
Log on to the ARMS console.
On the Instances page, click the name of the target Prometheus instance.
In the left-side navigation pane, click Dashboards, then open the Prometheus Agent dashboard.
On the dashboard, you can view the running status of the Prometheus agent, time consumed to capture real-time and historical metrics, number of targets captured, amount of data sent, and resource usage. For a detailed explanation of each metric, see Self-monitoring dashboard of the Prometheus agent.