The Prometheus agent has been updated to v4.0.0. The corresponding Helm version is v1.1.17. Prometheus agent v4.0.0 has provided various new features, improved data collection stability, fixed bugs, and optimized resource consumption.
If you are using the Prometheus agent v3.x.x, we recommend that you update the agent at the earliest opportunity because these versions have unoptimized features and may have data disconnection risks.
Changes of v4.0.0
Change type | Description |
New feature | Metric collection jobs can be created for cluster events. Cluster events can be displayed in the Kubernetes Deployment dashboard. |
New feature | Self-monitoring metrics can be instrumented based on the service-level agreement (SLA) to stabilize the dashboard data. SLA stability data can be displayed in self-monitoring dashboard. |
New feature | ServiceMonitor supports the BasicAuth authentication method. Secrets must be in the same namespace as ServiceMonitor. |
New feature | Metrics Metadata capabilities are provided to display the description of specific metrics. |
New feature | The Agent Chart version can be passed to the server. Then, the server initializes or updates the dashboard based on the version. |
New feature | Remote write self-monitoring metrics are supported to calculate the time consumed to send data in each batch. |
New feature | Metrics about the errors and latency of basic metric collection are supported. |
New feature | Metrics about the errors and latency of basic metric collection are supported. |
Optimization | The queue_config parameter in remote write settings supports the following default values: min_shards=10, max_samples_per_send=5000, and capacity=10000. This improves the adaptability of large-scale clusters. |
Optimization | The service discovery methods, especially the PV settings of Container Storage Interface (CSI) data collection, are optimized. |
Optimization | The senderLoop distribution frequency is optimized, and the syncWorkersSeries frequency is modified to reduce unnecessary disturbances. |
Optimization | Some logs are simplified. Detailed information, such as the time consumed for trace capturing, can be displayed in some logs. |
Optimization | The collection period and collection timeout settings of basic metric collection jobs are separately configured, and the global configurations are no longer used. This reduces unnecessary interference on basic metric data collection. |
Optimization | The interaction logic in master-slave multi-replica mode is optimized. The Masters and Workers no longer affect each other. This helps improve stability. |
Optimization | The policy that specifies how the Master distributes Targets is optimized. This saves about 30% CPU utilization and 40% memory resources, and improves data collection performance. |
Optimization | metrics_relabel is optimized. CPU utilization is reduced by 70%. |
Optimization | The multi-tenancy listening logic of Informer is optimized to save CPU utilization by 20% in multi-tenancy scenarios. |
Optimization | Cache IP addresses can be automatically used if CoreDNS fails to resolve domain names in real time. This improves the success rate of data transmission. |
Optimization | The distribution and collection configuration logic of SendConfig is optimized to improve configuration stability. |
Optimization | The Master prefetching policy is optimized to reduce the resource overhead of Master, and improve Master service discovery and target scheduling capabilities. |
Optimization | Adaptive control is implemented on data packets that exceed 1 MB in size in a single batch. This reduces data loss caused by backend restrictions. |
Bug fix | The issue that some ScrapeLoop Targets are repeatedly collected is fixed. |
Bug fix | In multi-tenancy scenarios, the Label caches of pods are not updated in a timely manner. As a result, duplicate timelines are generated. This issue is fixed. |
Bug fix | Some targets related to out-of-memory (OOM) errors or replica restarting are not collected. This issue is fixed. |
Bug fix | Secret parsing issues and remote write Header transmission issues are fixed. |
Bug fix | Occasionally, the Kubernetes-pods cannot be shut down. This issue is fixed. |
Bug fix | The issue that the global default parameters and the external_labels parameter do not take effect is fixed. Parameters can be modified. |
Risks
Risk: The update to Helm v1.1.17 or Prometheus agent v4.0.0 is lossy. The monitoring data may be disconnected. The more Targets and Series are collected, the more likely that data is disconnected. The estimated disconnection time ranges from 0 to 5 minutes. The time also depends on the cluster.
Before you update Helm or the Prometheus agent, we recommend that you check the relevant parameters in advance to minimize the impact of the update on the monitoring data of the cluster. For more information, see the 1. Pre-update check items (required) section.
If data is abnormal after you update Helm or the Prometheus agent, you must troubleshoot the problem at the earliest opportunity. For information about the check items, see the 3. Post-update check items (optional) section. For information about the troubleshooting, see the FAQ section. If the problem persists, contact technical support (DingTalk ID: aliprometheus).
Update method
1. Pre-check items (required)
If you update Helm from a version earlier than 1.1.16 to 1.1.17, some modified parameters will not be retained. Therefore, you must record and manually configure the modified parameters.
If you update Helm from 1.1.16 or later to 1.1.17, all the parameters are retained. Perform the following steps to check the parameters before the update:
Log on to the Container Service for Kubernetes (ACK) console.
Click the name of the cluster. In the left-side navigation pane, choose Workloads > Deployments. Set the Namespace parameter to
arms-prom. Findarms-prometheus-ack-arms-prometheus, choose More > View in YAML in the Actions column to view the complete YAML file.Check the following parameters:
spec.replicas: the number of replicas. Helm v1.1.17 and the Prometheus agent v4.0.0 specifies 1 as the default value. If the current value is also 1, ignore the parameter.
args of spec.containers: the startup parameter. The parameter is available only in multi-tenancy mode. If you specify a custom value, pass it again after the update.
tenant_userid
tenant_clusterid
tenant_token
spec.containers.resources.limits and spec.containers.resources.requests: The default CPU limit is 3 and memory limit is 4. The default CPU request and memory request are both 1.
You can modify the default values, and then record and manually configure the modified parameters after the update.

If you need to modify and retain the preceding parameters, record the values. After you update Helm or the Prometheus agent, perform Step 2 to obtain a complete YAML file, modify the values, and then click Update.

2. Procedure
We recommend that you update the Helm version in the ACK console.
Log on to the ACK console.
Click the name of the cluster. In the left-side navigation pane, choose Operations > Add-ons. Click the Logs and Monitoring tab. Find ack-arms-prometheus and click Upgrade.
After the update is complete, choose Operations > Prometheus Monitoring in the left-side navigation pane. Click Go to ARMS Prometheus in the upper-right corner. You are redirected to the dashboard of the corresponding Prometheus instance in the Managed Service for Prometheus console.
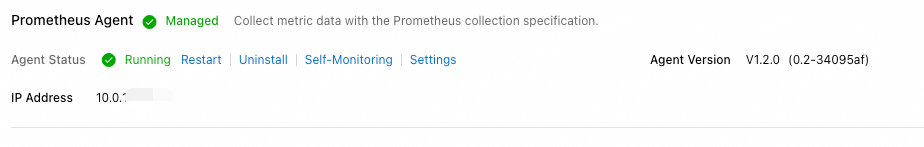
In the left-side navigation pane, click Settings. On the Settings tab, check whether Helm is updated to 1.1.17.
3. Post-update check items (optional)
Log on to the ARMS console.
In the left-side navigation pane, choose .
Click the name of the Prometheus instance. In the left-side navigation pane, click Service Discovery. Click the Targets tab to check collections jobs are completed as expected.
In the left-side navigation pane, click Settings. On the Self-Monitoring tab, click View Grafana Dashboard. You can pay attention to the status of the Prometheus agent by checking the following items: whether the data transmission rate is as expected, whether an exception occurs when data is sent, whether resources are consumed as expected, and whether the number of replicas is as expected.
On the Agent self-monitoring tab of the Self-Monitoring tab, you can view the self-monitoring dashboard of the Managed Service for Prometheus agent.
You can pay attention to the status of the collection jobs by checking the following basic metrics: _arms/kubelet/cadvisor, _arms/kubelet/metric, _kube-state-metrics, and node-exporter. In the upper-right corner of the page, you can select a time range to check whether exceptions occur before and after the update.
FAQ
Why is the actual number of running replicas after the update different from the expected number of replicas?
Check whether all replicas are running. If one or more replicas are pending, the Prometheus agent cannot work as expected. To view the status of replicas, perform the following steps in the ACK console: In the left-side navigation pane of the cluster details page, choose Workloads > Deployments. Set the Namespace parameter to arms-prom. Then, you can view the replica status.
Why does the ARMS agent consume a large amount of memory and CPU resources after the update?
Check whether an exception occurs when data is sent. If an exception occurs when data is sent, the ARMS agent stores data in the memory, increasing resource consumption. Log on to the ACK console. In the left-side navigation pane of the cluster details page, choose Operations > Prometheus Monitoring. On the Prometheus Monitoring page, click the Others tab and then click the Prometheus Agent tab to view the memory usage and CPU utilization.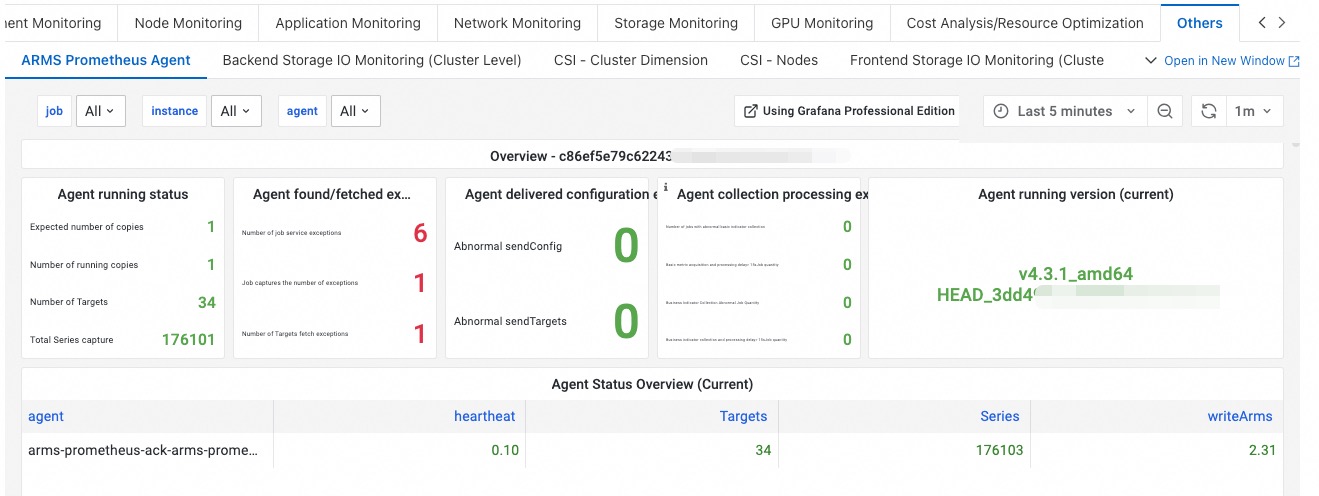
Why are the basic metrics are disconnected or discontinuous after the update?
Assume that node_*** (icon 1), container_*** (icon 2), kubelet_*** (icon 3), and kube_*** (icon 4) are disconnected or discontinuous, as shown in the following figure. You need to check whether error messages are reported when data collection jobs are running. You can view the status of these metrics on the Targets tab of the Service Discovery page in the Managed Service for Prometheus console. If error messages are reported, contact technical support (DingTalk ID: aliprometheus).
Why does remote traffic decrease and why is remote write data missing?
The write_relabel_configs field in the remote write settings of the Prometheus agent v4.0.0 automatically takes effect. However, the field is not available in the earlier version. If you configure actions such as drop and keep, the traffic will drop to a certain extent. You can modify this field based on your business requirements. You can click Edit Prometheus.yaml on the Settings tab of the Settings page in the Managed Service for Prometheus console. In the dialog box that appears, modify the field.