When you integrate an environment with ARMS Prometheus monitoring, you need a way to verify that metrics are actually being collected, inspect label values, or run ad-hoc diagnostic queries. The Metrics Explorer provides a built-in PromQL query interface for each environment, so you can explore time-series data directly in the ARMS console without switching to an external tool.
Prerequisites
Query metrics
-
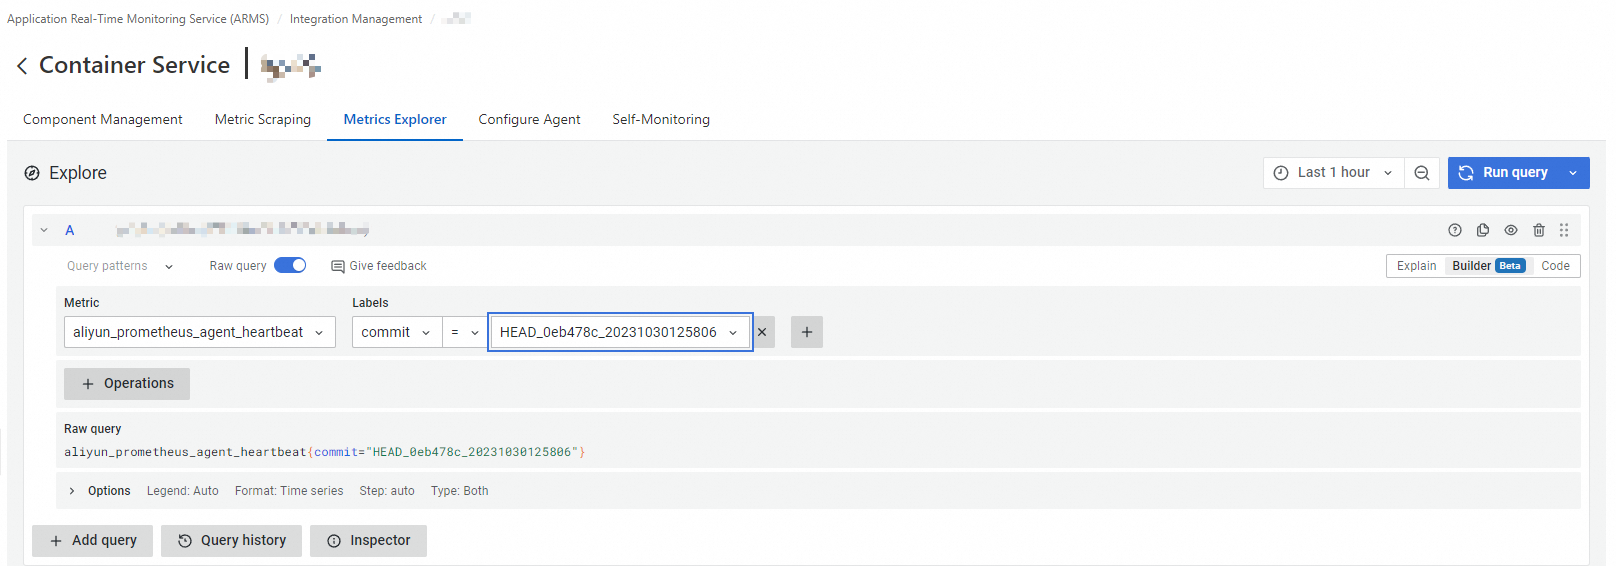
Log on to the ARMS console.
In the left-side navigation pane, click Integration Management.
On the Integrated Environments tab, click the name of the environment whose metrics you want to explore.
On the environment details page, click the Metrics Explorer tab.
In the Explore section, configure the query parameters described in the following table.
Parameter Description Metric The metric name to query. Start typing to search available metrics -- for example, container_cpu_usage_seconds_totalorup.Labels Label matchers that filter the metric by dimensions such as instance,job, ornamespace. Use labels to narrow results to a specific host, service, or cluster.Options Additional query settings, including the evaluation time range and step interval. Adjust these to control the resolution and scope of returned data. Click Run query.
The results appear below the Explore section, showing the metric data stored in the Prometheus instance for this environment. The query uses PromQL syntax.
Common use cases
The following scenarios describe when the Metrics Explorer is most useful:
Verify data collection: After you configure a new integration, query a basic metric such as
upto confirm that the environment is reporting data.Debug missing metrics: If a dashboard shows no data, query the expected metric name in the Metrics Explorer. Use the Labels parameter to check whether data exists for specific label combinations such as
namespaceorjob.Inspect label values: Query a metric and review the returned label keys and values to understand the dimensions available for filtering and aggregation in dashboards or alerts.