Information Technology Service Management (ITSM) of Application Real-Time Monitoring Service (ARMS) is an out-of-the-box intelligent alerting service designed to receive alert notifications from various sources, including Prometheus. The service processes these alerts by automatically deduplicating and grouping them, and applying algorithmic noise reduction techniques. Alerts are then routed to different notification targets based on their label content. This streamlined approach helps O&M teams efficiently manage alerts and significantly reduces project risks. This topic describes how to enable ITSM in Managed Service for Grafana.
Supported Grafana versions
ITSM supports Grafana 9.0.x and later. For information about how to update the Grafana version, see View or modify workspace information.
Step 1: Enable alerting
By default, Grafana 9.0.x and later enables alerting. If the alerting option on the Alert Management page is disabled, you must enable it.
Log on to the ARMS console. In the left-side navigation pane, choose .
Log on to the Managed Service for Grafana console. In the left-side navigation pane, click Workspace Management.
On the Workspace Management page, click the ID of the workspace that you want to manage.
In the left-side navigation pane, click Alert Management. In the upper-left corner of the page, turn on the switch.
In the message that appears, click OK.
In the upper-right corner of the Alert Management page, click Manage Alert Rules. Then, you are redirected to the Grafana ITSM page.
Step 2: Create an alert rule
Grafana 9.0.x
In the left-side navigation pane, choose
 > Browse.
 On the Browse tab, click the dashboard for which you want to create an alert rule.
In the dashboard, click a panel name and select Edit.
On the Edit Panel page, click the Alert tab, and then click Create alert rule from this panel.
NoteYou can also click
 in the left-side navigation pane of Grafana. Then, on the Alert Overview page, click Create Alert Rule to create an alert rule.
 Set the parameters based on your requirements. For more information, see Grafana documentation.
Enter the keys and values of custom labels in the Notifications section. Example:
grafana_alertname=Pod disk usage _hangzhou. These labels can be used to match the alert rule in Step 4: Create a notification policy.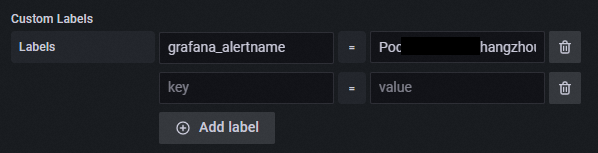
Click Save in the upper-right corner.
When an alert is triggered, the alert event is reported to the Alert Event History page of the ARMS console. For more information, see View historical alert events.
NoteOn the Alert Event History page, you can set the Integration Name filter to ARMS_GRAFANA to query events reported by Grafana alert rules.
Grafana 10.0.x
In the upper-left corner of Grafana, choose
 > Dashboards.
 On the Dashboards page, select the dashboard for which you want to create an alert rule.
In the dashboard, click the icon in the upper-right corner of a panel and click Edit.
On the Edit Panel page, click the Alert tab, and then click Create alert rule from this panel.
NoteYou can also choose
> ITSM in the left-side navigation pane of Grafana. Then, on the Alert Overview page, click Create Alert Rule to create an alert rule. Set the parameters based on your requirements. For more information, see the Grafana documentation.
Enter the keys and values of custom labels in the Notifications section. Example:
grafana_alertname=Pod disk usage _hangzhou. These labels can be used to match the alert rule in Step 4: Create a notification policy.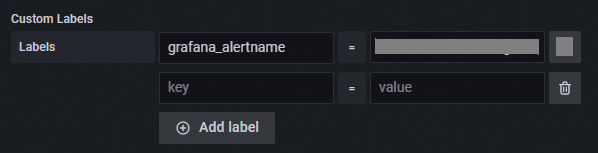
Click Save rule in the upper-right corner.
When an alert is triggered, the alert event is reported to the Alert Event History page of the ARMS console. For more information, see View historical alert events.
NoteOn the Alert Event History page, you can set the Integration Name filter to ARMS_GRAFANA to query events reported by Grafana alert rules.
Step 3: Create notification targets
Grafana 9.0.x
In the left-side navigation pane, choose ![]() > Notification Objects to create notification targets based on your needs. For more information, see Notification targets.
> Notification Objects to create notification targets based on your needs. For more information, see Notification targets.
Contact and contact group: suitable for sending notifications by email, phone call, or SMS.
DingTalk, Lark, and WeCom: suitable for handling alerts in team group chats.
Webhook: suitable for pushing alerts to third-party notification endpoints such as PagerDuty, Microsoft Teams Incoming Webhook, and internal corporate platforms.
On-call scheduling: suitable for scenarios where alerts are handled by team members on a rotating basis.
Grafana 10.0.x
In the upper-left corner of Grafana, click![]() , choose ITSM > Notification Object. Then, create notification targets based on your needs. For more information, see Notification targets.
, choose ITSM > Notification Object. Then, create notification targets based on your needs. For more information, see Notification targets.
Contact and contact group: suitable for sending notifications by email, phone call, or SMS.
DingTalk, Lark, and WeCom: suitable for handling alerts in team group chats.
Webhook: suitable for pushing alerts to third-party notification endpoints such as PagerDuty, Microsoft Teams Incoming Webhook, and internal corporate platforms.
On-call scheduling: suitable for scenarios where alerts are handled by team members on a rotating basis.
Step 4: Create a notification policy
Grafana 9.0.x
In the left-side navigation pane of Grafana, choose
> Notification Policies. Then, click Create Notification Policy. In the upper-left corner of the Create Notification Policy page, set the notification policy name.
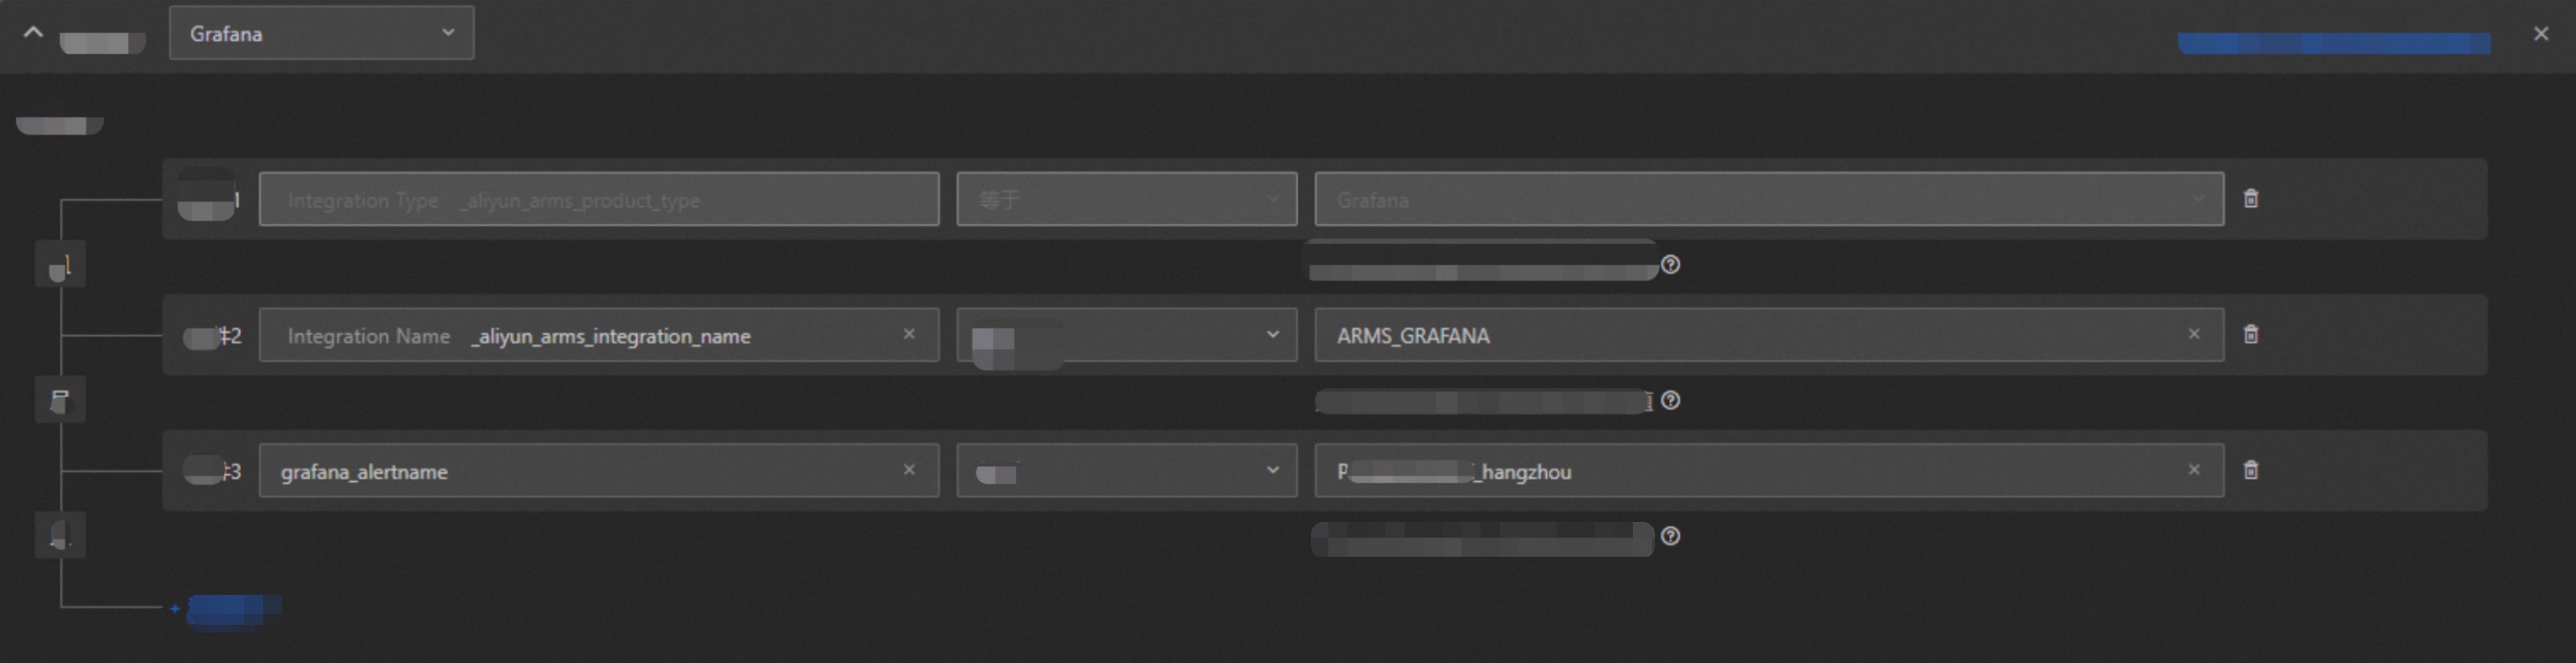
In the Matching Rule step, configure a matching rule for alert events.
Set Data Source to Grafana.
Click Add Condition. Enter the label keys and values configured in Step 2. Example:
grafana_alertname equals Pod disk usage_hangzhou.NoteAs shown in the following figure, Condition 2 filters Grafana alert rules. If you do not add Condition 3, all alert rules in the current Grafana workspace uses this notification policy.
Click Next.
Set other parameters based on your needs and click Save. For more information about how to create a notification policy, see Create and manage a notification policy.
Grafana 10.0.x
In the upper-left corner of Grafana, click
, choose ITSM > Notification Policy, and then click Create Notification Policy. In the upper-left corner of the Create Notification Policy page, set the notification policy name.
In the Matching Rule step, configure a matching rule for alert events.
Set Data Source to Grafana.
Click Add Condition. Enter the label keys and values configured in Step 2. Example:
grafana_alertname equals Pod disk usage_hangzhou.NoteAs shown in the following figure, Condition 2 filters Grafana alert rules. If you do not add Condition 3, all alert rules in the current Grafana workspace uses this notification policy.
Click Next.
Set other parameters based on your needs and click Save. For more information about how to create a notification policy, see Create and manage a notification policy.
Step 5: View alert notifications
When a notification policy is triggered, alert notifications are sent based on the specified notification methods.
Reference
ITSM allows you to send alert notifications through multiple notification methods, such as phone calls, SMS, emails, DingTalk, WeCom, Lark, and webhooks. Then, you can handle alerts in various scenarios with ease. For more information, see Overview.