The thread profiling feature provides statistics on thread-level CPU time consumption and the thread count for each type. ARMS records and aggregates method stacks every 5 minutes to reconstruct the code path, which helps you quickly identify thread-related issues. When you notice high CPU utilization or a large number of slow methods, you can use thread profiling to find the threads or methods that consume the most CPU.
Access
Log on to the ARMS console. In the left-side navigation pane, choose .
On the Application List page, select the region in the top navigation bar and then click the name of the application.
NoteIcons in the Language column have the following meanings:
 : a Java application connected to Application Monitoring.
 : a Golang application connected to Application Monitoring.
 : a Python application connected to Application Monitoring.
-: an application connected to Managed Service for OpenTelemetry.
In the left-side navigation pane, choose .
Analyze threads
The left panel on the Thread Profiling page lists all of your application's threads. You can use the CPU time consumption statistics to quickly identify abnormal threads. After you select an abnormal thread, use the CPU time consumption and Number of Threads charts on the right to analyze how these metrics change over time. For example, you can check whether the total number of threads per minute is excessive.
The Threads chart displays trends for three thread states: RUNNABLE, TIMED_WAITING, and WAITING. The thread list on the left supports sorting by Threads or CPU Time. You can use the search box at the top to filter by host IP.
You can also click Method Stack for an abnormal thread to view its method stack within a specific time range. For example, you can examine the methods that correspond to threads in the BLOCKED state, and then optimize the relevant code snippets to reduce CPU utilization.
For example, after filtering for the Scheduler Worker thread, the method stack analysis result is as follows.
ALL: 365194  RUNNABLE: 986  BLOCKED: 87  WAITING: 1498  TIMED_WAITING: 362617

[BLOCKED] 81/87 - 93.10%

at java.lang.Object.wait (Native Method)
  at xxx.awaitAvailable (BasicResourcePool.java:1315)
  at xxx.prelimCheckoutResource (BasicResourcePool.java:557)
  at xxx.checkoutResource (BasicResourcePool.java:477)
  at xxx.connectionPool.checkoutPooledConnection (C3P0PooledConnectionPool.java:525)
  at xxx.dDataSource.getConnection (AbstractPoolBackedDataSource.java:128)
  at xxx.tConnection (PoolingConnectionProvider.java:247)
  at xxx.nnection (DBConnectionManager.java:108)
  at xxx.rt.getConnection (JobStoreSupport.java:775)
  at xxx.EnhanceJobStoreSupport.getNonManagedTXConnection (EnhanceJobStoreSupport.java:17)
  at xxx.Support.executeInNonManagedTXLock (JobStoreSupport.java:3777)
  at xxx.eSupport.retryExecuteInNonManagedTXLock (JobStoreSupport.java:3742)
  at xxx.reSupport.triggeredJobComplete (JobStoreSupport.java:3039)
  at xxx.ntifyJobStoreJobComplete (QuartzScheduler.java:1804)
  at xxx.obRunShell.java:269)
  at xxx.l$WorkerThread.run (SimpleThreadPool.java:573)

[BLOCKED] 2/87 - 2.30%

at xxx.checkinStatement (GooGooStatementCache.java:220)
  at xxx.heckinStatement (NewPooledConnection.java:239)
  at xxx.ement.close (NewProxyPreparedStatement.java:1807)
  at xxx.seStatement (StdJDBCDelegate.java:3287)
  at xxx.leteFiredTrigger (StdJDBCDelegate.java:2916)
  at xxx.ggeredJobComplete (JobStoreSupport.java:3116)
  at xxx.45.executeVoid (JobStoreSupport.java:3043)
  at xxx.$VoidTransactionCallback.execute (JobStoreSupport.java:3703)
  at xxx.$VoidTransactionCallback.execute (JobStoreSupport.java:3701)
  at xxx.t.executeInNonManagedTXLock (JobStoreSupport.java:3787)
  at xxx.rt.retryExecuteInNonManagedTXLock (JobStoreSupport.java:3742)
  at xxx.ort.triggeredJobComplete (JobStoreSupport.java:3039)
  at xxx.StoreJobComplete (QuartzScheduler.java:1804)
  at xxx.Shell.java:269)
  at xxx.kerThread.run (SimpleThreadPool.java:573)

[BLOCKED] 1/87 - 1.15%
If your agent version is 2.7.3.5 or later, ARMS provides more accurate method stacks for thread CPU usage using the continuous profiling feature. For more information, see continuous profiling.
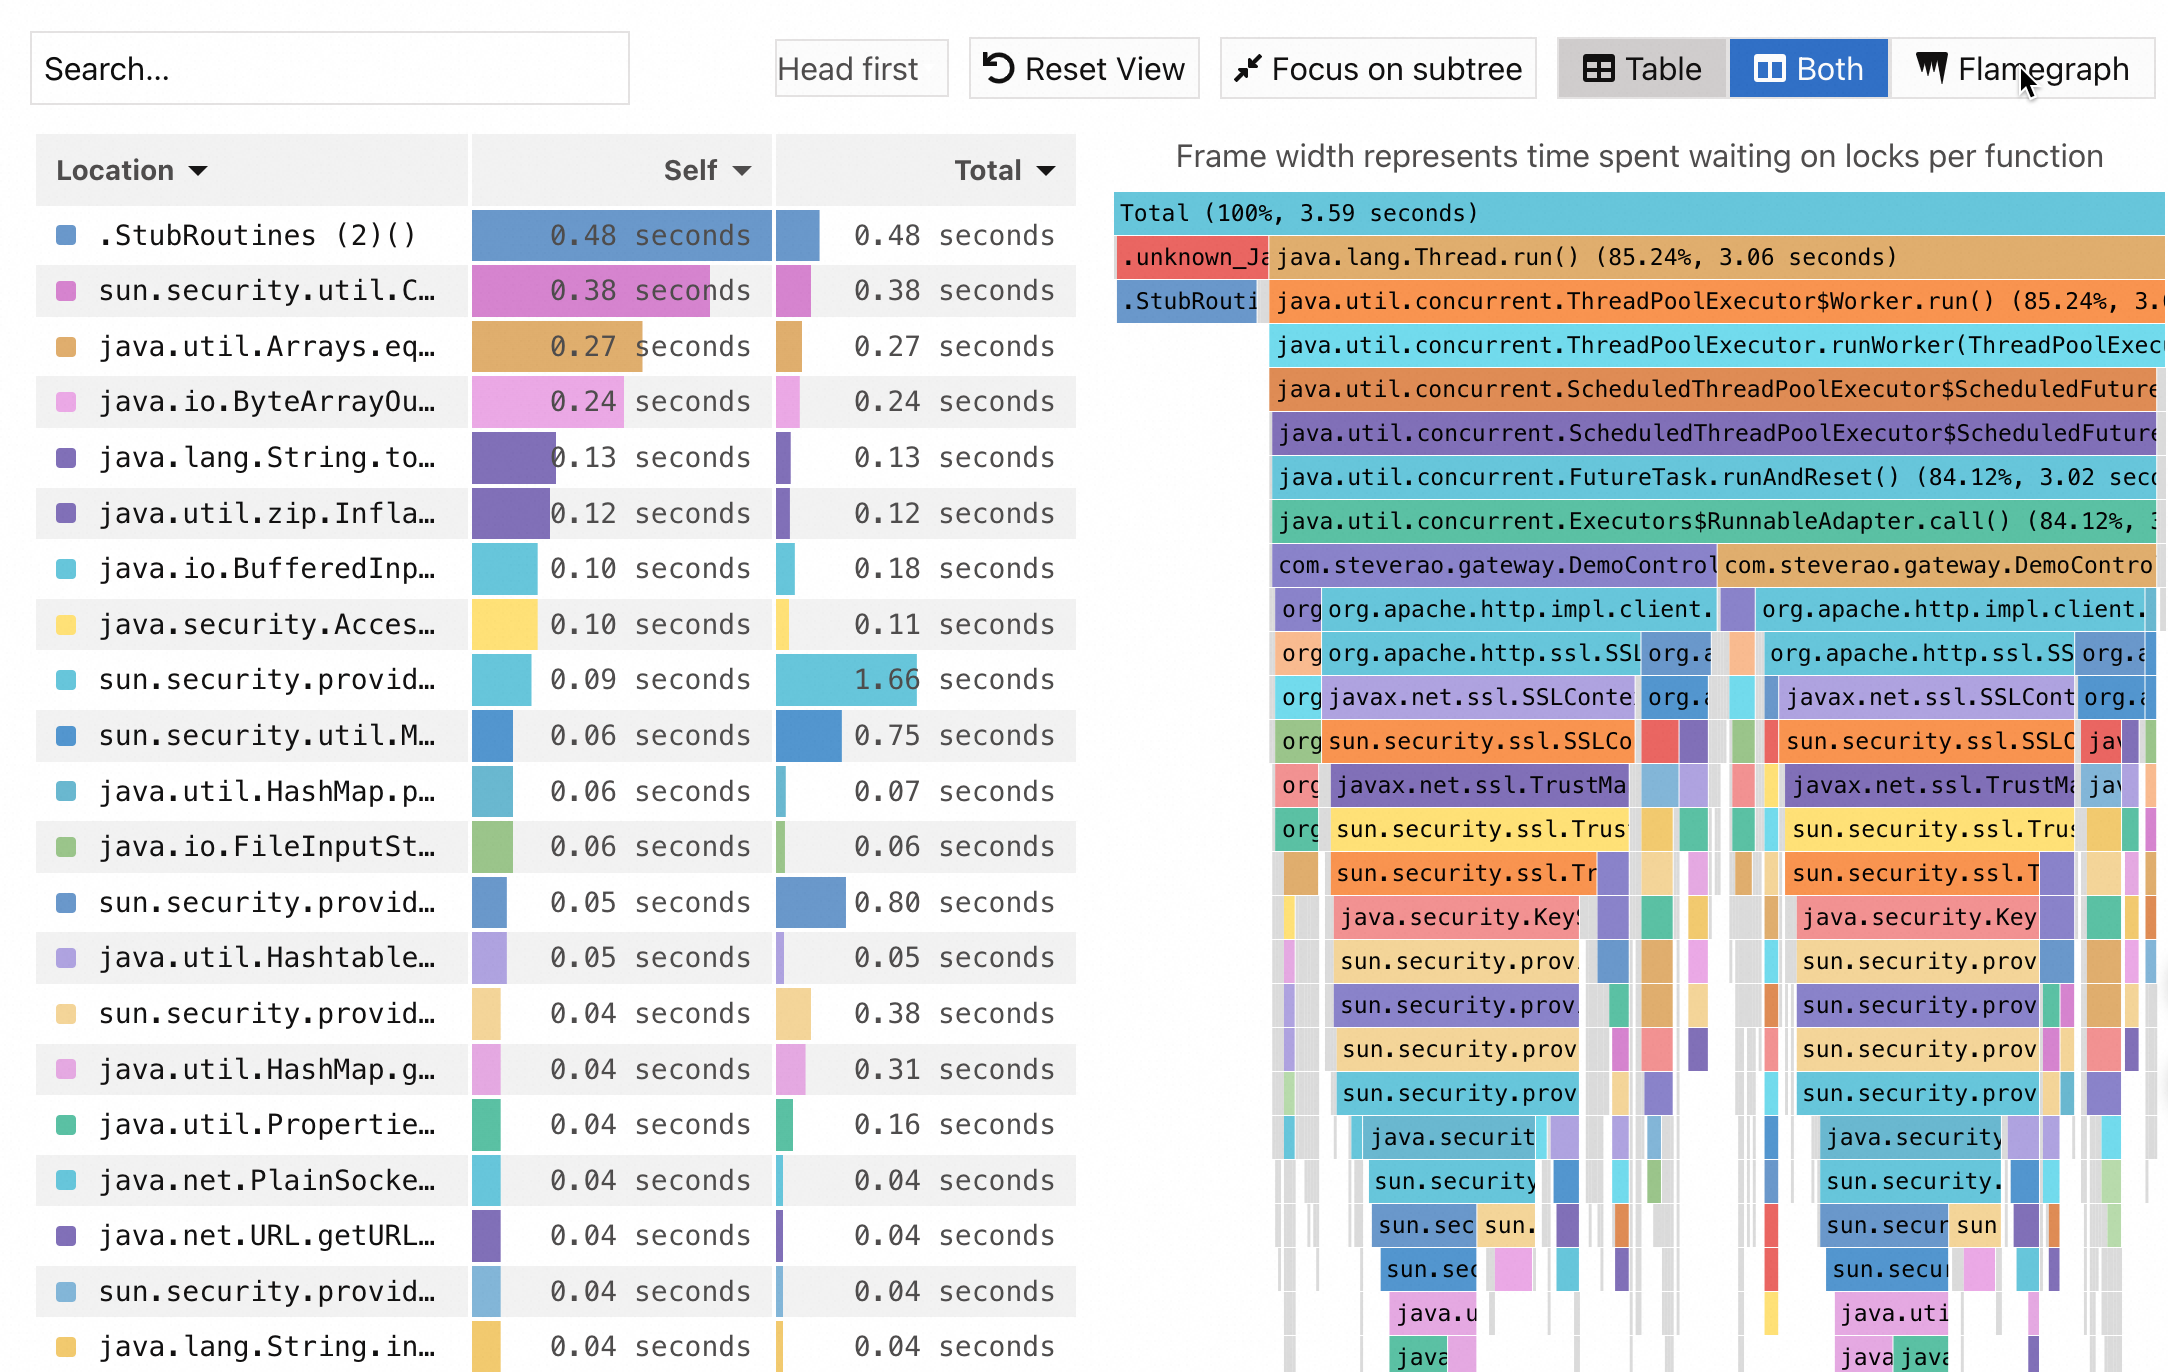
If no data is displayed after you click Method Stack, check the following:
If your agent version is earlier than 2.7.3.5, go to the tab. In the Thread Settings section, check whether the Thread Profiling Method Stack switch is turned on. If the switch is off, ARMS does not record method stack information. If the switch is on, ARMS collects method stack information every 5 minutes.
If your agent version is 2.7.3.5 or later, go to the tab. In the Continuous Profiling section, check whether the Main switch and CPU hotspot switches are turned on. If either switch is off, ARMS does not record method stack information.