Thread profiling provides thread-level statistics on CPU time and thread counts by type. It records and aggregates the method stack of threads every 5 minutes to reconstruct actual code execution and help you quickly pinpoint thread-related issues. If you notice high CPU utilization in your cluster or a large number of slow methods, you can use thread profiling to find the threads or methods that consume the most CPU.
This feature is currently available only for Java applications.
Prerequisites
ARMS application monitoring provides a new monitoring details page for users on the new billing plan. For more information about the new billing plan, see Billing (New).
If you have not enabled the new billing plan, click Switch to New Version on the application list page.
An agent must be installed for your application. For more information, see Application Monitoring Integration Overview.
Procedure
Log in to the ARMS console. In the left-side navigation pane, choose .
On the Application List page, select a target region at the top and then click the name of your application.
NoteThe icons in the Language column have the following meanings:
 : A Java application integrated with application monitoring.
 : A Go application integrated with application monitoring.
 : A Python application integrated with application monitoring.
-: An application integrated with Managed Service for OpenTelemetry.
In the top navigation bar, choose .
Analyze threads
The list on the left of the Thread Profiling page displays all application threads, allowing you to quickly find abnormal threads by their CPU time. After selecting an abnormal thread, use the charts on the right to analyze its CPU time and Number of Threads. For example, check if the total thread count per minute is excessive.
For any abnormal thread, click Method Stack to view its runtime method stack for a specified time period. For example, you can view the methods that correspond to threads in the BLOCKED state. This helps you identify specific code segments to optimize and reduce CPU utilization.
ALL: 365194  RUNNABLE: 986  BLOCKED: 87  WAITING: 1498  TIMED_WAITING: 362617

【BLOCKED】81/87 (times) - Percentage: 93.10%
at java.lang.Object.wait (Native Method)
  at xxx.awaitAvailable (BasicResourcePool.java:1315)
  at xxx.prelimCheckoutResource (BasicResourcePool.java:557)
  at xxx.checkoutResource (BasicResourcePool.java:477)
  at xxx.checkoutPooledConnection (C3P0PooledConnectionPool.java:525)
  at xxx.getConnection (AbstractPoolBackedDataSource.java:128)
  at xxx.getConnection (PoolingConnectionProvider.java:247)
  at xxx.getConnection (DBConnectionManager.java:108)
  at xxx.getConnection (JobStoreSupport.java:775)
  at com.alibaba.arms.alert.scheduler.xxx.EnhanceJobStoreSupport.getNonManagedTXConnection (EnhanceJobStoreSupport.java:17)
  at xxx.executeInNonManagedTXLock (JobStoreSupport.java:3777)
  at xxx.retryExecuteInNonManagedTXLock (JobStoreSupport.java:3742)
  at xxx.triggeredJobComplete (JobStoreSupport.java:3039)
  at xxx.notifyJobStoreJobComplete (QuartzScheduler.java:1804)
  at xxx.JobRunShell.java:269)
  at xxx$WorkerThread.run (SimpleThreadPool.java:573)

【BLOCKED】2/87 (times) - Percentage: 2.30%
at xxx.checkinStatement (GooGooStatementCache.java:220)
  at xxx.checkinStatement (NewPooledConnection.java:239)
  at xxx.close (NewProxyPreparedStatement.java:1807)
  at xxx.closeStatement (StdJDBCDelegate.java:3287)
  at xxx.deleteFiredTrigger (StdJDBCDelegate.java:2916)
  at xxx.triggeredJobComplete (JobStoreSupport.java:3116)
  at xxx.executeVoid (JobStoreSupport.java:3043)
  at xxx.$VoidTransactionCallback.execute (JobStoreSupport.java:3703)
  at xxx.$VoidTransactionCallback.execute (JobStoreSupport.java:3701)
  at xxx.executeInNonManagedTXLock (JobStoreSupport.java:3787)
  at xxx.retryExecuteInNonManagedTXLock (JobStoreSupport.java:3742)
  at xxx.triggeredJobComplete (JobStoreSupport.java:3039)
  at xxx.notifyJobStoreJobComplete (QuartzScheduler.java:1804)
  at xxx.JobRunShell.java:269)
  at xxx.WorkerThread.run (SimpleThreadPool.java:573)

【BLOCKED】1/87 (times) - Percentage: 1.15%
If your agent version is 2.7.3.5 or later, ARMS uses continuous profiling to provide more accurate method stack information on thread CPU usage. The following figure shows an example. For more information, see continuous profiling.
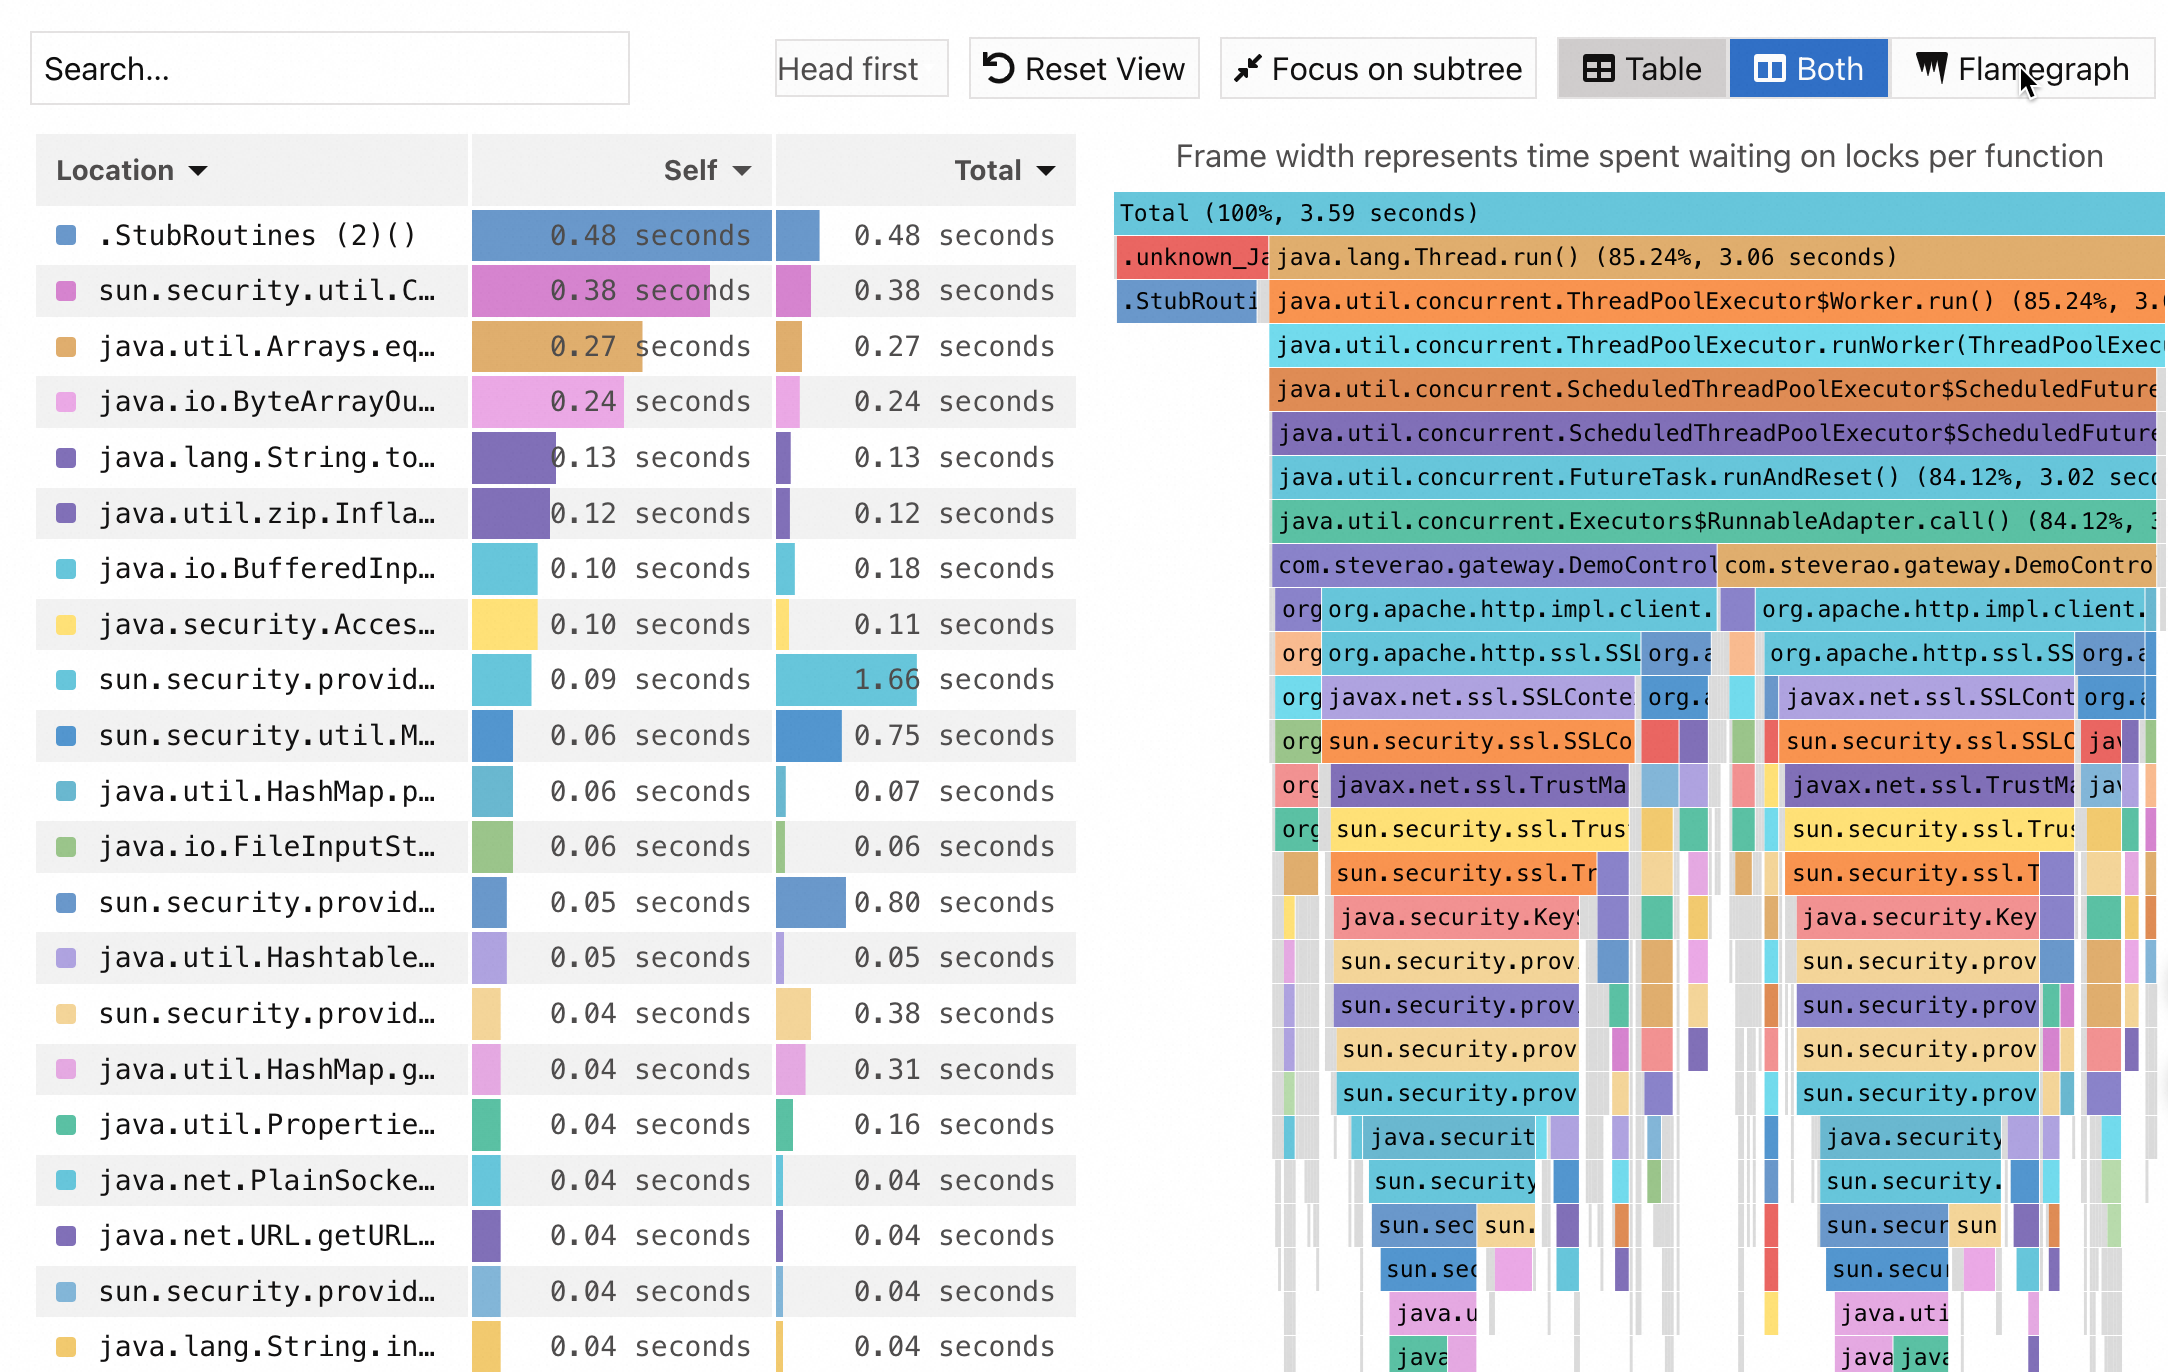
If no data appears after you click Method Stack, follow these steps to troubleshoot:
If your agent version is earlier than 2.7.3.5, go to the Thread Settings section on the tab and check if the Method stack for thread profiling switch is enabled. If this switch is disabled, method stack information cannot be recorded. If it is enabled, method stack information is collected every 5 minutes.
If your agent version is 2.7.3.5 or later, go to the Continuous profiling section on the tab and check that the main switch and the CPU hotspots switch are enabled. Both switches must be enabled to record method stack information.